Key Points
Conjugating venetoclax with DHA (A1) maintains Bcl-2 inhibition ability with enhanced unique NOXA production ability.
A1 overcomes Bcl-xL– and Mcl-1–mediated venetoclax resistance through NOXA-driven degradation of cyclin D1 and Mcl-1 proteins.
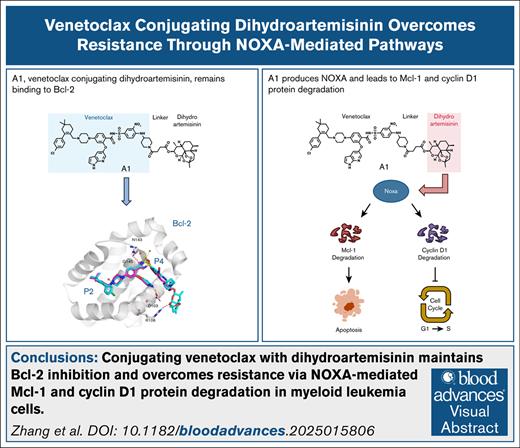
Visual Abstract
The B-cell lymphoma protein 2 (Bcl-2) inhibitor venetoclax remains the sole apoptosis-inducing agent approved for combination therapy in older patients with acute myeloid leukemia (AML). However, its clinical efficacy is frequently constrained by the emergence of drug resistance, which involves the overexpression or induction of the myeloid cell leukemia 1 (Mcl-1) and B-cell lymphoma-extra large (Bcl-xL) proteins. To address this challenge, we developed a novel strategy to enhance venetoclax activity and overcome resistance by producing NOXA through the conjugation of dihydroartemisinin (DHA) to venetoclax using a chemical synthesis approach. The produced conjugate, A1, retained potent Bcl-2 inhibitory activity and significantly enhanced NOXA production by promoting interactions between the DHA-derived endoperoxide bridge and heme. Mechanistically, A1 effectively overcomes resistance caused by Mcl-1 and Bcl-xL protein through NOXA-mediated Mcl-1 and cyclin D1 protein degradation, respectively. Optimization of the linker design of A1 yielded polyethylene glycol (PEG)-linked conjugates with increased in vivo efficacy. This study introduced a new generation of venetoclax-based compounds with dual functionality, specifically enhanced NOXA production and robust degradation of antiapoptotic and cell cycle–regulating proteins. Furthermore, we uncovered a promising therapeutic strategy to overcome drug resistance in venetoclax-based AML treatments.
Introduction
Mitochondria-mediated apoptosis plays a crucial role in regulating the survival of myeloid leukemia cells and the response to chemotherapy.1 The mitochondrial apoptotic pathway is regulated by 3 types of B-cell lymphoma protein 2 (Bcl-2) family proteins, namely the antiapoptotic proteins Bcl-2, Bcl-xL, and Mcl-1; the BH3-only proteins Bid, Bim, Puma, NOXA, and Bad; and the proapoptotic proteins Bak and Bax.2 The interaction between the BH3-only proteins and the antiapoptotic proteins mediates the chemotherapy response in acute myeloid leukemia (AML) cells.3 The levels of the anti-apoptotic proteins Bcl-2, Bcl-xL, and Mcl-1 are key determinants of apoptosis through sequestering BH3-only proteins.4 The Bcl-2, Bcl-xL, and Mcl-1 proteins serve as pivotal targets for developing BH3 mimetics designed to release BH3-only proteins or effector proteins for cancer therapy.5 The Bcl-2 selective inhibitor venetoclax (VEN) is the only approved BH3 mimetic for the treatment of chronic lymphocytic leukemia (CLL).6 VEN, in combination with hypomethylating agents or low-dose cytarabine, was approved and used as the standard of care for older patients with AML who are ineligible for intensive chemotherapy.7,8 However, most patients achieve only transient remission and eventually develop drug resistance, whereas a subset of patients with AML exhibit primary resistance. Overcoming VEN resistance remains a significant clinical challenge. Several mechanisms underlying VEN resistance have been elucidated, including acquired Bcl-2 mutations, specifically G101V and D103Y, observed in certain patients with CLL.9 Orthogonal functional genomic screens in AML model system revealed that deletions or mutations of apoptotic regulators, such as BAX or NOXA, are associated with resistance to VEN.10,11 However, consistent evidence indicates that the high expression of Mcl-1 and Bcl-xL is among the most recurrent determinants that contribute to VEN resistance in AML.12 Although inhibitors targeting Mcl-1 and Bcl-xL are currently under development, none has received regulatory approval as of yet. Clinical trials have revealed that Mcl-1 inhibitors may induce cardiotoxicity,13 whereas Bcl-xL inhibitors have been associated with thrombocytopenia.14 Therefore, it is essential to explore alternative strategies rather than relying solely on the direct inhibitors of Mcl-1 and/or Bcl-xL to effectively overcome VEN resistance.
Mcl-1 is a short-lived protein characterized by rapid synthetic and degrading rates and plays a more critical role in protecting apoptosis in AML cells than Bcl-2.15 The stability of Mcl-1 is enhanced by binding to Bim and reduced by binding to NOXA.16 AML cells typically exhibit high levels of Bim but undetectable levels of NOXA protein. Induction of NOXA represents an alternative strategy for inactivating Mcl-1.17 Previously, we demonstrated that artesunate induces NOXA expression, displaces Bim from Mcl-1, and enhances VEN-induced apoptosis in responsive AML cells, but it does not overcome resistance.18 In addition, we observed that the introduction of a chemical group into dihydroartemisinin (DHA) increases NOXA production ability.19 Leveraging the inhibitory effect of VEN on Bcl-2, we conjugated it with DHA via a chemical linker to generate A1. A1 retains the Bcl-2 inhibition ability and has enhanced NOXA production ability. A1 overcomes both primary and acquired resistance to VEN caused by the high expression of Mcl-1 and Bcl-xL through a novel NOXA-mediated cyclin D1 and Mcl-1 degradation cascade.
Materials and methods
Reagents
DHA, deferoxamine mesylate (DFO), 4,6-dioxoheptanoic acid, and protoporphyrin IX were purchased from Sigma-Aldrich Inc. VEN and A1155463 were purchased from Selleck Chemical. Quinoline-Val-Asp-Difluorophenoxymethylketone (Q-VD-OPh) was purchased from MedChemExpress. Antibodies to poly-ADP ribose polymerase (PARP) and Bcl-xL were obtained from BD Biosciences. Antibodies to Bcl-2, β-actin, Mcl-1, and Bax (6A7) were obtained from Santa Cruz Biotechnology, Inc. Antibodies to Bim, Bak, Bax, and NOXA were obtained from Cell Signaling Technology, Inc. Antibodies to NOXA and cyclin D1 were obtained from Abcam, Inc. Bak (Ab-1) was obtained from Merck Millipore. A1, deoxygenated counterpart of DHA (DODHA), deoxygenated counterpart of A1 (DOA1), and A18-A20 were synthesized. The structures were confirmed with mass spectrometry and nuclear magnetic resonance analysis. The purity of these compounds was measured with high-performance liquid chromatography and was >95%.
Cell lines
U937, Mono Mac 6, THP-1, Kasumi-1, ME-1, MOLM-13, HL-60, KCL22, and K562 cell lines were obtained and used as reported previously.18,20,21 MOLM-13/VEN-resistant cells were established by continuous stimulation of MOLM-13 cells with VEN and maintenance in VEN at a concentration of 500 nM, followed by 1 week of culturing without VEN before the experiments. The KCL22 subclones KB8 and KV2, transfected with Bcl-xL and an empty vector, were established in a previous study.20 These cells were cultured in RPMI 1640 medium supplemented with 100 units/mL penicillin, 100 μg/mL streptomycin, 1 mmol/L L-glutamine, and 10% (volume-to-volume ratio) heat-inactivated fetal bovine serum.
shRNA knockdown
To generate a lentivirus to infect the THP-1 cells, 293T cells were cotransfected with pSLenti-U6-shRNA-CMV-EGFP-F2A-Puro-WPRE that expressed NOXA (PMAIP1)- and Bim (BCL2L11)-specific short-hairpin RNAs (shRNAs) or with a corresponding control plasmid with the packaging constructs packaging lentiviral plasmid/vesicular stomatitis virus glycoprotein (pLP/VSVG) and pLP2. This was performed by OBiO Technology Corp, Ltd (Shanghai, China). The sequence of the shRNA for human PMAIP1 was 5′-GGAAGTCGAGTGTGCTACT-3′; for human BCL2L11 it was 5′-TACGACTGTTACGTTACATTG-3′; and for the control it was 5′-CCTAAGGTTAAGTCGCCCTCG-3′.
RNA-seq analysis
RNA sequencing (RNA-seq) analysis was done by Biomarker Technologies (Beijing, China) on RNA extracted from MOLM-13 and MOLM-13/VEN cells. The RNA was extracted from the cells according to the instruction manual of the TRIzol Reagent kit (Life technologies, Carlsbad, CA). The analyses were performed as previously reported.22
Fluorescence polarization–based binding assay (FPA)
The target protein, Mcl-1, Bcl-2, or Bcl-xL, and the tested compounds were added to the test buffer at different concentrations, mixed, and incubated at room temperature for 30 minutes in the dark. A 26-residue peptide of the BH3 domain of the Bid with 5 carboxy-fluorescein on the N terminus was used as a fluorescent tracer. Then, 20 μL of the 5 carboxy-fluorescein–Bid peptide in phosphate-buffered saline was added to the solution to produce a final volume of 200 μL, followed by incubation at 37°C for 20 minutes. The solutions were transferred into 384-well black flat-bottomed plates (Corning Incorporated) with 60 μL per well and 3 wells per sample. The polarization values (millipolarization) were measured at an excitation wavelength of 485 nm and an emission wavelength if 535 nm using the Tecan Genios Pro Injector Reader, as reported.23 The 50% inhibitory concentration values were determined by nonlinear regression fitting of the competition curves (GraphPad Prism 5.0 Software).
Xenografts
These experiments were conducted in accordance with the requirements of the animal experiment ethics committee of the Shenyang Pharmaceutical University. non-obese diabetes/severe combined immune deficiency (NOD/SCID) mice (8 weeks; Beijing Weitong Lihua) were injected subcutaneously with 5 × 10⁶ log-phase U937 cells in the right flank. Mice with tumors of about 100 mm3 were randomized to 6 groups of 5 mice each and were treated with VEN (100 mg/kg, orally), DHA (100 mg/kg, intraperitoneally) + VEN (100 mg/kg, orally), A18 (100 mg/kg, intraperitoneally), A19 (100 mg/kg, intraperitoneally), and A20 (100 mg/kg, intraperitoneally) for 5 days a week over 2 weeks. DHA, VEN, A18, A19, and A20 were dissolved in 10% dimethyl sulfoxide + 40% PEG400 + 10% Tween 80 + 40% saline. Control mice received the vehicle (10% dimethyl sulfoxide + 40% PEG400 + 10% Tween 80 + 40% saline) through intraperitoneally injection using the same schedule. The tumor in each mouse was dissected at day 15 and weighed. Body weights and tumor volumes were monitored every 2 days. Another experiment was done with injection of 5 × 10⁶ MOLM-13/VEN cells following the same treatment regimen.
Statistical analysis
Data were analyzed using Prism Software 9.5 (GraphPad Software, Inc) and are expressed as mean ± standard deviation. The statistical significance (P < .05) was calculated by using a 1-way analysis of variance.
Results
A1 inhibits Bcl-2 with enhanced cell growth inhibition ability in VEN-refractory AML cells
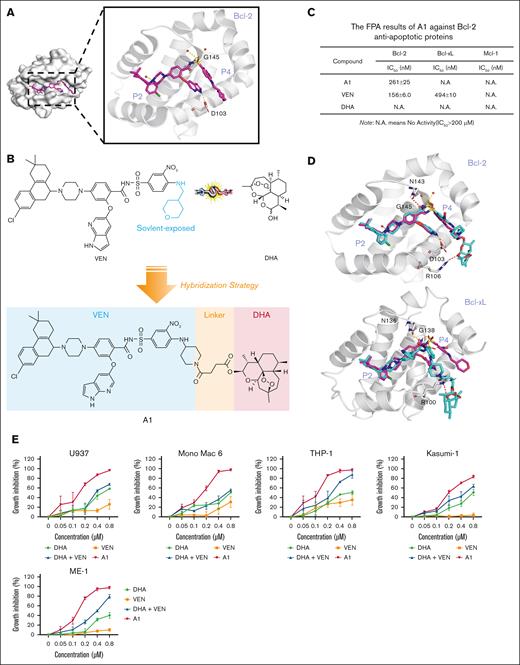
The cocrystal structure analysis of VEN docking with Bcl-2 protein (Protein Data Bank ID: 6O0K) revealed that the tetrahydropyran ring of VEN is solvent exposed,24 indicating that it is a suitable position to tether DHA through a linker (Figure 1A). We replaced the tetrahydropyran ring with a piperidine ring, followed by directly tethering DHA through a 2-carbon methylene chain to obtain A1 (Figure 1B). We assessed the ability of A1 to disrupt the interaction between the recombinant human Bcl-2/Bcl-xL/Mcl-1 protein and the labeled Bid-BH3 peptide using FPA. A1 maintained the Bcl-2 inhibition without inhibiting Bcl-xL and Mcl-1 (Figure 1C). We compared the binding interactions of VEN and A1 with Bcl-2 and Bcl-xL, respectively. The binding position of A1 to Bcl-2 was consistent with that of VEN. However, the hydrophobic DHA moiety of A1 sterically hindered the arylsulfonamide group from interacting with the well-characterized hotspots (P4 pocket) of Bcl-xL (Figure 1D), which accounts for the significant reduction in the binding assay with Bcl-xL.
A1 retains Bcl-2 inhibition ability and inhibits cell growth with apoptosis induction in VEN-refractory AML cell lines. (A) The cocrystal structure of VEN bound to Bcl-2 (Protein Data Bank [PDB] code: 6O0K). (B) The design of A1 by conjugating VEN with DHA. (C) Affinity of A1 for Bcl-2, Bcl-xL, and Mcl-1 based on FPA. (D) The predicted position of VEN (pink structure) and A1 (blue structure) bound to Bcl-2 (PDB code: 6O0K) and Bcl-xL (PDB code: 4QNQ). (E) Growth inhibition. U937, Mono Mac 6, THP-1, Kasumi-1, and ME-1 cells were treated with 0.05 to 0.8 μM of DHA, VEN, DHA + VEN, and A1 for 72 hours. Cell growth inhibition was measured by counting the cell number and comparing it with the untreated group. (F) Apoptosis induction. The cells were treated with 0.8 μM DHA, VEN, DHA + VEN, and A1 for 24 hours. The number of apoptotic cells was determined by fluorescence-activated cell sorting (FACS) after staining with annexin V/propidium iodide (PI). (G) Cell cycle distribution. The cells were treated as labeled in panel F, followed by FACS after PI staining. The values show the mean ± standard deviation (SD) of 3 independent experiments. ∗P < .05; ∗∗P < .01; ∗∗∗P < .001 when compared with the control group. Con, control; IC50, 50% inhibitory concentration; N.A., no activity (IC50>200 μM).
A1 retains Bcl-2 inhibition ability and inhibits cell growth with apoptosis induction in VEN-refractory AML cell lines. (A) The cocrystal structure of VEN bound to Bcl-2 (Protein Data Bank [PDB] code: 6O0K). (B) The design of A1 by conjugating VEN with DHA. (C) Affinity of A1 for Bcl-2, Bcl-xL, and Mcl-1 based on FPA. (D) The predicted position of VEN (pink structure) and A1 (blue structure) bound to Bcl-2 (PDB code: 6O0K) and Bcl-xL (PDB code: 4QNQ). (E) Growth inhibition. U937, Mono Mac 6, THP-1, Kasumi-1, and ME-1 cells were treated with 0.05 to 0.8 μM of DHA, VEN, DHA + VEN, and A1 for 72 hours. Cell growth inhibition was measured by counting the cell number and comparing it with the untreated group. (F) Apoptosis induction. The cells were treated with 0.8 μM DHA, VEN, DHA + VEN, and A1 for 24 hours. The number of apoptotic cells was determined by fluorescence-activated cell sorting (FACS) after staining with annexin V/propidium iodide (PI). (G) Cell cycle distribution. The cells were treated as labeled in panel F, followed by FACS after PI staining. The values show the mean ± standard deviation (SD) of 3 independent experiments. ∗P < .05; ∗∗P < .01; ∗∗∗P < .001 when compared with the control group. Con, control; IC50, 50% inhibitory concentration; N.A., no activity (IC50>200 μM).
AML cells with different phenotypes exhibit different sensitivities to VEN.25 AML cells in the M4 and M5 subtypes, as well as in monocytic types, are typically insensitive to VEN.26,27 We used a group of AML cell lines to compare the sensitivity of A1 with VEN. U937, Mono Mac 6, THP-1, Kasumi-1, and ME-1 are insensitive to VEN when compared with MOLM-13 and HL-60 cells. In the 5 VEN-insensitive cell lines, A1 demonstrated greater potency than the VEN/DHA combination (Figure 1E). However, A1 and VEN exhibited comparable efficacy in the 2 VEN-sensitive cell lines, HL-60 and MOLM-13 (supplemental Figure 1). Apoptosis detection with annexin V/propidium iodide revealed that A1 induced apoptosis in all 5 VEN-insensitive cell lines, whereas the VEN/DHA combination only induced apoptosis in the THP-1 and Mono Mac 6 cell lines and at a lower rate (Figure 1F). Fluorescence-activated cell sorting analysis with propidium iodide staining revealed that cells exposed to A1 entered the sub-G1 phase, consistent with apoptosis (Figure 1G).
A1 induced apoptosis in THP-1 cells via NOXA- and Bim-dependent pathways
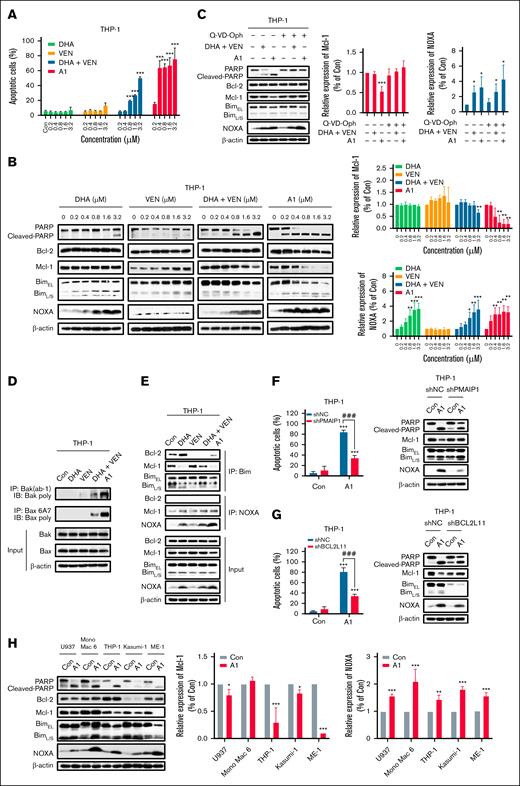
Because THP-1 represents a VEN-insensitive monocytic M5 phenotype, we selected it as a model to investigate the mechanism of A1-induced apoptosis. The apoptotic effects of A1, DHA, VEN, and the VEN/DHA combination was compared in THP-1 cells treated with 0.2 to 3.2 μM for 24 hours. Neither VEN nor DHA alone induced significant apoptosis at these concentrations. A1 is more potent than the VEN/DHA combination at inducing apoptosis (Figure 2A; supplemental Figure 2). Specifically, at a concentration of 0.8 μM, A1 induced apoptosis in 70% of the THP-1 cells, whereas the VEN/DHA combination induced apoptosis only in 20% of the THP-1 cells (Figure 2A). DHA induced NOXA at 0.8 μM to 3.2 μM with minimal PARP cleavage. A1 at 0.2 μM led to an increase in the levels of NOXA, accompanied by PARP cleavage and Mcl-1 reduction (Figure 2B). The pan-caspase inhibitor Q-VD-OPh effectively prevented PARP cleavage and Mcl-1 reduction in A1-treated THP-1 cells, whereas it did not affect NOXA induction (Figure 2C). In addition, A1 was more effective than the VEN/DHA combination in activating both Bax and Bak, as measured by the IP assay (Figure 2D).
A1 has enhanced NOXA and apoptosis induction abilities in THP-1 cells. (A) THP-1 cells were treated with DHA, VEN, DHA + VEN, and A1 for 24 hours. The apoptotic cells were quantified using FACS after staining with annexin V/PI. (B) THP-1 cells were treated with DHA, VEN, DHA + VEN, and A1 for 24 hours. The relative protein levels were determined by western blotting. The right column figures are image density analyses of 3 independent experiments. (C) THP-1 cells were pretreated with 25 μM Q-VD-OPh for 4 hours, followed by treatment with 0.8 μM DHA + VEN and A1 for 24 hours. The right column figures are the image density analyses of 3 independent experiments. (D) IP assay with anti-Bak (Ab-1) and anti-Bax 6A7 antibodies that detected the active forms, followed by probe detection for Bak and Bax in THP-1 cells treated with 0.8 μM DHA, VEN, DHA + VEN, and A1 for 24 hours. (E) IP assay of the binding of Bim and NOXA to Bcl-2 and Mcl-1 in THP-1 cells treated with 0.8 μM DHA, VEN, DHA + VEN, and A1 for 24 hours. (F) THP-1 cells were transduced with shNC or shPMAIP1, followed by treatment with 0.8 μM A1 for 24 hours. (G) THP-1 cells were transduced with shNC or shBCL2L11, followed by treatment with 0.8 μM A1 for 24 hours. The apoptotic cells were quantified using FACS after staining with annexin V–fluorescein isothiocyanate (mean ± SD of 3 independent experiments). The relative levels of the indicated proteins were determined by western blotting. (H) U937, Mono Mac 6, THP-1, Kasumi-1, and ME-1 cells were treated with 0.8 μM A1 for 24 hours. The relative levels of the indicated proteins were determined by western blotting. The right column figures are image density analyses of 3 independent experiments. ∗P < .05; ∗∗P < .01; ∗∗∗P < .001 when compared with the control group. ###P < .001, 2-group comparison. BimEL, Bim extralong; BimL, Bim long; BimS, Bim short; Con, control; shNC, short hairpin RNA negative control.
A1 has enhanced NOXA and apoptosis induction abilities in THP-1 cells. (A) THP-1 cells were treated with DHA, VEN, DHA + VEN, and A1 for 24 hours. The apoptotic cells were quantified using FACS after staining with annexin V/PI. (B) THP-1 cells were treated with DHA, VEN, DHA + VEN, and A1 for 24 hours. The relative protein levels were determined by western blotting. The right column figures are image density analyses of 3 independent experiments. (C) THP-1 cells were pretreated with 25 μM Q-VD-OPh for 4 hours, followed by treatment with 0.8 μM DHA + VEN and A1 for 24 hours. The right column figures are the image density analyses of 3 independent experiments. (D) IP assay with anti-Bak (Ab-1) and anti-Bax 6A7 antibodies that detected the active forms, followed by probe detection for Bak and Bax in THP-1 cells treated with 0.8 μM DHA, VEN, DHA + VEN, and A1 for 24 hours. (E) IP assay of the binding of Bim and NOXA to Bcl-2 and Mcl-1 in THP-1 cells treated with 0.8 μM DHA, VEN, DHA + VEN, and A1 for 24 hours. (F) THP-1 cells were transduced with shNC or shPMAIP1, followed by treatment with 0.8 μM A1 for 24 hours. (G) THP-1 cells were transduced with shNC or shBCL2L11, followed by treatment with 0.8 μM A1 for 24 hours. The apoptotic cells were quantified using FACS after staining with annexin V–fluorescein isothiocyanate (mean ± SD of 3 independent experiments). The relative levels of the indicated proteins were determined by western blotting. (H) U937, Mono Mac 6, THP-1, Kasumi-1, and ME-1 cells were treated with 0.8 μM A1 for 24 hours. The relative levels of the indicated proteins were determined by western blotting. The right column figures are image density analyses of 3 independent experiments. ∗P < .05; ∗∗P < .01; ∗∗∗P < .001 when compared with the control group. ###P < .001, 2-group comparison. BimEL, Bim extralong; BimL, Bim long; BimS, Bim short; Con, control; shNC, short hairpin RNA negative control.
The interactions between Bim and NOXA with Bcl-2 and Mcl-1 in THP-1 cells treated with A1, VEN, DHA, and VEN/DHA at 0.8 μM were measured in IP assays. Bim exists as 3 major isoforms that are generated through alternative splicing, including Bim short, Bim long, and Bim extralong. Bim extralong exhibits high affinity for Bcl-2 and Mcl-1. DHA reduced the binding of Bim to Mcl-1, whereas it enhanced its association with Bcl-2. VEN decreased Bim binding to Bcl-2 and increased its binding to Mcl-1. The VEN/DHA combination diminished Bim binding to Bcl-2, whereas binding to Mcl-1 was unaffected probably because the Bim released from Bcl-2 by VEN competed for binding with Mcl-1. A1 decreased the Bim binding to both Bcl-2 and Mcl-1. A1, DHA, and the VEN/DHA combination increased NOXA binding to Mcl-1 with A1 being the most potent trigger (Figure 2E). Previously, we found that both Bim and NOXA contributed to the apoptosis induced by the DHA/VEN combination18; similarly, silencing NOXA (PMAIP1) partially attenuated A1-induced apoptosis (Figure 2F), as did silencing Bim (BCL2L11) (Figure 2G). These data indicate that the NOXA induction by A1 plays an essential role in apoptosis induction. We observed that the PARP cleavage in the 5 VEN-insensitive cell lines treated with A1 was associated with NOXA induction (Figure 2H).
A1 overcame VEN-acquired resistance in MOLM-13/VEN cells with Mcl-1 overexpression
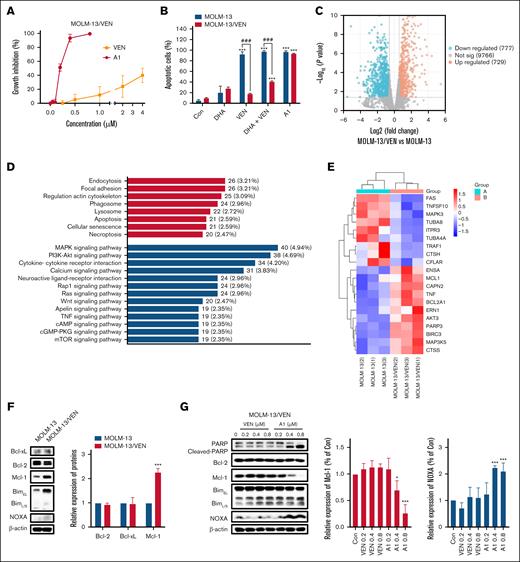
Acquired resistance commonly develops in VEN-sensitive AML cells.28 We established a VEN-resistant cell line, MOLM-13/VEN, from the sensitive MOLM-13 cells. The 50% growth inhibitory concentration (GI50) of VEN in MOLM-13 cells was 10 nM, whereas that in MOLM-13/VEN cells was more than 4 μM. Notably, the MOLM-13/VEN cell line remained sensitive to A1-induced growth inhibition (Figure 3A), and A1 retained its ability to induce apoptosis (Figure 3B). Whole-genome sequencing and RNA-seq analyses were conducted. When comparing the MOLM-13/VEN with the MOLM-13 cells, we did not identify mutations of the Mcl-1, Bcl-xL, Bcl-2, Bax, Bak, and NOXA genes. RNA-seq analysis revealed 1735 differentially expressed genes (1506 known genes) between the MOLM-13 and MOLM-13/VEN cells (Figure 3C). Kyoto Encyclopedia of Genes and Genomes (KEGG) pathway enrichment analysis of these differentially expressed genes indicated significant enrichment in the apoptosis pathway (Figure 3D). Among the 21 genes associated with the apoptosis pathway, upregulation of the anti-apoptotic genes MCL1 and BCL2A1 was observed (Figure 3E). Western blot analysis confirmed the increase in the Mcl-1 protein level (Figure 3F). The expression level of BCL2A1 could not be assessed because of unavailability of a suitable antibody. Notably, the MOLM-13/VEN cells were responsive to A1-induced apoptosis, which was associated with NOXA induction and Mcl-1 reduction (Figure 3G). These data support that the acquired resistance to VEN was caused by the upregulation of Mcl-1 and BCL2A1, and this resistance can potentially be overcome by A1.
A1 overcomes VEN-acquired resistance in MOLM-13/VEN cells. (A) Growth inhibition of VEN and A1 in MOLM-13/VEN cells treated for 72 hours. (B) MOLM-13 and MOLM-13/VEN cells were treated with 0.8 μM DHA, VEN, DHA + VEN, and A1 for 24 hours. Apoptotic cells were determined by FACS after staining with annexin V/PI (mean ± SD of 3 independent experiments). (C) Volcano plot of the differentially expressed genes in MOLM-13/VEN cells when compared with MOLM-13 cells based on RNA-seq analysis. The red and blue dots represent upregulated and downregulated genes, respectively. (D) Kyoto Encyclopedia of Genes and Genomes (KEGG) classification of differentially expressed genes in MOLM-13/VEN cells when compared with MOLM-13 cells. The ordinate shows the KEGG pathway, and the abscissa shows the number of genes under this pathway and its proportion of the total number of genes. (E) Differently expressed apoptosis-related genes between the MOLM-13/VEN cells and the MOLM-13 cells. (F) Differently expressed apoptosis-related proteins in MOLM-13 and MOLM-13/VEN cells as determined by western blot. The right column figure is an image density analysis of 3 independent experiments. (G) Protein regulation of MOLM-13/VEN cells treated with VEN and A1 at the indicated concentrations for 24 hours. The right column figures are image density analyses of 3 independent experiments. ∗P < .05; ∗∗∗P < .001 when compared with the control group. ###P < .001, 2-group comparison. BimEL, Bim extralong; BimL, Bim long; BimS, Bim short; Con, control.
A1 overcomes VEN-acquired resistance in MOLM-13/VEN cells. (A) Growth inhibition of VEN and A1 in MOLM-13/VEN cells treated for 72 hours. (B) MOLM-13 and MOLM-13/VEN cells were treated with 0.8 μM DHA, VEN, DHA + VEN, and A1 for 24 hours. Apoptotic cells were determined by FACS after staining with annexin V/PI (mean ± SD of 3 independent experiments). (C) Volcano plot of the differentially expressed genes in MOLM-13/VEN cells when compared with MOLM-13 cells based on RNA-seq analysis. The red and blue dots represent upregulated and downregulated genes, respectively. (D) Kyoto Encyclopedia of Genes and Genomes (KEGG) classification of differentially expressed genes in MOLM-13/VEN cells when compared with MOLM-13 cells. The ordinate shows the KEGG pathway, and the abscissa shows the number of genes under this pathway and its proportion of the total number of genes. (E) Differently expressed apoptosis-related genes between the MOLM-13/VEN cells and the MOLM-13 cells. (F) Differently expressed apoptosis-related proteins in MOLM-13 and MOLM-13/VEN cells as determined by western blot. The right column figure is an image density analysis of 3 independent experiments. (G) Protein regulation of MOLM-13/VEN cells treated with VEN and A1 at the indicated concentrations for 24 hours. The right column figures are image density analyses of 3 independent experiments. ∗P < .05; ∗∗∗P < .001 when compared with the control group. ###P < .001, 2-group comparison. BimEL, Bim extralong; BimL, Bim long; BimS, Bim short; Con, control.
A1 overcame Bcl-xL–mediated resistance through NOXA-mediated cyclin D1 reduction
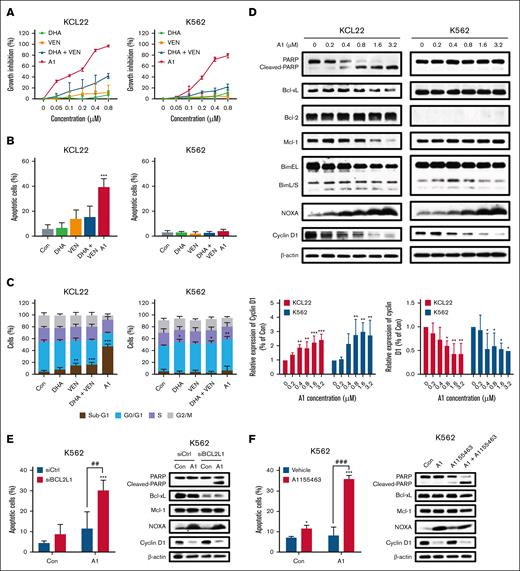
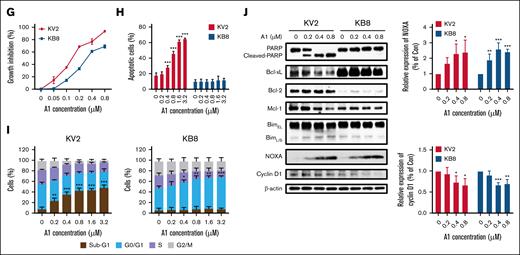
Most AML cell lines expressed lower levels of Bcl-xL and higher levels of Bcl-2 (supplemental Figure 3). The expression of Bcl-xL in erythroid/megakaryocytic AML cells contributes to VEN resistance.29 Most chronic myeloid leukemia cell lines established from the blast crisis of chronic myeloid leukemia display high levels of Bcl-xL with either low or undetectable levels of Bcl-2. We used K562 and KCL22 to test if A1 could overcome VEN resistance that is mediated by Bcl-xL. K562 cells express high levels of Bcl-xL without Bcl-2, and KCL22 cells express Bcl-2 with relative lower levels of Bcl-xL (supplemental Figure 3). Both cell lines are responsive to A1-mediated growth inhibition, but do not exhibit sensitivity to the VEN/DHA combination (Figure 4A). KCL22 cells, but not K562 cells, are responsive to A1-induced apoptosis at 0.8 μM (Figure 4B). Higher concentrations of the VEN/DHA combination (3.2 μM) induced only minimal apoptosis in KCL22 cells but not in K562 cells (supplemental Figure 4). At a concentration of 0.8 μM, A1 induced sub-G1 phase arrest in KCL22 cells and G0/G1 phase arrest in K562 cells (Figure 4C). Western blot analysis revealed that A1 increased NOXA and decreased Mcl-1 in KCL22 cells, whereas it decreases cyclin D1 in both KCL22 and K562 cells (Figure 4D). The cyclin D1 reduction was associated with NOXA induction in both cell lines. In KCL22 cells, the Mcl-1 reduction was associated with PARP cleavage following caspase activation. K562 cells exhibited higher levels of Bcl-xL than KCL22 cells. Silencing Bcl-xL with siRNA or inhibiting it with the specific inhibitor A1155463 sensitized K562 cells to A1-induced apoptosis (Figure 4E-F). To further investigate the role of Bcl-xL in A1-mediated apoptosis and growth inhibition, we used KCL22 subclones KB8 and KV2 that were transfected with Bcl-xL and an empty vector, respectively. KB8 cells exhibited only a slight reduction in growth inhibition in response to A1 treatment when compared with the KV2 cells (Figure 4G), but apoptosis was effectively blocked in KB8 cells (Figure 4H). A1 induced sub-G1 phase arrest in KV2 cells and G0/G1 phase arrest in KB8 cells (Figure 4I). The western blot analysis revealed that A1 induced NOXA and decreased cyclin D1 in both KV2 and KV8 cell lines (Figure 4J). We also noticed overexpression of Bcl-xL in KV8 cells with repressed Bcl-2 through an unknown mechanism. These data suggest that A1-induced growth inhibition and apoptosis can be decoupled. The overexpression of Bcl-xL switched A1 from an apoptosis inducer to a cell cycle inhibitor.
A1 induces G0/G1 phase arrest with NOXA induction-mediated cyclin D1 reduction in Bcl-xL expressing cells. (A) Growth inhibition by DHA, VEN, DHA + VEN, and A1 in KCL22 and K562 cells treated for 72 hours. (B) Apoptosis induction in KCL22 and K562 cells treated with 0.8 μM DHA, VEN, DHA + VEN, and A1 for 24 hours. Apoptotic cells were quantified using FACS after staining with annexin V/PI. (C) Cell cycle distribution of KCL22 and K562 cells treated with 0.8 μM DHA, VEN, DHA + VEN, and A1 for 24 hours and assessed by FACS after PI staining. (D) Protein regulation of KCL22 and K562 cells treated with A1 at the indicated concentrations for 24 hours. The downward column figures are image density analyses of 3 independent experiments. (E) K562 cells transfected with Bcl-xL (BCL2L1)-small interfering RNA (siRNA) for 24 hours, followed by treatment with 0.8 μM A1 for 24 hours. (F) K562 cells treated with 0.8 μM A1, 0.8 μM A1155463 alone, and their combination for 24 hours. Apoptotic cells were quantified using FACS after staining with annexin V/PI. The relative protein levels were determined by western blotting. (G) Growth inhibition of KV2 (transfected with an empty vector) and KB8 (transfected with Bcl-xL expressing vector) cells treated with A1 for 72 hours. (H) Apoptosis induction of KV2 and KB8 cells treated with A1 at the indicated concentrations for 24 hours. Apoptotic cells were quantified using FACS after staining with annexin V/PI. (I) Cell cycle distribution of KV2 and KB8 cells treated with A1 for 24 hours and assessed by FACS after PI staining. (J) The relative protein levels of KV2 and KB8 cells treated with A1 for 24 hours. The right column figures are image density analyses of 3 independent experiments. ∗P < .05; ∗∗P < .01; ∗∗∗P < .001 when compared with the control group. ##P < .01; ###P < .001 2-group analysis. BimEL, Bim extralong; BimL, Bim long; BimS, Bim short; Con, control; siCtrl, small interfering RNA control.
A1 induces G0/G1 phase arrest with NOXA induction-mediated cyclin D1 reduction in Bcl-xL expressing cells. (A) Growth inhibition by DHA, VEN, DHA + VEN, and A1 in KCL22 and K562 cells treated for 72 hours. (B) Apoptosis induction in KCL22 and K562 cells treated with 0.8 μM DHA, VEN, DHA + VEN, and A1 for 24 hours. Apoptotic cells were quantified using FACS after staining with annexin V/PI. (C) Cell cycle distribution of KCL22 and K562 cells treated with 0.8 μM DHA, VEN, DHA + VEN, and A1 for 24 hours and assessed by FACS after PI staining. (D) Protein regulation of KCL22 and K562 cells treated with A1 at the indicated concentrations for 24 hours. The downward column figures are image density analyses of 3 independent experiments. (E) K562 cells transfected with Bcl-xL (BCL2L1)-small interfering RNA (siRNA) for 24 hours, followed by treatment with 0.8 μM A1 for 24 hours. (F) K562 cells treated with 0.8 μM A1, 0.8 μM A1155463 alone, and their combination for 24 hours. Apoptotic cells were quantified using FACS after staining with annexin V/PI. The relative protein levels were determined by western blotting. (G) Growth inhibition of KV2 (transfected with an empty vector) and KB8 (transfected with Bcl-xL expressing vector) cells treated with A1 for 72 hours. (H) Apoptosis induction of KV2 and KB8 cells treated with A1 at the indicated concentrations for 24 hours. Apoptotic cells were quantified using FACS after staining with annexin V/PI. (I) Cell cycle distribution of KV2 and KB8 cells treated with A1 for 24 hours and assessed by FACS after PI staining. (J) The relative protein levels of KV2 and KB8 cells treated with A1 for 24 hours. The right column figures are image density analyses of 3 independent experiments. ∗P < .05; ∗∗P < .01; ∗∗∗P < .001 when compared with the control group. ##P < .01; ###P < .001 2-group analysis. BimEL, Bim extralong; BimL, Bim long; BimS, Bim short; Con, control; siCtrl, small interfering RNA control.
The endoperoxide bridge of A1 is essential for NOXA production and cyclin D1 reduction
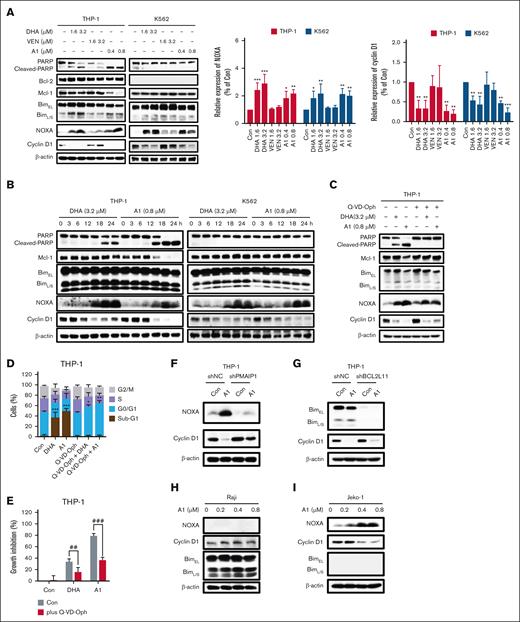
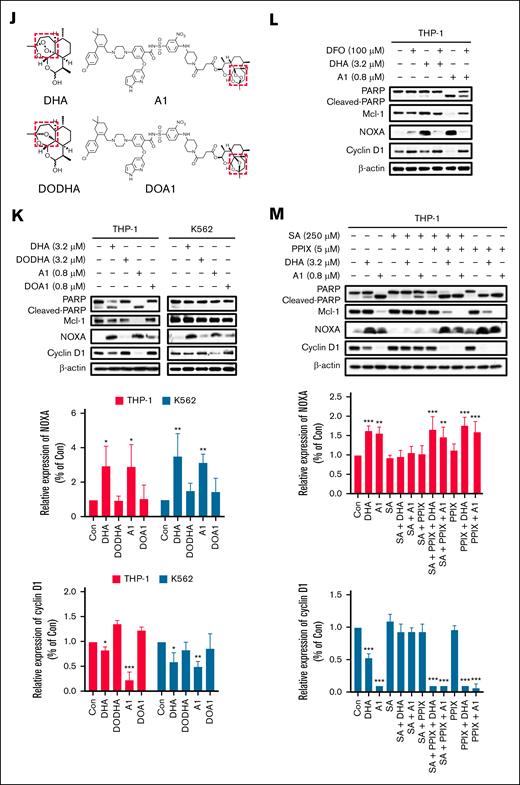
We observed that cyclin D1 reduction was associated with NOXA induction in A1-treated K562 and KCL22 cells. We further validated this relationship in THP-1 and K562 cells treated with low concentrations of A1 and high concentrations of DHA and VEN for 24 hours. Both A1 and DHA were found to induce NOXA and decrease cyclin D1, whereas VEN did not (Figure 5A). Notably, a fourfold higher concentration of DHA was required to achieve similar levels of NOXA induction and cyclin D1 reduction as A1. To further elucidate the relationship between NOXA and cyclin D1, THP-1 and K562 cells were exposed to 3.2 μM DHA and 0.8 μM A1 for different time points. In both cell lines, the increase in NOXA correlated with the decrease in cyclin D1 after A1 and DHA treatment (Figure 5B). We also noticed that cyclin D1 reduction coincided with PARP cleavage in THP-1 cells. However, the caspase inhibitor Q-VD-OPh effectively inhibited A1 and DHA-induced PARP cleavage, but it did not affect cyclin D1 reduction or NOXA induction (Figure 5C). Q-VD-OPh inhibited sub-G1 phase cell accumulation while increasing the G0/G1 phase cell population (Figure 5D). Therefore, the growth inhibition of A1 was only partially mitigated by Q-VD-OPh treatment (Figure 5E). Silencing NOXA (PMAIP1) in THP-1 cells attenuated the cyclin D1 reduction seen with A1 treatment (Figure 5F), but silencing Bim (BCL2L11) did not (Figure 5G). Notably, there was no reduction in cyclin D1 in NOXA-deficient Raji cells following treatment with 0.8 μM of A1 (Figure 5H), whereas it was observed in Bim-deficient Jeko-1 cells (Figure 5I). These data suggest that A1-induced NOXA contributes to cyclin D1 reduction independent of apoptosis. The unique endoperoxide bridge (R-O-O-R’) of DHA was proposed to be the functional group responsible for its antimalarial activity.30 The DODHA and DOA1 were synthesized with a single oxygen atom (Figure 5J). Unlike DHA and A1, DODHA at 3.2 μM and DOA1 at 0.8 μM neither inhibited proliferation nor induced apoptosis in THP-1 and K562 cells (supplemental Figure 5). DODHA and DOA1 lost the ability to induce NOXA and to reduce cyclin D1 (Figure 5K). The endoperoxide bridge of DHA is supposed to be activated by heme iron. Pretreatment with the iron chelator DFO suppressed A1-induced PARP cleavage and NOXA upregulation and prevented the cyclin D1 reduction in THP-1 cells (Figure 5L). The protoporphyrin IX (the intermediate of heme synthesis in cells) increased, whereas succinylacetone (the inhibitor of heme synthesis) inhibited PARP cleavage, NOXA induction, and cyclin D1 reduction in A1 treated THP-1 cells (Figure 5M). These data indicate that the endoperoxide bridge of DHA plays a crucial role in the induction of NOXA and the decrease in cyclin D1 associated with A1 treatment.
A1 reduces the cyclin D1 protein through the endoperoxide of DHA-mediated NOXA production. (A) THP-1 and K562 cells were treated with 1.6 to 3.2 μM DHA or VEN and 0.4 to 0.8 μM A1 for 24 hours. The protein levels were determined by western blotting. The right column figures are image density analyses of 3 independent experiments. (B) THP-1 and K562 cells were treated with 3.2 μM DHA and 0.8 μM A1 for the indicated times. The protein levels were detected by western blot analysis. (C) THP-1 cells were pretreated with 25 μM Q-VD-OPh for 4 hours, followed by 3.2 μM DHA and 0.8 μM A1 treatment for 24 hours. The cyclin D1 and NOXA levels were detected using western blot analysis. (D) The DNA distribution was assessed by flow cytometry after PI staining. (E) Cell growth inhibition of THP-1 cells pretreated with Q-VD-OPh, followed by A1 and DHA for 24 hours. (F) THP-1 cells were transduced with shNC or shPMAIP1 and then treated with 0.8 μM A1 for 24 hours. (G) THP-1 cells were transduced with shNC or shBCL2L11, then treated with 0.8 μM A1 for 24 hours. (H) Raji cells that were defective in NOXA were treated with 0.2 to 0.8 μM A1 for 24 hours. (I) Jeko-1 cells that were defective in Bim were treated with 0.2 to 0.8 μM A1 for 24 hours. The relative levels of the NOXA and cyclin D1 were determined by western blotting. (J) The chemical structures of DODHA and DOA1 with the reduced endoperoxide moiety of DHA and A1. (K) The protein levels of cyclin D1 and NOXA in the THP-1 and K562 cells that were treated with DHA, A1, DODHA, and DOA1 for 24 hours. The right column figures are image density analyses of 3 independent experiments. (L) The iron chelator DFO blocks A1-induced NOXA. THP-1 cells were pretreated with 100 μM DFO for 4 hours and then treated with 3.2 μM DHA and 0.8 μM A1 for 24 hours. (M) The heme synthetic precursor and inhibitor regulate A1-induced NOXA. THP-1 cells were pretreated with 250 μM SA, 5 μM PPIX, or 250 μM SA + 5 μM PPIX for 24 hours, followed by 3.2 μM DHA and 0.8 μM A1 treatment for 24 hours. The right column figures are image density analyses of 3 independent experiments. ∗P < .05; ∗∗P < .01; ∗∗∗P < .001 when compared with the control group. ##P < .01; ###P < .001 2-group analysis. BimEL, Bim extralong; BimL, Bim long; BimS, Bim short; Con, control; PPIX, protoporphyrin IX; SA, succinylacetone.
A1 reduces the cyclin D1 protein through the endoperoxide of DHA-mediated NOXA production. (A) THP-1 and K562 cells were treated with 1.6 to 3.2 μM DHA or VEN and 0.4 to 0.8 μM A1 for 24 hours. The protein levels were determined by western blotting. The right column figures are image density analyses of 3 independent experiments. (B) THP-1 and K562 cells were treated with 3.2 μM DHA and 0.8 μM A1 for the indicated times. The protein levels were detected by western blot analysis. (C) THP-1 cells were pretreated with 25 μM Q-VD-OPh for 4 hours, followed by 3.2 μM DHA and 0.8 μM A1 treatment for 24 hours. The cyclin D1 and NOXA levels were detected using western blot analysis. (D) The DNA distribution was assessed by flow cytometry after PI staining. (E) Cell growth inhibition of THP-1 cells pretreated with Q-VD-OPh, followed by A1 and DHA for 24 hours. (F) THP-1 cells were transduced with shNC or shPMAIP1 and then treated with 0.8 μM A1 for 24 hours. (G) THP-1 cells were transduced with shNC or shBCL2L11, then treated with 0.8 μM A1 for 24 hours. (H) Raji cells that were defective in NOXA were treated with 0.2 to 0.8 μM A1 for 24 hours. (I) Jeko-1 cells that were defective in Bim were treated with 0.2 to 0.8 μM A1 for 24 hours. The relative levels of the NOXA and cyclin D1 were determined by western blotting. (J) The chemical structures of DODHA and DOA1 with the reduced endoperoxide moiety of DHA and A1. (K) The protein levels of cyclin D1 and NOXA in the THP-1 and K562 cells that were treated with DHA, A1, DODHA, and DOA1 for 24 hours. The right column figures are image density analyses of 3 independent experiments. (L) The iron chelator DFO blocks A1-induced NOXA. THP-1 cells were pretreated with 100 μM DFO for 4 hours and then treated with 3.2 μM DHA and 0.8 μM A1 for 24 hours. (M) The heme synthetic precursor and inhibitor regulate A1-induced NOXA. THP-1 cells were pretreated with 250 μM SA, 5 μM PPIX, or 250 μM SA + 5 μM PPIX for 24 hours, followed by 3.2 μM DHA and 0.8 μM A1 treatment for 24 hours. The right column figures are image density analyses of 3 independent experiments. ∗P < .05; ∗∗P < .01; ∗∗∗P < .001 when compared with the control group. ##P < .01; ###P < .001 2-group analysis. BimEL, Bim extralong; BimL, Bim long; BimS, Bim short; Con, control; PPIX, protoporphyrin IX; SA, succinylacetone.
VEN and DHA conjugates with a PEG-linker exhibited improved antitumor potency in vivo
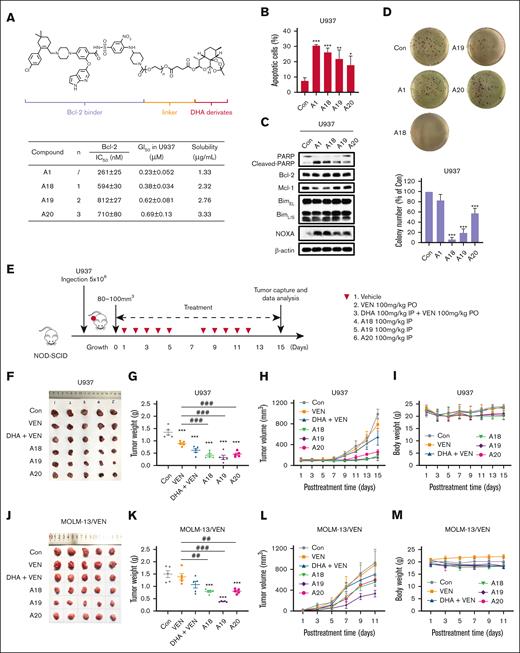
A1 exhibits suboptimal bioavailability and poses challenges in the formulation for in vivo administration. To address this limitation, we optimized A1 by referring the in vivo active conjugate RapaLink-1 through incorporation of the PEG linkers.31 We linked VEN and DHA using various PEG units and generated conjugates A18 to A20. These conjugates retained the ability to inhibit Bcl-2, as confirmed by the FPA, and exhibited improved solubility (Figure 6A). To compare their growth inhibition in vitro and in vivo, we used U937 cells, a cell line with a similar phenotype as THP-1 with improved ability to function in xenografts. A18 and A19 demonstrated comparable growth inhibition, apoptosis induction, and NOXA production in U937 cells under suspension culture conditions with A1 (Figure 6A-C), however, they showed superior activity in inhibiting colony formation of U937 in soft agar culture conditions (Figure 6D). SCID/NOD mice inoculated with U937 cells were treated with VEN, VEN/DHA, A18, A19, and A20 for 5 days per week for 2 weeks (Figure 6E). At the conclusion of the experiment, A18, A19, and A20 induced significant inhibition of tumor growth, as evidenced by reduced tumor growth rates and final tumor weights (Figure 6F-H). The tumor growth inhibition rates of A18, A19, and A20 were 69.3%, 75.6%, and 65.8%, respectively, which were higher than that of VEN (33.9%). Treatment with these compounds did not lead to a significant reduction in body weight throughout the study (Figure 6I). In a second experiment, we used the same approach to test their antitumor effects in VEN-resistant MOLM-13/VEN cells with overexpressed Mcl-1. The MOLM-13/VEN cells were inoculated into SCID/NOD mice and treated with each compound at the doses described for 10 days. A19 exhibited the best antitumor effects based on the tumor images, tumor weights, and tumor growth curves (Figure 6J-L).
The conjugates with the PEG-linker exhibited improved inhibition on colony formation and antitumor efficacy in vivo. (A) Bcl-2 inhibition and cell growth inhibition in U937 cells following treatment with A18 to A20 with an extended PEG-linker. (B) Apoptosis induction in U937 cells treated with 0.8 μM of each compound for 24 hours. (C) The relative protein levels of U937 cells treated with each compound for 24 hours. (D) Colony forming inhibition of U937 cells treated with each compound for 14 days. (E) The scheme of treatment of U937 xenografts cells. (F) Tumors of U937 xenografts dissected at the end of experiment. (G) Tumor weights and mean values of U937 xenografts (n = 5). ∗∗∗P < .001 when compared with the control group. ###P < .001, 2-group analysis. (H) Tumor growth rates of U937 xenografts during the treatment. (I) Body weights of mice that received U937 xenografts during the treatment. (J) Tumors that developed from MOLM-13/VEN xenografts after dissection at the end of the experiment. (K) Tumor weights and mean values of MOLM-13/VEN xenografts cells (n = 5). ∗∗∗P < .001 when compared with the control group. ##P < .01; ###P < .001, 2-group analysis. (L) Tumor growth rates of MOLM-13/VEN xenografts during the treatment. (M) Body weights of mice that received MOLM-13/VEN xenografts during the treatment. Con, control; IC50, 50% inhibitory concentration; PO, by mouth; IP, intraperitoneally.
The conjugates with the PEG-linker exhibited improved inhibition on colony formation and antitumor efficacy in vivo. (A) Bcl-2 inhibition and cell growth inhibition in U937 cells following treatment with A18 to A20 with an extended PEG-linker. (B) Apoptosis induction in U937 cells treated with 0.8 μM of each compound for 24 hours. (C) The relative protein levels of U937 cells treated with each compound for 24 hours. (D) Colony forming inhibition of U937 cells treated with each compound for 14 days. (E) The scheme of treatment of U937 xenografts cells. (F) Tumors of U937 xenografts dissected at the end of experiment. (G) Tumor weights and mean values of U937 xenografts (n = 5). ∗∗∗P < .001 when compared with the control group. ###P < .001, 2-group analysis. (H) Tumor growth rates of U937 xenografts during the treatment. (I) Body weights of mice that received U937 xenografts during the treatment. (J) Tumors that developed from MOLM-13/VEN xenografts after dissection at the end of the experiment. (K) Tumor weights and mean values of MOLM-13/VEN xenografts cells (n = 5). ∗∗∗P < .001 when compared with the control group. ##P < .01; ###P < .001, 2-group analysis. (L) Tumor growth rates of MOLM-13/VEN xenografts during the treatment. (M) Body weights of mice that received MOLM-13/VEN xenografts during the treatment. Con, control; IC50, 50% inhibitory concentration; PO, by mouth; IP, intraperitoneally.
Discussion
Bcl-2, Bcl-xL, and Mcl-1 are key proteins that confer protection against apoptosis in different types of AML cells.32 VEN, the only US Food and Drug Administration–approved Bcl-2 inhibitor for leukemia therapy, demonstrates only modest efficacy.33 Our data support that the endogenous or induced expressions of Mcl-1 and Bcl-xL are primary contributors to VEN resistance. The reason might be that the effector, Bim, released by VEN from Bcl-2 is trapped by the high expression of Mcl-1 and/or Bcl-xL.34 NOXA, which competes with Bim, binds to Mcl-1 and leads to Mcl-1 protein degradation.35 Neutrophils express Mcl-1 but lack Bcl-2 expression36 and trigger apoptosis under stress conditions via NOXA-mediated Mcl-1 degradation.37 Therefore, the combination of Bcl-2 inhibition and a NOXA inducer represents a promising and safe strategy to overcome Mcl-1–mediated resistance. The compound A1 has dual functions of inhibiting Bcl-2 and producing NOXA. The VEN-refractory and -resistant AML cells with high levels of Mcl-1 respond to A1-induced apoptosis. Cells that overexpress Bcl-xL demonstrate resistance to VEN.29 We found that cells with overexpression of Bcl-xL are susceptible to A1-mediated growth inhibition. We also noticed a reverse relationship between Bcl-2 and Bcl-xL. The differential apoptotic responses between Mcl-1– and Bcl-xL–overexpressing cells may arise from the different Bcl-2 expression levels and NOXA’s selective binding to Mcl-1. We found a new function of A1 in that it inhibits cell growth through NOXA-mediated cyclin D1 reduction. Silencing NOXA or using cells with a NOXA deletion abolished the A1-mediated cyclin D1 reduction. The cross-regulation between NOXA and cyclin D1 remains unclear. Although cyclin D1 has been reported to transcriptionally activate NOXA in mantle cell lymphoma,38 reciprocal regulation in which NOXA destabilizes cyclin D1 protein represents a novel finding. We also found a NOXA/cyclin D1 axis in apoptosis-responsive THP-1 cells that was independent of apoptosis induction. Our data support that upregulated NOXA by A1 has 2 functions, namely Mcl-1 degradation–mediated apoptosis and cyclin D1 degradation–mediated cell growth inhibition.
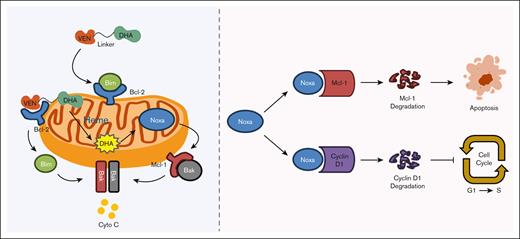
NOXA production plays an essential role in A1-mediated apoptosis and growth inhibition, strictly dependent on the epoxide bridge within the DHA part. DOA1 and DODHA, the analogues of A1 and DHA with a reduction in the epoxide bridge to 1 oxygen, lost the ability to induce NOXA production, apoptosis induction, and cell growth inhibition. In addition, we have determined that NOXA production requires iron and heme. The iron chelator DFO and the heme synthesis inhibitor succinylacetone block A1-induced NOXA and apoptosis. A1 exhibits a greater capacity for NOXA production than DHA in leukemia cells. Heme is synthesized in mitochondria, and Bcl-2 is anchored on mitochondria. A1 can concentrate on the mitochondria by binding to Bcl-2, thereby enhancing the interaction between DHA and heme to produce more NOXA. It has been reported that artesunate could be activated by heme in an aqueous medium.39 We found that adding heme directly to the medium completely blocked A1-mediated NOXA production and cell growth inhibition. The efficacy of A1 to inhibit cell growth seems to be dependent on the intracellular heme levels. Myeloid leukemia cells contain higher levels of heme than normal cells,30,40 thereby enabling A1 to selectively target these cells. Recently, there was a report showed that the decreased level of heme in mitochondria enhances VEN apoptosis induction.41 We propose that VEN drags DHA to mitochondria where it interacts with heme, thereby enhancing NOXA production. This subsequently enhances VEN-induced apoptosis by degrading Mcl-1 and inhibits cell proliferation by degrading cyclin D1 (Figure 7). A1, as a large molecule formed by conjugating VEN and DHA via a 2-carbon methylene chain, demonstrates limited bioavailability and solubility. We optimized A1 by using a PEG liker, as was done for the in vivo active conjugate RapaLink-1,31 which led to the development of A18, A19 and A20. These modified conjugates have better growth inhibition ability in colony formation assays and in vivo antitumor activities and are worthy of further studies as new generation VEN to overcome the resistance.
A schema illustrating how A1 overcomes VEN resistance through enhanced NOXA production and Mcl-1/cyclin D1 protein degradation.
A schema illustrating how A1 overcomes VEN resistance through enhanced NOXA production and Mcl-1/cyclin D1 protein degradation.
Acknowledgments
This work was supported by the National Natural Science Foundation of China (numbers 82304559 and 8217131586) and the Samuel Waxman Cancer Research Foundation.
Authorship
Contribution: J.Z., S.W., L.Z., and Y.J. conceptualized the study; J.Z., Z.Z., J.L., S.L., J.Q., Z.W., Y.K., P.G., Y.B., and Y.W. developed the methodology; J.Z., S.W., and Y.J. conducted the formal analysis; J.Z. and Z.Z. conducted the investigation; J.Z., Z.Z., S.W., and Y.J. provided resources; J.Z., Z.Z., and Y.J. wrote the original draft; J.Z., Z.Z., S.W., and Y.J. edited and reviewed the manuscript; L.Z. and Y.J. provided supervision; and J.Z., L.Z., and Y.J. were responsible for funding acquisition.
Conflict-of-interest disclosure: The authors declare no competing financial interests.
Correspondence: Yongkui Jing, Department of Pharmacology, Shenyang Pharmaceutical University, Shenyang 110016, China; email: Jingyk@syphu.edu.cn; and Linxiang Zhao, Department of Medicinal Chemistry, Shenyang Pharmaceutical University, Shenyang 110016, China; email: linxiang.zhao@vip.sina.com.
References
Author notes
The Sequence Read Archive (SRA) data are available under the identifier PRJNA1295157 (available at https://www.ncbi.nlm.nih.gov/sra/PRJNA1295157 temporary submission ID: SUB15480885; release date: 1 October 2025). SRA records will be publicly accessible after the indicated release date.
The data that support the findings of this study are available upon reasonable request from the corresponding authors, Yongkui Jing (Jingyk@syphu.edu.cn) and Linxiang Zhao (linxiang.zhao@vip.sina.com).
The full-text version of this article contains a data supplement.

![A1 retains Bcl-2 inhibition ability and inhibits cell growth with apoptosis induction in VEN-refractory AML cell lines. (A) The cocrystal structure of VEN bound to Bcl-2 (Protein Data Bank [PDB] code: 6O0K). (B) The design of A1 by conjugating VEN with DHA. (C) Affinity of A1 for Bcl-2, Bcl-xL, and Mcl-1 based on FPA. (D) The predicted position of VEN (pink structure) and A1 (blue structure) bound to Bcl-2 (PDB code: 6O0K) and Bcl-xL (PDB code: 4QNQ). (E) Growth inhibition. U937, Mono Mac 6, THP-1, Kasumi-1, and ME-1 cells were treated with 0.05 to 0.8 μM of DHA, VEN, DHA + VEN, and A1 for 72 hours. Cell growth inhibition was measured by counting the cell number and comparing it with the untreated group. (F) Apoptosis induction. The cells were treated with 0.8 μM DHA, VEN, DHA + VEN, and A1 for 24 hours. The number of apoptotic cells was determined by fluorescence-activated cell sorting (FACS) after staining with annexin V/propidium iodide (PI). (G) Cell cycle distribution. The cells were treated as labeled in panel F, followed by FACS after PI staining. The values show the mean ± standard deviation (SD) of 3 independent experiments. ∗P < .05; ∗∗P < .01; ∗∗∗P < .001 when compared with the control group. Con, control; IC50, 50% inhibitory concentration; N.A., no activity (IC50>200 μM).](https://ash.silverchair-cdn.com/ash/content_public/journal/bloodadvances/9/21/10.1182_bloodadvances.2025015806/1/m_blooda_adv-2025-015806-gr1fg.jpeg?Expires=1765094668&Signature=z0Cw1Sw2P6uLDWioj-iLwmWOBzCGBSK5NhFU3rreRT4xC4LARQPv36iDe7Nk3EiuHHUc0YK9GHKjSjMkIVmYvYuPxUrZLQVcfJ9OSLDYub3Pk4nuvSO3w2Wue-CC0J~SEe3MZci6PzAmFxhYARxR4DP7eS2fF~RQqwa01mapuF70~KaNSqyKKxnb~ITRo5SVFP0l9cm1AJnFWv99tjsIXTeC3EZkd17Elgnqy-qgMSELA1pm6KrqL-s1J~Pg~-ztC8LB9pQ3-zBviNU2dEFeoO5l9xwZ7Icyno2wR42YfoKzguEX8GD6wUUKEgdFVmkOfnYA6OVvJmk1F6wnmapvaw__&Key-Pair-Id=APKAIE5G5CRDK6RD3PGA)
