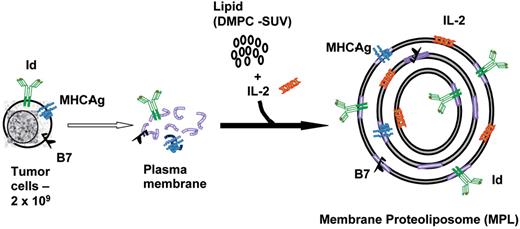
Schema for manufacture of membrane proteoliposomal vaccine. Following an excisional biopsy of at least a 2 cm lymph node, the tumor sample is processed into a single cell suspension and proteins from whole cell membranes are directly extracted from 2 × 10⁹ lymph node biopsy cells with detergent. The membrane proteins are incorporated into liposomes along with interleukin (IL)-2 to produce membrane-patched proteoliposome vaccine. The liposomes are initially in the form of small unilamellar vesicles (SUV) when synthesized from dimyristoylphosphatidylcholine (DMPC). These SUVs coalesce following incubation with IL-2 to form large multilamellar vesicles with the incorporation of IL-2 and various membrane proteins within the lipid bilayers.
Abbreviations: Id, idiotype; MHC Ag, major histocompatibility antigen complex; B7, T-cell costimulatory molecule.
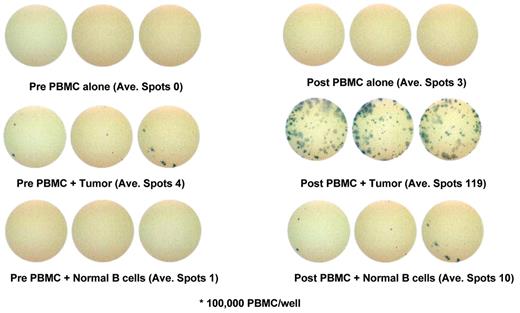
Tumor-specific cellular immune response induced following membrane proteoliposome vaccination in a representative patient with follicular lymphoma. Cryopreserved prevaccine and postvaccine peripheral blood mononuclear cells were cultured in either medium alone, or with soluble CD40 ligand–activated autologous tumor cells or soluble CD40 ligand–activated autologous normal B cells and cytokine production was detected by IFN-γ enzyme-linked immunopsot (ELISPOT) assay. Representative wells of ELISPOT demonstrating IFN-γ spots are shown. Significantly increased number of IFN-γ spots were detected in response to autologous tumor cells but not in response to autologous normal B cells by the postvaccine T cells.
Tumor-specific cellular immune response induced following membrane proteoliposome vaccination in a representative patient with follicular lymphoma. Cryopreserved prevaccine and postvaccine peripheral blood mononuclear cells were cultured in either medium alone, or with soluble CD40 ligand–activated autologous tumor cells or soluble CD40 ligand–activated autologous normal B cells and cytokine production was detected by IFN-γ enzyme-linked immunopsot (ELISPOT) assay. Representative wells of ELISPOT demonstrating IFN-γ spots are shown. Significantly increased number of IFN-γ spots were detected in response to autologous tumor cells but not in response to autologous normal B cells by the postvaccine T cells.
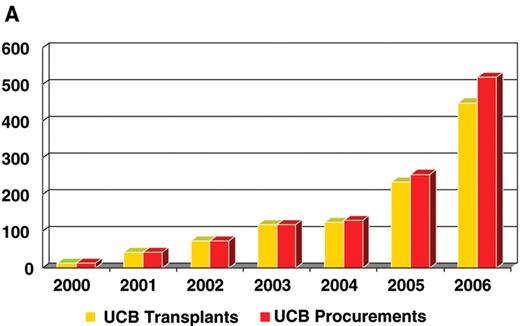
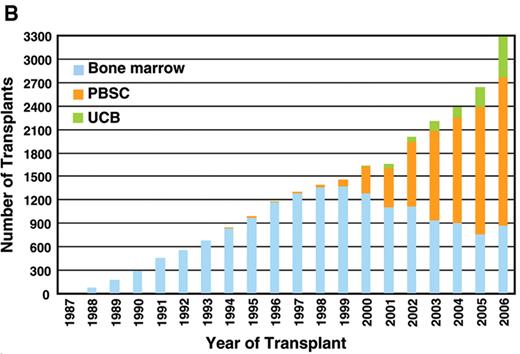
Umbilical cord blood (UCB) unit procurements and UCB transplants facilitated by the National Marrow Donor Program (NMDP) by year (1A); NMDP facilitated transplants by year according to hematopoietic stem cell (HSC) source (1B). (Slides courtesy of Dr Dennis Confer, NMDP).
Umbilical cord blood (UCB) unit procurements and UCB transplants facilitated by the National Marrow Donor Program (NMDP) by year (1A); NMDP facilitated transplants by year according to hematopoietic stem cell (HSC) source (1B). (Slides courtesy of Dr Dennis Confer, NMDP).
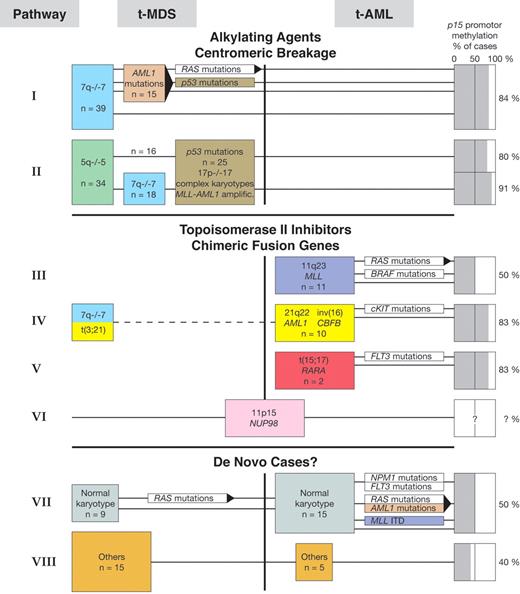
Alternative genetic pathways in therapy-related myelodysplasia (t-MDS) and therapy-related acute myeloid leukemia (t-AML).
indicates association with transformation from MDS to AML
From
Alternative genetic pathways in therapy-related myelodysplasia (t-MDS) and therapy-related acute myeloid leukemia (t-AML).
indicates association with transformation from MDS to AML
From
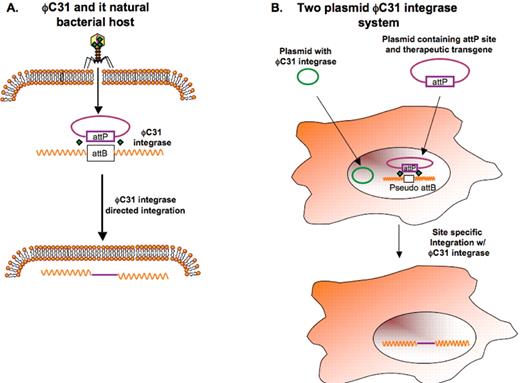
(A) The phage ϕC31 uses an integrase-driven system to insert its genetic content into a host bacterium. The system requires ϕC31 integrase and a pair of complementary sequences in the phage (attP) and the bacterial host genome (attB). (B) Two plasmids, one containing ϕC31 integrase, the other containing the attP site and the therapeutic transgene, are used to co-transfect mammalian cells. The ϕC31 integrase effects transgene insertion into the mammalian genome at pseudo-attB sites, recognized by the attP site in the therapeutic gene plasmid.
(A) The phage ϕC31 uses an integrase-driven system to insert its genetic content into a host bacterium. The system requires ϕC31 integrase and a pair of complementary sequences in the phage (attP) and the bacterial host genome (attB). (B) Two plasmids, one containing ϕC31 integrase, the other containing the attP site and the therapeutic transgene, are used to co-transfect mammalian cells. The ϕC31 integrase effects transgene insertion into the mammalian genome at pseudo-attB sites, recognized by the attP site in the therapeutic gene plasmid.
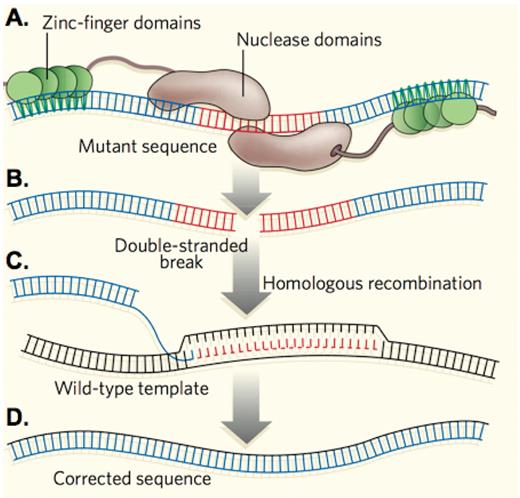
Genome editing by zinc finger nucleases. (A) A zinc finger nuclease consisting of DNA recognition domains and an endonuclease are designed to recognize a specific site near a mutation. (B) The nuclease domains introduce a double-strand break into the DNA. (C) A wild-type sequence in introduced into the cells and used as the template for a cellular repair process, homologous recombination. (D) The mutant sequence is corrected. Adapted from
Genome editing by zinc finger nucleases. (A) A zinc finger nuclease consisting of DNA recognition domains and an endonuclease are designed to recognize a specific site near a mutation. (B) The nuclease domains introduce a double-strand break into the DNA. (C) A wild-type sequence in introduced into the cells and used as the template for a cellular repair process, homologous recombination. (D) The mutant sequence is corrected. Adapted from
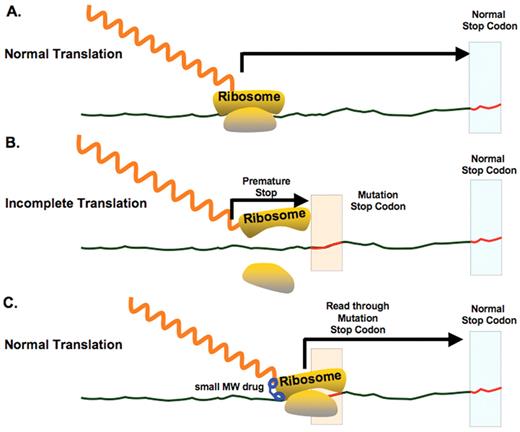
Translational bypass therapy using a small-molecule drug. (A) In normal translation, the ribosome translates mRNA to produce the polypeptide chain. (B) A nonsense mutation introduces a premature stop codon, resulting in synthesis of a truncated (non-functional) protein. (C) A small molecule drug permits readthrough of the premature stop codon, restoring normal translation.
Translational bypass therapy using a small-molecule drug. (A) In normal translation, the ribosome translates mRNA to produce the polypeptide chain. (B) A nonsense mutation introduces a premature stop codon, resulting in synthesis of a truncated (non-functional) protein. (C) A small molecule drug permits readthrough of the premature stop codon, restoring normal translation.
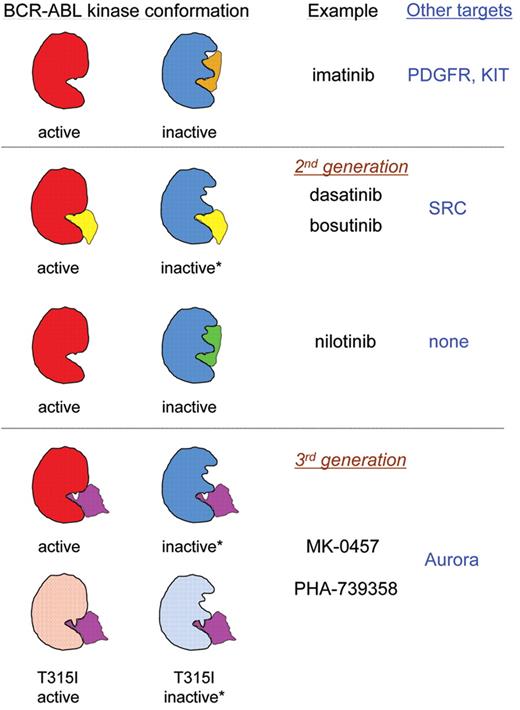
Schematic of binding modes of clinically active BCR-ABL kinase inhibitors. “Active” refers to the open conformation of BCR-ABL that is compatible with ATP binding and hydrolysis. “Inactive” refers to the closed conformation that is not catalytically active. The ability to bind to various BCR-ABL kinase domain conformations was determined by co-crystal studies, except when marked with an asterisk (*), which reflects results of computer modeling–based studies of binding. “Other targets” lists notable kinases that are reported to be inhibited at concentrations required to inhibit BCR-ABL activity.
Schematic of binding modes of clinically active BCR-ABL kinase inhibitors. “Active” refers to the open conformation of BCR-ABL that is compatible with ATP binding and hydrolysis. “Inactive” refers to the closed conformation that is not catalytically active. The ability to bind to various BCR-ABL kinase domain conformations was determined by co-crystal studies, except when marked with an asterisk (*), which reflects results of computer modeling–based studies of binding. “Other targets” lists notable kinases that are reported to be inhibited at concentrations required to inhibit BCR-ABL activity.
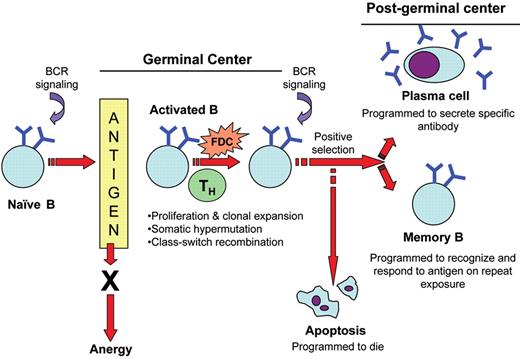
Schematic representation of normal B-cell ontogeny in the germinal center.
Naïve B-cells encounter antigen and undergo proliferation, clonal expansion, somatic hypermutation and class-switch recombination in the germinal center microenvironment. The resulting B-cell clones with high affinity antibodies are positively selected to differentiate into plasma cells and secrete large quantities of specific antibodies or become memory B-cells that recognize and respond to repeat antigen exposure. The remaining B-cell clones are eliminated by apoptosis.
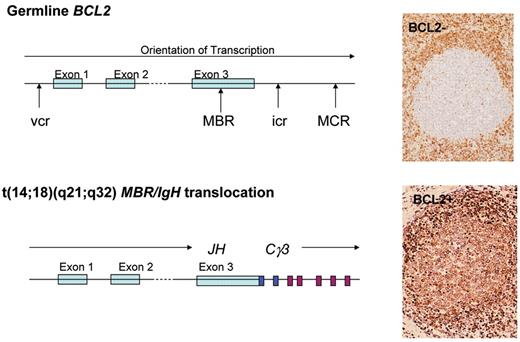
The t(14;18) translocation and expression of the BCL2 protein. Schematic representations show the germline configuration of the BCL2 gene as well as the chromosomal breakpoints involved in the t(14;18)(q21;q32) translocation. The BCL2 protein is absent in normal germinal center B-cells whereas it is expressed in the neoplastic follicles of follicular lymphoma, as shown by immunohistologic staining for the BCL2 protein.
The t(14;18) translocation and expression of the BCL2 protein. Schematic representations show the germline configuration of the BCL2 gene as well as the chromosomal breakpoints involved in the t(14;18)(q21;q32) translocation. The BCL2 protein is absent in normal germinal center B-cells whereas it is expressed in the neoplastic follicles of follicular lymphoma, as shown by immunohistologic staining for the BCL2 protein.
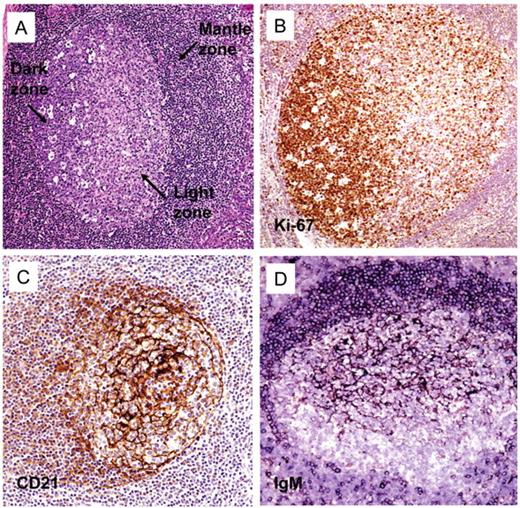
Histologic and immunohistologic images of normal germinal centers.
(A) Hematoxylin and eosin-stained sections of a normal tonsil shows a germinal center with polarized dark and light zones. The dark zone shows rapidly proliferating cells as evidenced by increased mitotic activity and tingible body macrophages. The light zone is pale stained and shows a low proliferative activity; (B) An immunohistologic stain for Ki-67 (MIB1) highlights increased proliferation in one pole of the secondary follicle corresponding to the dark zone; (C) An immunohistologic stain for CD21 highlights the follicular dendritic cell meshwork within the germinal center; (D) An immunohistologic stain for IgM highlights immune complexes captured on follicular dendritic cell processes that are involved in antigen presentation to germinal center B-cells.
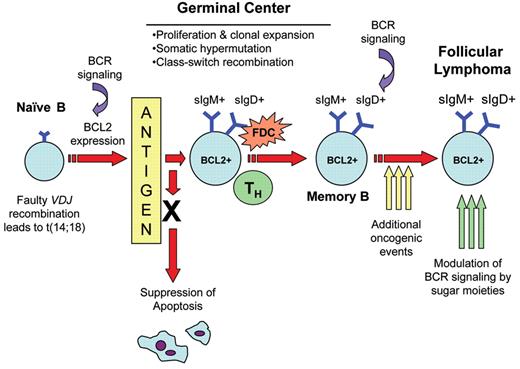
Schematic representation of t(14;18)+B-cell clones and the genesis of follicular lymphoma. Defective VDJ recombination leads to the t(14;18) translocation and aberrant BCL2 protein expression. Recent work by Roulland and colleagues52 suggests that antigen stimulation allows the t(14;18)+ B-cell in normal healthy individuals to enter the germinal center and undergo the germinal center reaction. Ectopic expression of BCL2 in the germinal center favors extended B-cell survival such that additional genetic changes are acquired by this B cell and may ultimately result in transformation to follicular lymphoma. In addition, N-glycosylation sites in Ig V regions by directly binding oligomannose sugars could modulate B-cell receptor-mediated signaling and contribute to follicular lymphoma pathogenesis.
Schematic representation of t(14;18)+B-cell clones and the genesis of follicular lymphoma. Defective VDJ recombination leads to the t(14;18) translocation and aberrant BCL2 protein expression. Recent work by Roulland and colleagues52 suggests that antigen stimulation allows the t(14;18)+ B-cell in normal healthy individuals to enter the germinal center and undergo the germinal center reaction. Ectopic expression of BCL2 in the germinal center favors extended B-cell survival such that additional genetic changes are acquired by this B cell and may ultimately result in transformation to follicular lymphoma. In addition, N-glycosylation sites in Ig V regions by directly binding oligomannose sugars could modulate B-cell receptor-mediated signaling and contribute to follicular lymphoma pathogenesis.
Molecular mechanisms of pain.
Abbreviations: DH, dorsal horn; T, thalamus; LS, limbic system; RF, reticular formation.
Reprinted with permission from
Molecular mechanisms of pain.
Abbreviations: DH, dorsal horn; T, thalamus; LS, limbic system; RF, reticular formation.
Reprinted with permission from
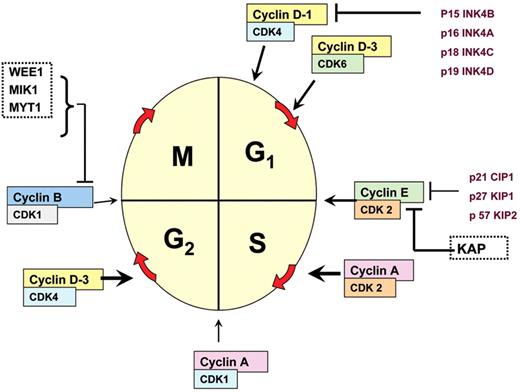
Schematic representation of cell cycle regulatory influences, depiciting the role of cyclin D, the cell cycle–dependent kinases, and the cell cycle–dependent kinase inhibitors.
Schematic representation of cell cycle regulatory influences, depiciting the role of cyclin D, the cell cycle–dependent kinases, and the cell cycle–dependent kinase inhibitors.
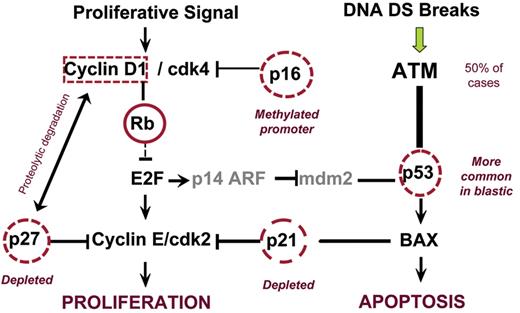
The interplay of established cell cycle events in the pathogenesis in MCL. Loss of cell cycle–dependent kinase inhibitor influence (i.e., p16, p21 or p27) synergizes with the driving force of cyclin D1 overexpression. P53 is more commonly mutated in cases of blastic mantle cell lymphoma
The interplay of established cell cycle events in the pathogenesis in MCL. Loss of cell cycle–dependent kinase inhibitor influence (i.e., p16, p21 or p27) synergizes with the driving force of cyclin D1 overexpression. P53 is more commonly mutated in cases of blastic mantle cell lymphoma
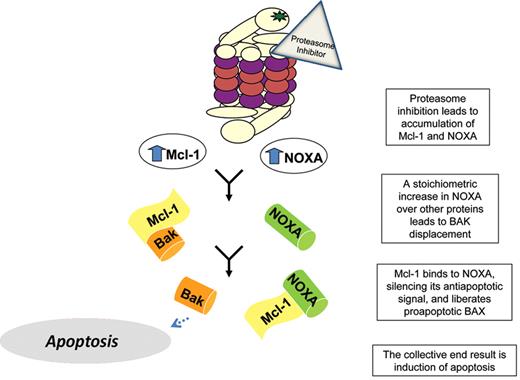
A theoretical model for how proteasome inhibitors could affect the balance between pro- and antiapoptotic forces in MCL. Proteasome inhibition leads to increased NOXA and MCL-1, the latter of which could theoretically mitigate some of the therapeutic merit of targeting the proteaseome. However, the selective increase in NOXA results in liberation of the pro-apoptotic BAX, which then mediates induction of apoptosis.
A theoretical model for how proteasome inhibitors could affect the balance between pro- and antiapoptotic forces in MCL. Proteasome inhibition leads to increased NOXA and MCL-1, the latter of which could theoretically mitigate some of the therapeutic merit of targeting the proteaseome. However, the selective increase in NOXA results in liberation of the pro-apoptotic BAX, which then mediates induction of apoptosis.
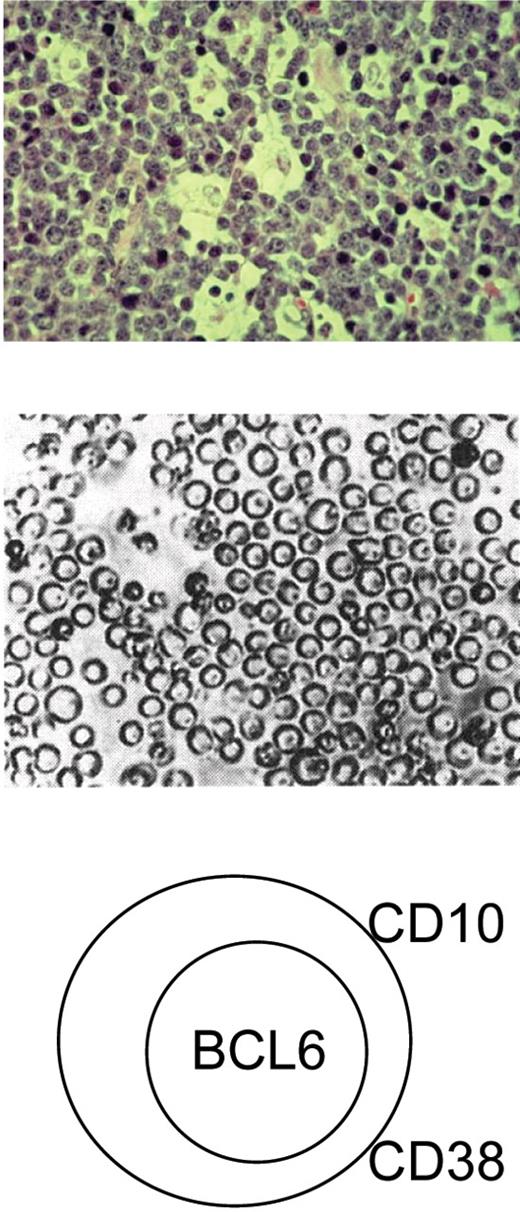
Characteristic features of Burkitt lymphoma (BL) cells. Top: characteristic ‘starry sky’ histology associated with BL tumors brought about by the presence of round monomorphic B cells interspersed with macrophages. Middle: BL cells grow as round single cells in culture. Bottom: BL cells express markers characteristic of germinal center B cells such as CD10, CD38 and BCL6.
Characteristic features of Burkitt lymphoma (BL) cells. Top: characteristic ‘starry sky’ histology associated with BL tumors brought about by the presence of round monomorphic B cells interspersed with macrophages. Middle: BL cells grow as round single cells in culture. Bottom: BL cells express markers characteristic of germinal center B cells such as CD10, CD38 and BCL6.
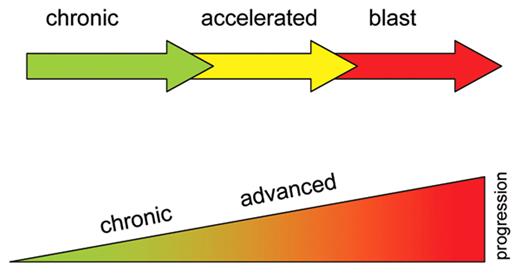
Conceptual models of CML progression. The upper panel shows the concept of stepwise progression of CML, with distinct clinical and pathological features. However, the data suggest the lower panel concept of a continual evolution of chronic phase through an advanced phase (accelerated and blast phases), with progression starting at the acquisition of the Philadelphia chromosome.
Conceptual models of CML progression. The upper panel shows the concept of stepwise progression of CML, with distinct clinical and pathological features. However, the data suggest the lower panel concept of a continual evolution of chronic phase through an advanced phase (accelerated and blast phases), with progression starting at the acquisition of the Philadelphia chromosome.
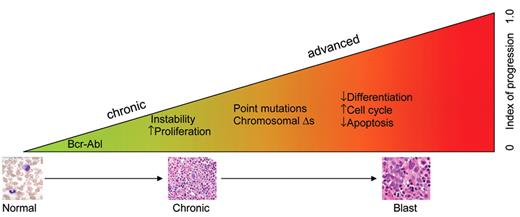
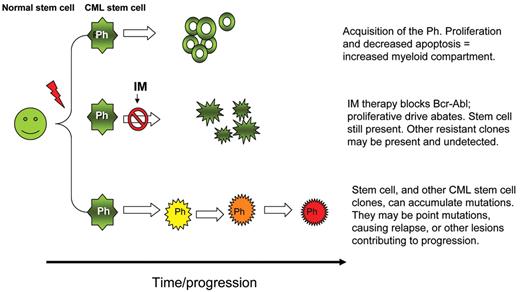
CML progression. Stem cells acquire the Philadelphia chromosome. This begins a process of instability, and increased proliferation yielding multiple clones of progenitors. With unchecked Bcr-Abl activity, instability causes genetic alterations, including point mutations in Abl (and elsewhere), and gross cytogenetic changes. This causes a block in differentiation, increased proliferation of primitive cells, and a block of apoptosis. In this model, progression from chronic to blast phase begins from the outset of disease. The ability of TKI to arrest the progression depends on how long Bcr-Abl activity went on unimpeded.
CML progression. Stem cells acquire the Philadelphia chromosome. This begins a process of instability, and increased proliferation yielding multiple clones of progenitors. With unchecked Bcr-Abl activity, instability causes genetic alterations, including point mutations in Abl (and elsewhere), and gross cytogenetic changes. This causes a block in differentiation, increased proliferation of primitive cells, and a block of apoptosis. In this model, progression from chronic to blast phase begins from the outset of disease. The ability of TKI to arrest the progression depends on how long Bcr-Abl activity went on unimpeded.
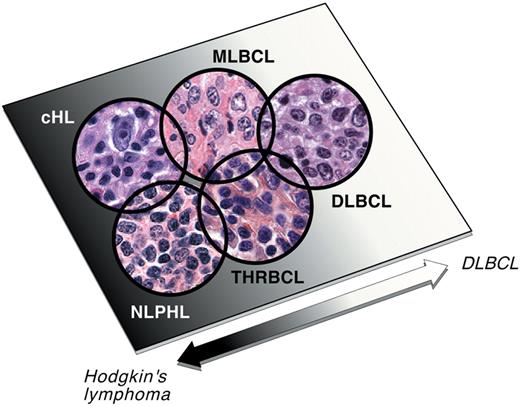
DLBCL, gray zone lymphomas, and Hodgkin lymphomas. MLBCL and T-cell/histocyte-rich large B-cell lymphoma (T/HRBCL) are considered “gray zone lymphomas,” which share certain characteristics of large B-cell lymphomas and Hodgkin lymphomas (cHL and NLPHL, respectively), including increased host inflammatory response. The similarities among these entities point to a group of tumors that are partially defined and possibly driven by their interaction with the host microenvironment. Reprinted with permission from Abramson and Shipp.2
DLBCL, gray zone lymphomas, and Hodgkin lymphomas. MLBCL and T-cell/histocyte-rich large B-cell lymphoma (T/HRBCL) are considered “gray zone lymphomas,” which share certain characteristics of large B-cell lymphomas and Hodgkin lymphomas (cHL and NLPHL, respectively), including increased host inflammatory response. The similarities among these entities point to a group of tumors that are partially defined and possibly driven by their interaction with the host microenvironment. Reprinted with permission from Abramson and Shipp.2
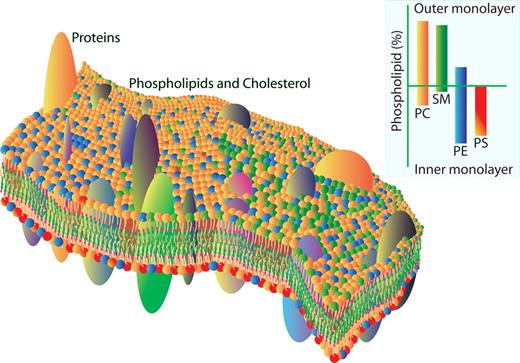
The red cell membrane bilayer. Phospholipid molecular species move rapidly in the plane as well as across the bilayer in a dynamic but highly organized fashion. Areas are enriched in certain lipids essential for proper protein function, and phospholipids are asymmetrically distributed across the lipid bilayer, with the amino phospholipids (PS and PE) on the inside and choline containing phospholipids (PC and SM) on the outside.
The red cell membrane bilayer. Phospholipid molecular species move rapidly in the plane as well as across the bilayer in a dynamic but highly organized fashion. Areas are enriched in certain lipids essential for proper protein function, and phospholipids are asymmetrically distributed across the lipid bilayer, with the amino phospholipids (PS and PE) on the inside and choline containing phospholipids (PC and SM) on the outside.
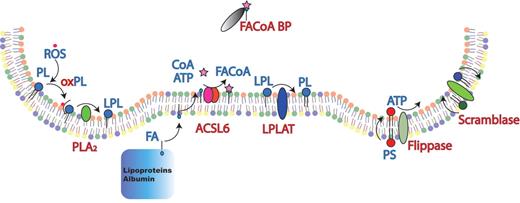
Maintenance of phospholipid organization in red blood cells. Reactive oxygen species (ROS) will modify the unsaturated fatty acyl side chains in phospholipids (PL). The oxidized lipids (oxPL) will have a different orientation in the bilayer and are recognized by phospholipases (PLA2) that remove the oxidized fatty acid to generate lysophospholipid (LPL). Fatty acid (FA) taken up from plasma is activated to fatty acyl CoA (FA-CoA) by acylCoA synthetase (ACSL6) using adenosine triphosphate (ATP) and Coenzyme A (CoA). FA-CoA pools are modulated by FA-CoA–binding protein (FA-CoABP). Lysophospholipid acylCoA acyltransferases (LPLAT) use FA-CoA and LPL to generate PL, completing the de-acylation/re-acylation repair cycle. The asymmetric distribution of phospholipids across the bilayer is maintained by the Magnesium ATP-dependent aminophospholipidtranslocase or flippase, which transfers PS and PE from outer to inner monolayer at the expense of ATP. Loss of phospholipid asymmetry and the exposure of PS is triggered by a phospholipid scrambling activity.
Maintenance of phospholipid organization in red blood cells. Reactive oxygen species (ROS) will modify the unsaturated fatty acyl side chains in phospholipids (PL). The oxidized lipids (oxPL) will have a different orientation in the bilayer and are recognized by phospholipases (PLA2) that remove the oxidized fatty acid to generate lysophospholipid (LPL). Fatty acid (FA) taken up from plasma is activated to fatty acyl CoA (FA-CoA) by acylCoA synthetase (ACSL6) using adenosine triphosphate (ATP) and Coenzyme A (CoA). FA-CoA pools are modulated by FA-CoA–binding protein (FA-CoABP). Lysophospholipid acylCoA acyltransferases (LPLAT) use FA-CoA and LPL to generate PL, completing the de-acylation/re-acylation repair cycle. The asymmetric distribution of phospholipids across the bilayer is maintained by the Magnesium ATP-dependent aminophospholipidtranslocase or flippase, which transfers PS and PE from outer to inner monolayer at the expense of ATP. Loss of phospholipid asymmetry and the exposure of PS is triggered by a phospholipid scrambling activity.
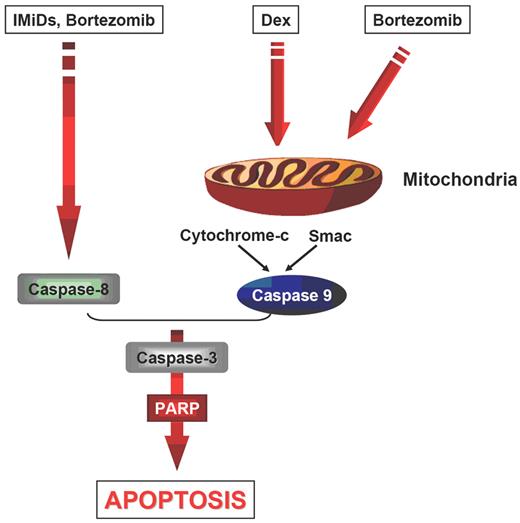
Schematic representation of main caspase-mediated pathways for the direct anti–multiple myeloma (MM) effect of proteasome inhibitors (bortezomib), immunomodulatory thalidomide derivatives (IMIDs) and dexamethasone (Dex).
Schematic representation of main caspase-mediated pathways for the direct anti–multiple myeloma (MM) effect of proteasome inhibitors (bortezomib), immunomodulatory thalidomide derivatives (IMIDs) and dexamethasone (Dex).
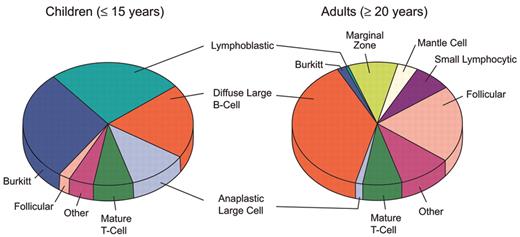
Histologic types of non-Hodgkin lymphoma in children and adults, SEER, 2001–2004, ICDO-3 (source – SEER 17)
Histologic types of non-Hodgkin lymphoma in children and adults, SEER, 2001–2004, ICDO-3 (source – SEER 17)
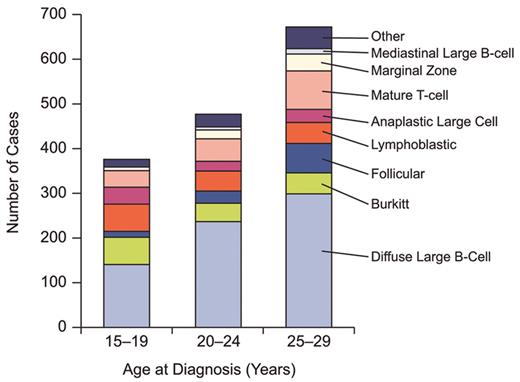
Histologic types of non-Hodgkin lymphoma by age group, SEER, 2001–2004, ICDO-3 (source - SEER 17).
Histologic types of non-Hodgkin lymphoma by age group, SEER, 2001–2004, ICDO-3 (source - SEER 17).
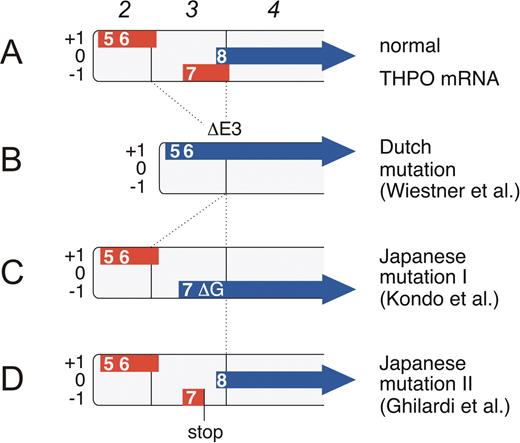
Effect ofTHPOgene mutations on the composition of uORFs inTHPOmRNA. The main THPO mRNA transcribed from promoter 2 is shown. Boxes numbered in italic represent exons. The uORFs are drawn as thick red lines and are placed into one of the three reading frames (+1, 0, and −1). The THPO coding region is shown as a thick blue arrow. Numbers indicate the order in which the uAUGs appear in the full length THPO mRNA (uAUGs 1–4 are not shown). The eighth AUG is the physiological initiation codon. (A) Translation of normal THPO mRNA is physiologically almost completely inhibited by the presence of uORFs in the 5′-UTR. In particular, the uORF 7 is a potent inhibitor of translation, most likely because of its extension beyond the physiological start site. (B) A splice donor mutation in the Dutch HT family causes exon 3 skipping (DE3) that deletes uORF7 and shifts the THPO coding sequence into reading frame +1. Tpo translation now initiates from the fifth and sixth AUG. (C) The Japanese mutation I consists of a single G nucleotide deletion (DG) that shifts the THPO coding sequence into reading frame -1. Tpo translation now initiates from the seventh AUG. Note that both the Dutch and the Japanese mutation I create altered THPO signal peptides, but do not alter the sequence of the mature Tpo protein. Both signal peptides remain functionally active and promote secretion of a biologically active Tpo protein. (D) The Japanese mutation II creates a premature stop codon in uORF7. This allows re-initiation of translation at the physiological start site (the eighth AUG).
Figure reprinted from
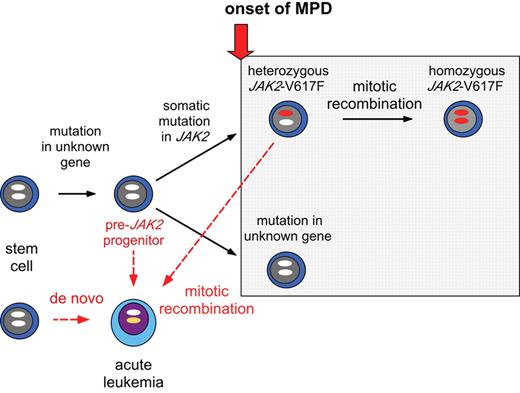
Model of the clonal progression in myeloproliferative disorder (MPD). The onset of MPD is preceded by a somatic mutation (sporadic MPD) or germ-line mutation (familial MPD) in an as yet unknown gene(s). The onset of MPD coincides with the acquisition of a mutation in JAK2 or other genes (gray box). Acute leukemia can arise de novo or from the MPD clone. Leukemic transformation of a “pre-JAK2” progenitor or stem cell could explain the absence of JAK2-V617F in leukemic blasts from MPD patients previously positive for JAK2-V617F. Alternatively, JAK2-V617F could be lost during mitotic recombination of a cell heterozygous for JAK2-V617F (dashed line).
Model of the clonal progression in myeloproliferative disorder (MPD). The onset of MPD is preceded by a somatic mutation (sporadic MPD) or germ-line mutation (familial MPD) in an as yet unknown gene(s). The onset of MPD coincides with the acquisition of a mutation in JAK2 or other genes (gray box). Acute leukemia can arise de novo or from the MPD clone. Leukemic transformation of a “pre-JAK2” progenitor or stem cell could explain the absence of JAK2-V617F in leukemic blasts from MPD patients previously positive for JAK2-V617F. Alternatively, JAK2-V617F could be lost during mitotic recombination of a cell heterozygous for JAK2-V617F (dashed line).
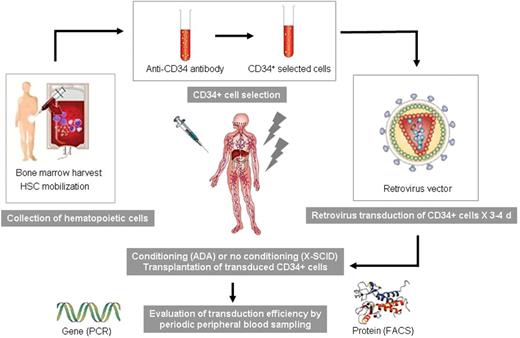
Typical hematopoietic stem cell (HSC) gene therapy trial design. Marrow or mobilized peripheral blood cells are collected from patients, enriched for hematopoietic stem and progenitor cells via CD34+ selection, and exposed to retrovirus vector particles during in vitro culture. Transduced cells are then reinfused into the patient, either with or without prior myelosuppressive or ablative conditioning radiochemotherapy. Patients are then monitored for the presence of vector and corrective transgene expression in hematopoietic progeny cells.
Typical hematopoietic stem cell (HSC) gene therapy trial design. Marrow or mobilized peripheral blood cells are collected from patients, enriched for hematopoietic stem and progenitor cells via CD34+ selection, and exposed to retrovirus vector particles during in vitro culture. Transduced cells are then reinfused into the patient, either with or without prior myelosuppressive or ablative conditioning radiochemotherapy. Patients are then monitored for the presence of vector and corrective transgene expression in hematopoietic progeny cells.
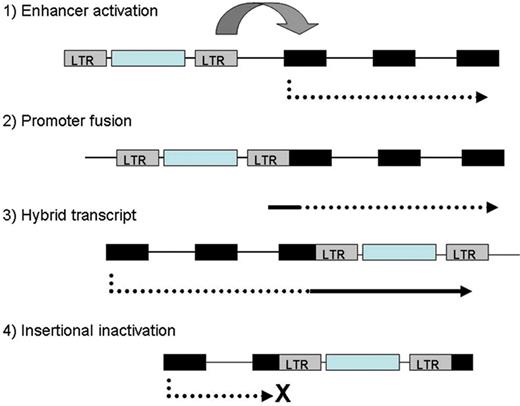
Insertional mutagenesis by integrating vectors. An integrated provirus with strong enhancers in the vector LTRs can activate adjacent proto-oncogenes or inactivate tumor repressor genes.
Insertional mutagenesis by integrating vectors. An integrated provirus with strong enhancers in the vector LTRs can activate adjacent proto-oncogenes or inactivate tumor repressor genes.
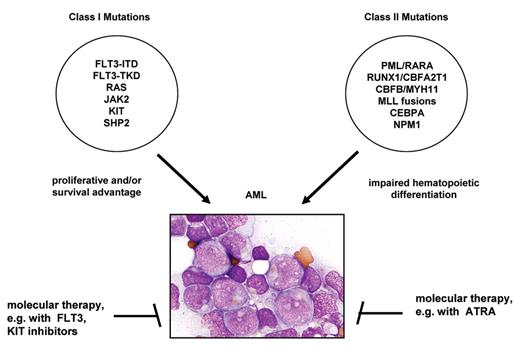
Model of leukemogenesis with two cooperating classes of mutations.
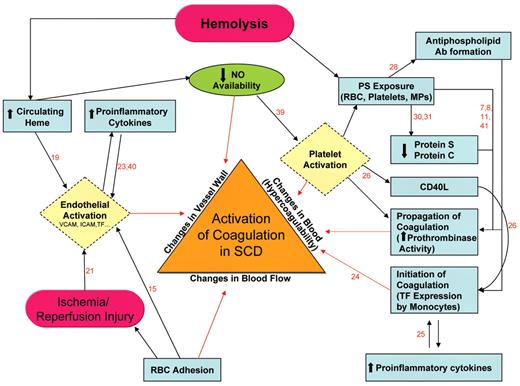
Schematic representation of pathophysiological mechanisms (described or postulated) leading to activation of coagulation in sickle cell disease. Based on Virchow’s triad, the illustrated pathways contribute to activation of coagulation (and possibly eventual thrombosis) by one of three broad mechanisms: (1) changes in the vessel wall; (2) changes in blood flow; and/or (3) changes in the composition of blood components (‘hypercoagulability’). The numbers refer to the specific reference describing the particular pathway (represented by a joining arrow); references are listed at the end of the text.
Abbreviations: NO, nitric oxide; PS, phosphatidylserine; RBC, red blood cell; MPs, microparticles; TF, tissue factor; SCD, sickle cell disease
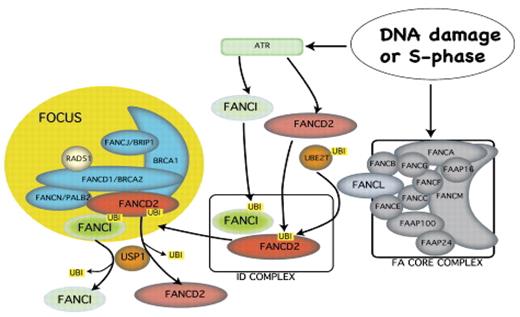
Schematic representation of protein interactions in the FA pathway. DNA lesions arising during normal S-phase or after DNA damage activate ATR-dependent phosphorylation and FA core complex–dependent monoubiquitination of both FANCD2 and FANCI. The ID complex consisting of monoubiquitinated FANCD2 and FANCI forms nuclear foci in chromatin. USP1 deubiquitinates both proteins.
Reprinted from Developmental Cell, vol. 23. Grompe M, van de Vrogt H. The Fanconi family adds a fraternal twin; pp 661–662, 2007, with permission from Elsevier.37
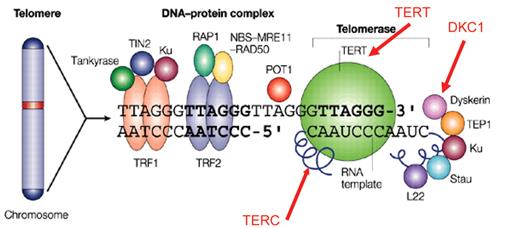
Telomere maintenance pathway. Telomeres contain hexanucleotide repeats (TTAGGG)n and associated proteins involved in the addition of these base pairs during mitosis. The major components of the telomerase pathway are the RNA template and the telomerase enzyme, but multiple proteins are involved, only some of which are shown in the figure.
Reprinted by permission from Macmillan Publishers Ltd:

