In vitro differentiation of embryonic stem (ES) cells into embryoid bodies.
Left panel shows undifferentiated ES cells growing on mouse embryonic fibroblasts. Removal of the ES cells from the feeder cells and dispersal into semi-solid media or growth in hanging drop cultures initiates aggregation of cells and spontaneous differentiation. The resulting cystic structures, called embryoid bodies, grow in size over time and support locally organized tissue structures. In the right panel, arrows indicate blood islands consisting of hemoglobinized erythrocytes, mimicking the formation of similar structures in the developing yolk sac of the murine embryo.
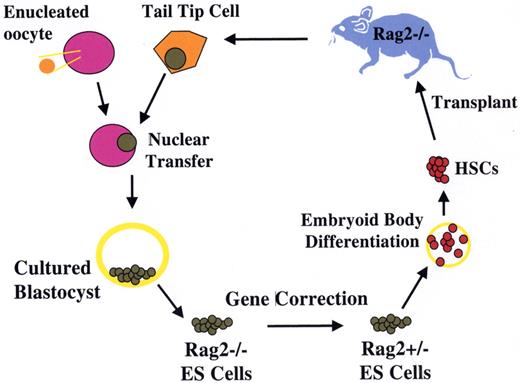
Treatment of genetic immune deficiency in the mouse by therapeutic cloning.
The Rag2−/− mouse lacks all B and T cell function as a result of homozygous deletion of the Recombinase Activating Gene 2 (Rag2). Cells from a clipping of the mouse tail were cultured briefly. Using micromanipulation, the nucleus of a tail-tip cell was removed and inserted into a donor egg, whose own nucleus had been removed by micromanipulation. The reconstructed zygote underwent cleavage and development to blastocyst stage, after which the cells of the inner cell mass were removed and placed in culture, forming an ES cell line with genetic equivalence to the Rag2−/− mouse. One of the two defective Rag2 alleles was replaced with an intact copy by homologous recombination, generating a repaired ntESRag2+/− cell line. These cells were differentiated in vitro into hematopoietic stem cells, and used to transplant irradiated immune-deficient Rag2−/− recipients. Engrafted mice showed restoration of T and B cell populations and production of serum immunoglobulin, demonstrating the feasibility of combined gene and cell therapy (therapeutic cloning; Rideout et al27).
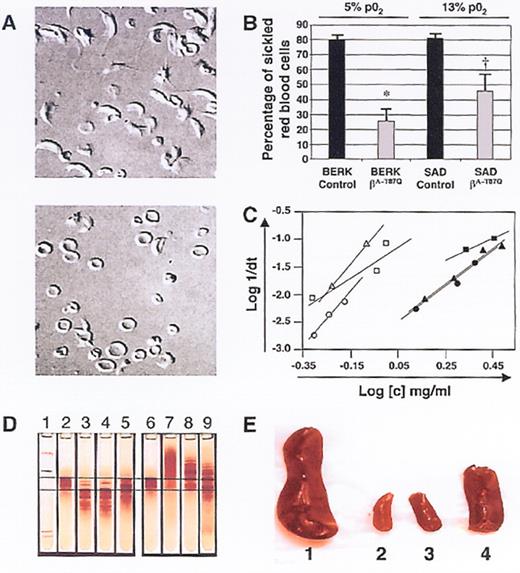
(in Atweh et al). Correction of sickle cell pathology by T87Q-globin containing lentivirus-transduced BERK and SAD marrow.
Nomarski optics microscopy of red cells from mice transplanted with either (top) mock- or (bottom) T87Q-globin lentivirus-transduced BERK bone marrow cells under 5% pO2 3 months after transplantation.
Quantification of the percentage of sickle red cells from recipients of mock-transduced and T87Q-globin transduced BERK or SAD bone marrow under 5% or 13% oxygen conditions, respectively.43 Error bars indicate SE; *, P = .01; †, P = .03.
Relationship between log of reciprocal delay time of HbS polymerization and Hb concentration of red cell lysates.
Time courses of Hb polymerization in lysates were performed at various concentrations by the temperature jump method: open triangle: a mouse recipient of mock-transduced SAD marrow; close square, lysate from a mouse recipient of bT87Q-globin transduced SAD marrow; open circle, a mouse recipient of mock-transduced BERK marrow; closed circle, a mou se recipient of bT87Q-globin transduced BERK marrow.
Reprinted with permission from
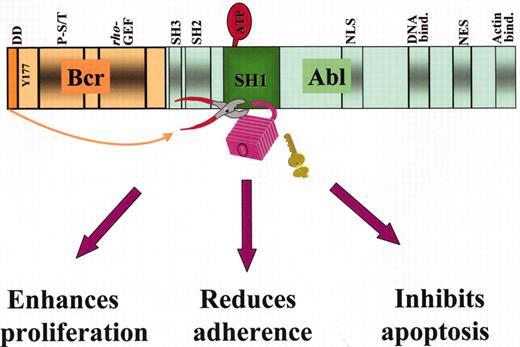
Structure of the p210Bcr-Abl fusion protein and mechanisms of leukemogenesis.
Some of the important functional domains on the Bcr and Abl moieties are shown: in Bcr, the dimerization domain (DD), the Y177 autophosphorylation site for adaptor protein binding, the phosphoserine/phosphothreonine-rich sequences(P-S/T) on the SH2-binding domain, and the region homologous to Rho guanidine nucleotide exchange factors (Rho-GEF); in Abl, the Src-homology SH2 and SH3 regulatory domains, the tyrosine kinase (SH1) domain where binding to ATP and substrate takes place, 1 of the 3 nuclear localization signal (NLS), 1 of 3 DNA-binding, a nuclear export signal (NES) and 1 of 2 actin-binding domains. Disruption of the tightly regulated tyrosine kinase activity of Abl by dimerization of the protein effected by BCR first exon sequences (indicated by the arrow) results cellular responses that characterize the leukemic phenotype.
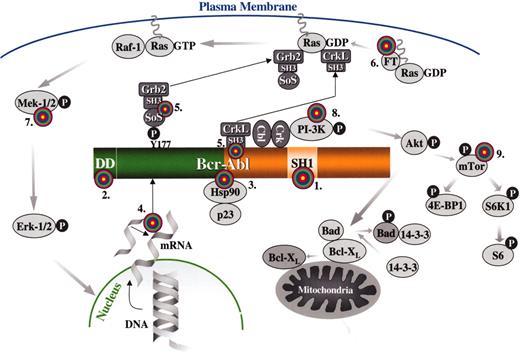
Targets for molecular therapy.
Each target is numbered and marked with a “target” sign. 1. The SH1 or tyrosine kinase domain of Bcr-Abl: its activity can be inhibited by signal transduction inhibitors, such as imatinib mesylate or adaphostin. 2. The dimerization (coiled-coil) domain of Bcr-Abl: deletion/mutation or blocking of this domain with peptides that prevent oligomerization renders Bcr-Abl nontransforming. 3. Heat-shock protein 90 (Hsp90): Hsp90 functions as chaperone that maintains the stability of the Bcr-Abl protein; antagonists of Hsp90, such as geldanamycin, destabilize Bcr-Abl and promote its proteasomal degradation. 4. BCR-ABL mRNA: synthesis of the Bcr-Abl oncoprotein may be suppressed by inhibiting BCR-ABL mRNA by either antisense oligonucleotides, siRNA molecules, ribozymes or DNAzymes. 5. The SH3 domains of the adapter proteins Grb2 or CrkL: synthetic peptides that bind to these domains “uncouple” Bcr-Abl from downstream signaling pathways. 6. Farnesyl transferase: inhibitors of farnesyl transferase suppress Ras signaling by preventing the attachment of a farnesyl group to Ras; farnesyl groups are essential for the normal functioning of Ras since they tether these G-proteins to the plasma membrane. 7. Mek (MAPK or ERK Kinase): Bcr-Abl constitutively activates the Ras-Raf-Mek-Erk pathway; Mek inhibitors may be useful for inhibiting this mitogenic cascade 8. PI-3 kinase: PI-3 kinase associates with Bcr-Abl and undergoes activation as a result of tyrosine phosphorylation; PI-3 kinase cell signaling may be inhibited with compounds such as wortmannin or LY294002, resulting in apoptosis by activation of Bad (proapoptotic) via Akt and its dissociation from Bcl-XL (antiapoptotic). 9. mTOR: this PI-3 kinase effector and two of its substrates, ribosomal protein S6 and 4E-BP1, are constitutively phosphorylated in a Bcr-Abl-dependent manner; the pathway can be inhibited by rapamycin.
Estimated log-reduction of BCR-ABL transcripts after 12 months of first-line therapy by treatment arm.
Whereas an estimated 39% of all patients on imatinib achieved a ≥ 3 log reduction in BCR-ABL/BCR ratio at 12 months (20% had a ≥ 3 to < 4 log reduction, 19% had a ≥ 4 log reduction), only 2% of patients on interferon (IFN) + cytarabine (Ara-C) achieved this molecular response within 12 months (P < .001).
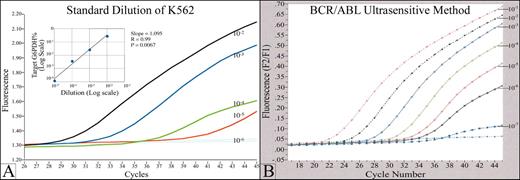
An example of a real time quantitative fluorescence RT-PCR assay (Q-RT-PCR) for detection of minimal residual disease (MRD) in chronic myelogenous leukemia (CML).
(A) The graph shows a typical standard curve, generated by Q-RT-PCR of a series of serial dilutions of a BCR/ABL (+) cell line. BCR/ABL transcripts in RNA from clinical samples are quantitated by comparison to this standard curve. p210 and p190 BCR/ABL transcripts, in both cell line standards and patient samples, are normalized to G6PDH housekeeping gene. The fluorescence signal generated during the PCR process is proportional to the starting quantity of BCR/ABL template, and is detected by a fluorimeter in the instrument. The PCR reaction is monitored in real time, during the geometric phase of the reaction; data from the linear and plateau phases are not used. The standard test will detect 1 BCR/ABL (+) cell in 105 normal cells. (B) Increased analytical sensitivity of 1 (+) cell in 106-7 normal cells can be obtained by concentration of sample RNA used in the analysis.
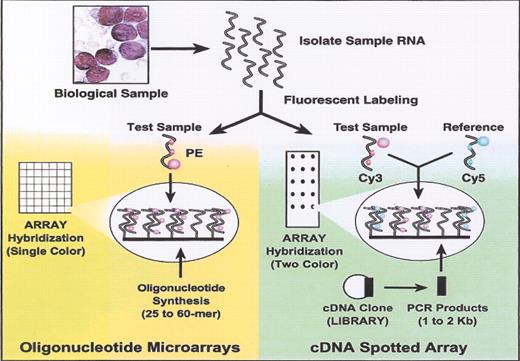
(in Braziel et al). Oligonucleotide versus cDNA microarrays.
Reprinted with permission from
(in Braziel et al). Oligonucleotide versus cDNA microarrays.
Reprinted with permission from
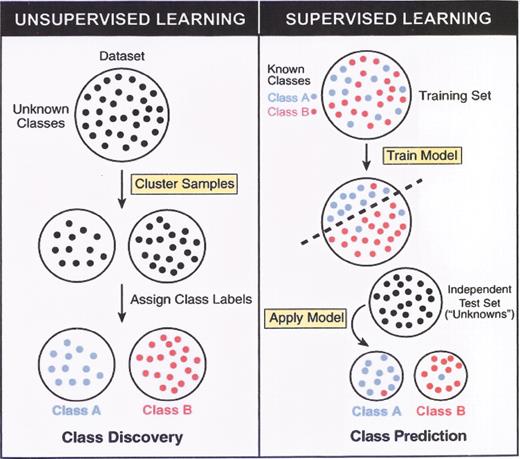
(in Braziel et al). Unsupervised versus supervised learning.
Reprinted with permission from
(in Braziel et al). Unsupervised versus supervised learning.
Reprinted with permission from
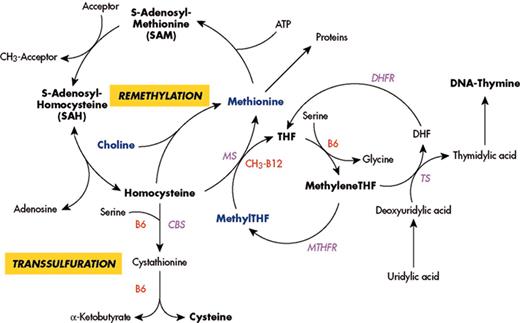
(in Carmel et al). Major pathways for remethylation and transsulfuration of homocysteine and related metabolic pathways, showing substrates, cofactors and enzymes.
Abbreviations: MS, methionine synthase; CbS, cystathionine beta synthase; MTHFR, methylenetetrahydrofolate reductase; DHFR, dihydrofolate reductase; TS, thymidylate synthase; THF, tetrahydrofolate.
(in Cottler-Fox et al). A model for stress-induced mobilization.
DNA-damaging chemotherapy drugs such as Cy and inflammatory cytokines such as G-CSF first induce a transient increase in SDF-1 levels within the BM as part of the alarm situation. Next, G-CSF directly and indirectly (via secretion of IL-8, SDF-1, and other factors) triggers neutrophils to proliferate and release proteases such as elastase, cathepsin G, and proteinase 3. In parallel, proliferation and activation of osteoclasts, which release the mobilizing chemokine IL-8 and secrete MMP-9 in response to SDF-1 stimulation, take place. The massive inflammatory proteolytic enzyme activity leads to degradation of stem cell anchorage and retention signals (VCAM-1 and SDF-1), inactivation of G-CSF, and remodeling of the BM extracellular matrix. MMP-9 mediates shedding of membrane-bound SCF, which together with proteinase 3 induces progenitor cell proliferation and CXCR4 upregulation, followed by partial inactivation of CXCR4 and c-kit by the proteolytic machinery. These sequential events, which are repeated and intensified after each cycle of G-CSF stimulation, orchestrate the egress of progenitors from the BM into the circulation.
Abbreviations: BM, bone marrow; CXCR4, CXC chemokine receptor 4; Cy, cyclophosphamide; G-CSF, granulocyte colony-stimulating factor; IL-8, interleukin-8; MMP-9, matrix metalloproteinase 9; SCF, stem cell factor; SDF-1, stromal-derived cell factor-1; VCAM-1, vascular cell adhesion molecule 1.
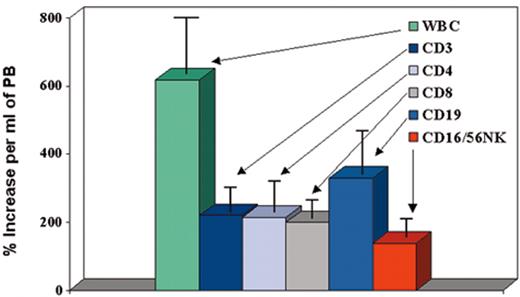
(in Cottler-Fox et al). Effect of granulocyte colony-stimulating factor (G-CSF) on mobilization of leukocyte subsets in normal donors (n = 100).
(in Cottler-Fox et al). Effect of granulocyte colony-stimulating factor (G-CSF) on mobilization of leukocyte subsets in normal donors (n = 100).
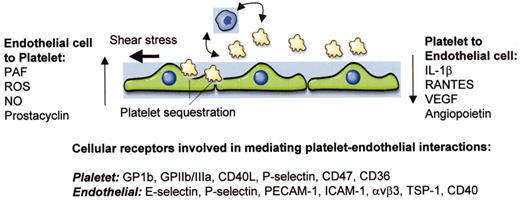
(in Warkentin et al). Schematic of interactions between platelets and endothelial cells.
Shown are three endothelial cells, a number of small platelets, and a representative monocyte. Vertical arrows indicate soluble molecules that are released by one cell type and signal in the other. Curved and horizontal arrows indicate platelet-leukocyte cross talk and shear stress, respectively, both of which may impact on the nature of endothelial-platelet interactions. At bottom are platelet and endothelial receptors that have been implicated in mediating interactions between these two cell types.
Abbreviations: PAF, platelet activating factor; ROS, reactive oxygen species; NO, nitric oxide; IL-1, interleukin-1; VEGF, vascular endothelial growth factor; GP, glycoprotein; PECAM-1, platelet endothelial adhesion molecule-1; ICAM-1, intercellular adhesion molecule-1; TSP-1, thrombospondin-1.
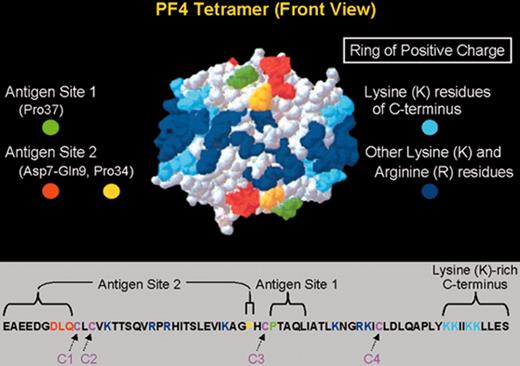
Primary and secondary structure of PF4 in relation to HIT neoepitopes.
(Top) A 3-dimensional representation of the PF4 tetramer is shown, indicating the 2 neoepitope sites identified by Li et al.6 The “ring of positive charge” formed by the lysine residues in the C-terminus of PF4 (light blue) and other lysine and arginine residues (dark blue) is also shown. (Bottom) The linear sequence of the 70–amino acid polypeptide of a single PF4 molecule is shown. Four such polypeptides combine to form the PF4 tetramer. PF4 is classified as a member of the C-X-C subfamily of chemokines because of its cysteine10-leucine11-cysteine12 sequence.
Abbreviations: PF4, platelet factor 4.
Adapted with permission from Li et al.6
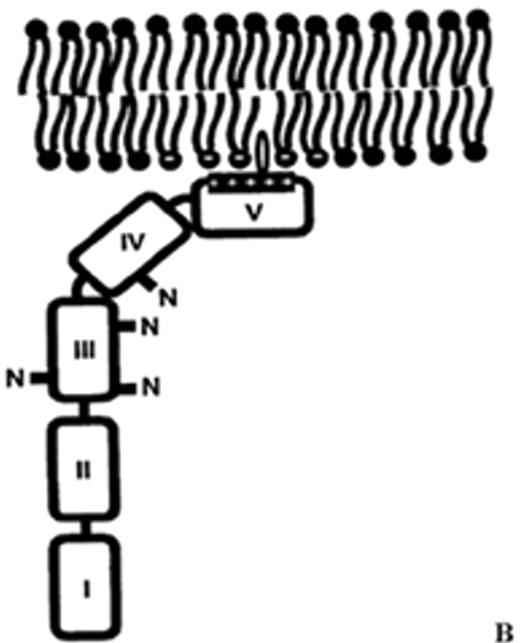
(in Warkentin et al). Structure of human plasma β2GPI.
(A) Ribbon model of β2GPI based upon crystal structure: the protein is composed of an extended chain of 5 SCR domains having a “fishhook” appearance. The structure of SCR domain V deviates from the standard fold of the 4 other domains and forms the putative phospholipid-binding site. β-strands are shown in red and helices in green.
(B) The structural data suggest a simple membrane-binding mechanism in which the cationic patch of domain V has an affinity for anionic phospholipid. The stretch of Ser311 to Lys317 forms a hydrophobic loop that inserts into the lipid bilayer and positions Trp316 at the interface region between the acyl chains and the phosphate headgroups of the lipids, thereby anchoring the β2GPI in the membrane.
Current data support the hypothesis that aPL antibodies reactive against β2GPI mainly recognize epitopes on domains I and II and that antibody-mediated dimerization of β2GPI markedly increases the affinity of β2GPI for phospholipid.
Reprinted with permission from
Abbreviations: aPL, antiphospholipid; β2GPI, β2-glycoprotein I; SCR, short consensus repeat.
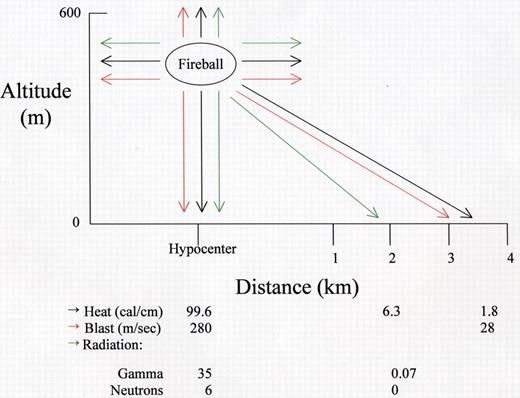
(in MacVittie et al). Energy distribution from Little Boy.
Shown are the amounts of heat, blast force, and radiation released at the hypocenter and at various distances from the hypocenter after detonation of a Uranium-235 bomb (Little Boy) on August 6, 1945, at an altitude of 580 meters. The amount of power was approximately 15 kilotons of TNT.
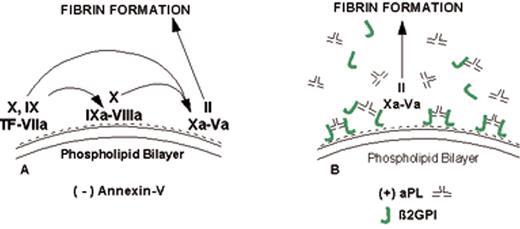
(in Warkentin et al). Mechanism of lupus anticoagulant effect—role as surrogate marker.
(A) Anionic phospholipids, predominantly phosphatidylserine (negative charges), serve as potent cofactors for the assembly of 3 different coagulation complexes—the TF-VIIa complex, the IXa-VIIIa complex, and the Xa-Va complex—and thereby accelerate blood coagulation. The TF complex yields factors IXa or factor Xa; the IXa complex yields factor Xa; and the Xa formed from both of these reactions is the active enzyme in the prothrombinase complex that yields factor IIa (thrombin), which in turn cleaves fibrinogen to form fibrin.
(B) Lupus anticoagulant effect. aPL antibody-β2GPI complexes can prolong the coagulation times, compared with control antibodies, when there are limiting quantities of anionic phospholipid available. This effect occurs via antibody recognition of domains I or II on the β2GPI, which results in dimeric and pentameric IgG- and IgM-β2GPI complexes (such as the IgG antibody-β2GPI complexes shown) having high affinity for phospholipid via the cofactor’s domain V. These high-affinity complexes reduce the access of coagulation factors to anionic phospholipids, thereby resulting in a “lupus anticoagulant” effect in conditions where the antibody-cofactor complexes have sufficiently high affinity.
(C) Annexin A5, in the absence of aPL antibodies, serves as a potent anticoagulant by crystallizing over the anionic phospholipid surface, shielding it from availability to bind coagulation proteins.
(D) aPL antibody-mediated disruption of annexin A5 shield. aPL-β2GPI complexes with high affinity for phospholipid membranes disrupt the ability of annexin A5 to form ordered crystals on the phospholipid surface. This defective crystallization results in a net increase of the amount of anionic phospholipid available for promoting coagulation reactions.
Abbreviations: aPL, antiphospholipid; β2GPI, β2-glycoprotein I; TF, tissue factor.
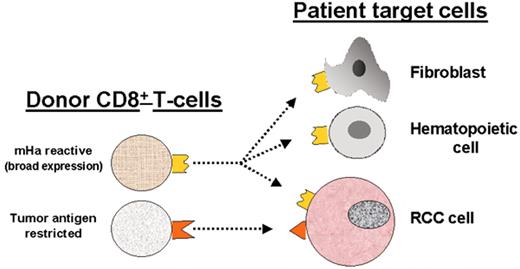
(in Storb et al). Allogeneic T cells identified in renal cell carcinoma (RCC) patients with a graft-versus-tumor (GVT) effect.
(in Storb et al). Allogeneic T cells identified in renal cell carcinoma (RCC) patients with a graft-versus-tumor (GVT) effect.
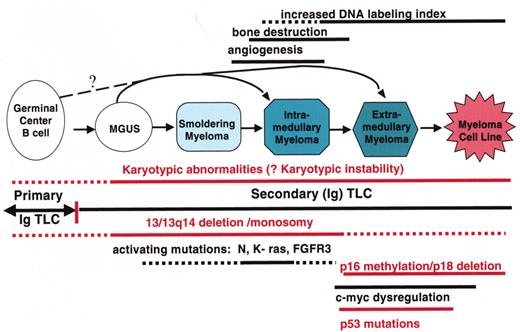
(in Barlogie et al). Multistep molecular pathogenesis of monoclonal gammopathy of undertermined significance (MGUS)/multiple myeloma (MM) tumors.
Defined stages of pathogenesis are depicted, with arrows indicating potential pathways. The approximate timing of several clinical features and oncogenic changes are depicted as thick horizontal lines, with dashed regions reflecting some uncertainty as to the precise time that these changes occur. The vertical line that separates primary and secondary translocations is meant to depict the cessation of IgH switch recombination and somatic hypermutation during B cell maturation.
Superior survival with Total Therapy II (TT II) versus Total Therpay I (TT I) in patients without cytogenetic abnormalities (CA).
Superior survival with Total Therapy II (TT II) versus Total Therpay I (TT I) in patients without cytogenetic abnormalities (CA).
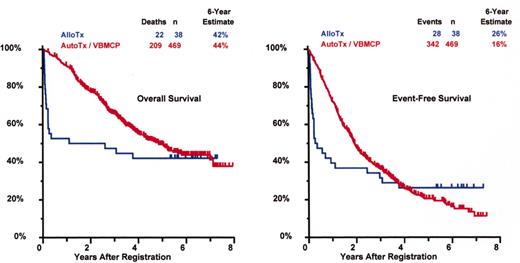
SWOG 9321: allotransplant arm compared to autotx/VBMCP combined.
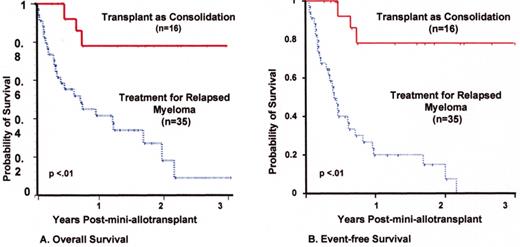
Mini-allotransplant: Influence of timing: better outcome with mini-allotx applied for consolidation after melphalan (MEL) 300-based autotransplant than for salvage.
Mini-allotransplant: Influence of timing: better outcome with mini-allotx applied for consolidation after melphalan (MEL) 300-based autotransplant than for salvage.
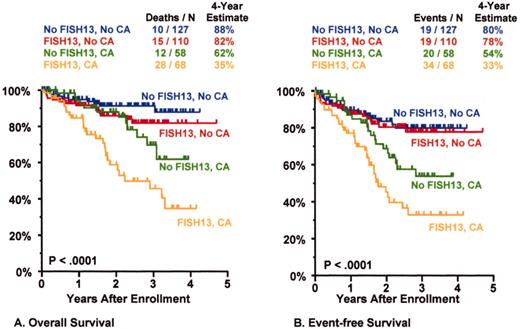
Total Therapy II: adverse prognostic implications of metaphase-defined compared to FISH-defined del 13.
Total Therapy II: adverse prognostic implications of metaphase-defined compared to FISH-defined del 13.
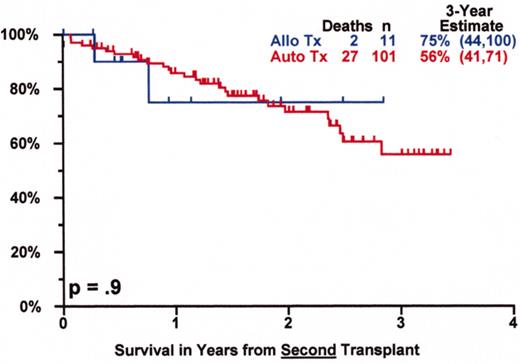
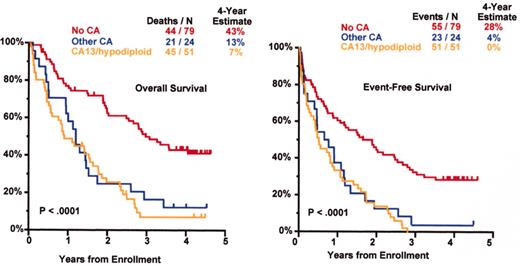
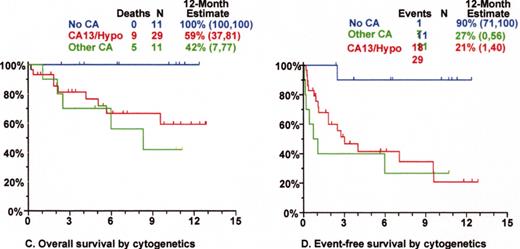
Tandem autotx (Total Therapy II) versus auto/mini-allotx in myeloma with CA13/hypodiploid abnormalities.
Tandem autotx (Total Therapy II) versus auto/mini-allotx in myeloma with CA13/hypodiploid abnormalities.
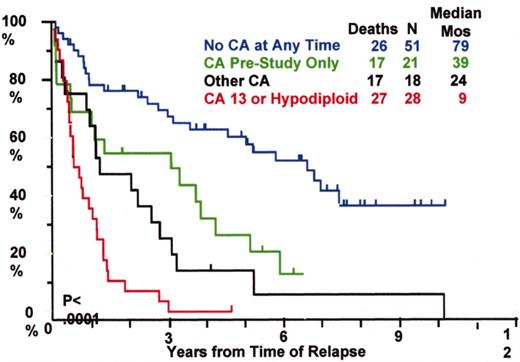
Total Therapy I: cytogenetic abnormalities (CA) at relapse associated with poor prognosis.
Total Therapy I: cytogenetic abnormalities (CA) at relapse associated with poor prognosis.
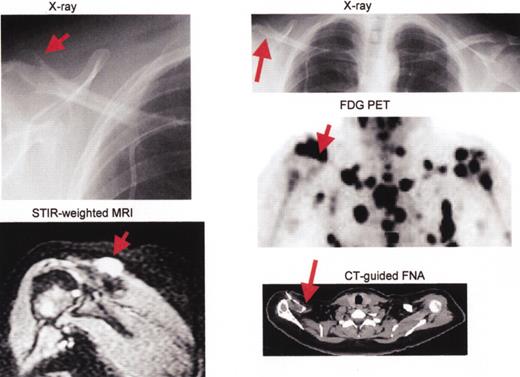
Multiple myeloma including large plasmacytoma distal right clavicle (arrows).
Multiple myeloma including large plasmacytoma distal right clavicle (arrows).
Thalidomide salvage therapy: cytogenetic abnormalities (CA) associated with poor prognosis.
Thalidomide salvage therapy: cytogenetic abnormalities (CA) associated with poor prognosis.
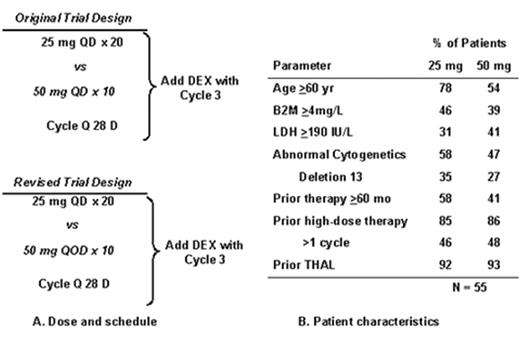
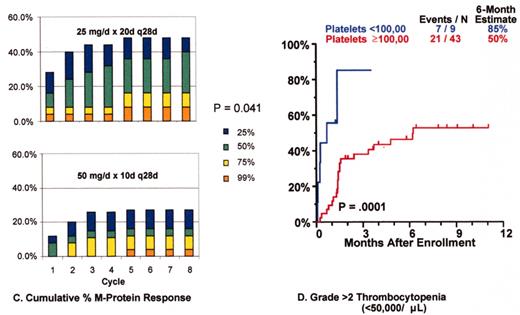
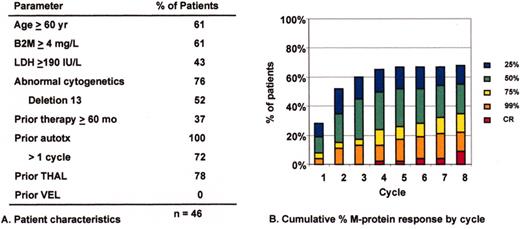
Revimidâ Phase III trial for relapsing myeloma (Arkansas 2001-44).
Velcadeâ + thalidomide for posttransplant relapse (Arkansas 200136).
Velcadeâ + thalidomide for posttransplant relapse (Arkansas 200136).
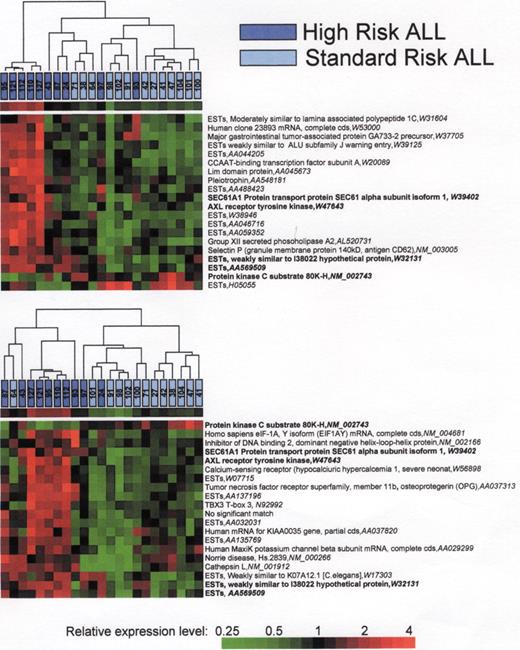
A) Hierarchical cluster analysis of the 20 best array elements discriminating standard risk and high risk as determined by T-test. B) Hierarchical cluster analysis of the 20 best array elements discriminating standard risk and high risk as determined by Infoscore. Modified with permission from reference 41.
A) Hierarchical cluster analysis of the 20 best array elements discriminating standard risk and high risk as determined by T-test. B) Hierarchical cluster analysis of the 20 best array elements discriminating standard risk and high risk as determined by Infoscore. Modified with permission from reference 41.
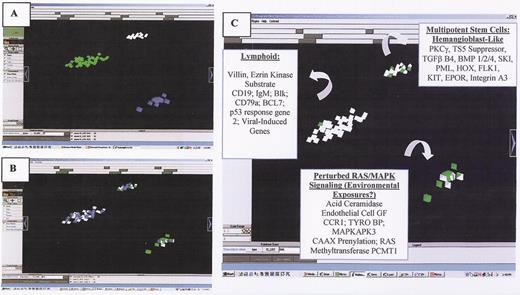
(in Carroll et al) . A. Three intrinsic biologic clusters of infants were distinguished by VxInsight and through PCA (not shown). In each cluster, each individual patient is represented by a pyramid. B. Each case was queried for the presence of ALL (white pyramids) vs. AML (green pyramids) morphology (appreciated better in Figure 1C, to the right) and the presence of chromosomal rearrangements involving the MLL gene (shown as blue pyramids). C. ANOVA was used to identify the most statistically significant genes that were unique to each cluster and which could be used to distinguish each cluster.
(in Carroll et al) . A. Three intrinsic biologic clusters of infants were distinguished by VxInsight and through PCA (not shown). In each cluster, each individual patient is represented by a pyramid. B. Each case was queried for the presence of ALL (white pyramids) vs. AML (green pyramids) morphology (appreciated better in Figure 1C, to the right) and the presence of chromosomal rearrangements involving the MLL gene (shown as blue pyramids). C. ANOVA was used to identify the most statistically significant genes that were unique to each cluster and which could be used to distinguish each cluster.
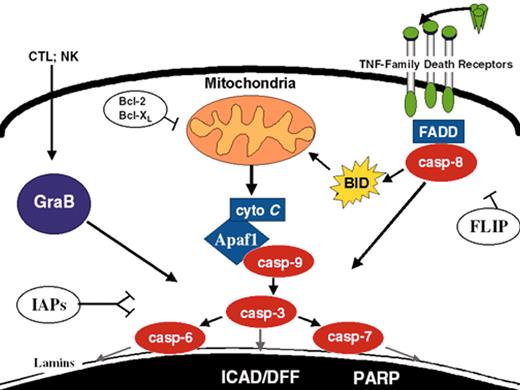
(in Carroll et al). Apoptosis pathways. Some of the better-defined apoptosis pathways are depicted. FLIP, Bcl-2/Bcl-XL, and IAPs suppress specific steps in the extrinsic, intrinsic, and convergence pathways, respectively.
(in Carroll et al). Apoptosis pathways. Some of the better-defined apoptosis pathways are depicted. FLIP, Bcl-2/Bcl-XL, and IAPs suppress specific steps in the extrinsic, intrinsic, and convergence pathways, respectively.
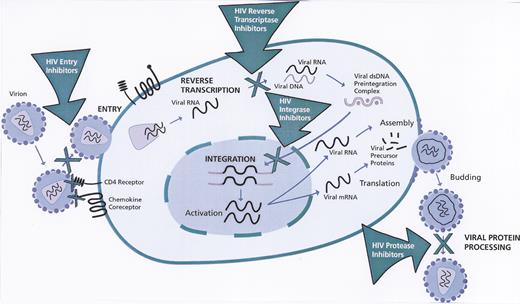
Stages of human immunodeficiency virus (HIV)-1 life cycle targeted by anti-HIV drugs.
Reprinted with permission from
Stages of human immunodeficiency virus (HIV)-1 life cycle targeted by anti-HIV drugs.
Reprinted with permission from
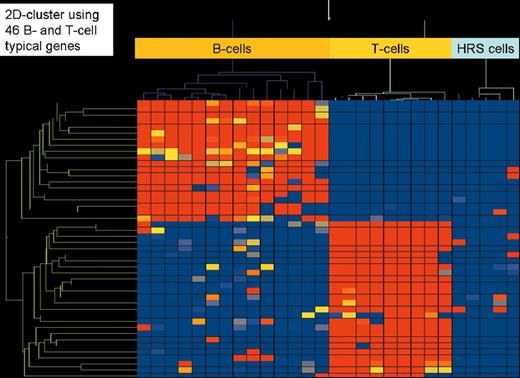
(in Diehl et al). Two-dimensional cluster analysis of 15 B-cell lines, 9 T-cell lines, and 5 classical Hodgkin’s lymphoma cell lines (3 of B-cell type and 2 of T-cell type) employing 46 genes highly characteristic for their expression in all types of B cells (except plasma B cells) and T cells, respectively. High gene expression is indicated in red, low or absent gene expression in blue.
(in Diehl et al). Two-dimensional cluster analysis of 15 B-cell lines, 9 T-cell lines, and 5 classical Hodgkin’s lymphoma cell lines (3 of B-cell type and 2 of T-cell type) employing 46 genes highly characteristic for their expression in all types of B cells (except plasma B cells) and T cells, respectively. High gene expression is indicated in red, low or absent gene expression in blue.
(in Diehl et al). Two-dimensional cluster analysis of the 5 classical Hodgkin’s lymphoma cell lines (L1236, L428 and KM-H2 [B-cell type]; L540 and HDLM-2 [T-cell type]) using 29 genes that are statistically significantly different expressed (Student t-test, P-value cutoff .05 including correction by Benjamini and Hochberg False Discovery Rate) between B-cell and T-cell type classical Hodgkin lymphoma cell lines.
(in Diehl et al). Two-dimensional cluster analysis of the 5 classical Hodgkin’s lymphoma cell lines (L1236, L428 and KM-H2 [B-cell type]; L540 and HDLM-2 [T-cell type]) using 29 genes that are statistically significantly different expressed (Student t-test, P-value cutoff .05 including correction by Benjamini and Hochberg False Discovery Rate) between B-cell and T-cell type classical Hodgkin lymphoma cell lines.
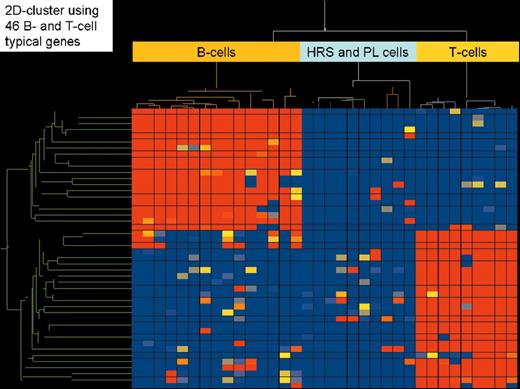
(in Diehl et al). Two-dimensional cluster analysis of the same 15 B-cell lines, 9 T-cell lines, and 5 classical Hodgkin’s lymphoma cell lines using the same 46 highly B-cell and T-cell characteristic genes and the same as in Figure 1. In addition, 5 plasmacytoma cell lines were included to analyze their relation to classical Hodgkin lymphoma cell lines.
(in Diehl et al). Two-dimensional cluster analysis of the same 15 B-cell lines, 9 T-cell lines, and 5 classical Hodgkin’s lymphoma cell lines using the same 46 highly B-cell and T-cell characteristic genes and the same as in Figure 1. In addition, 5 plasmacytoma cell lines were included to analyze their relation to classical Hodgkin lymphoma cell lines.
(in Diehl et al). Two-dimensional cluster analysis of 5 plasmacytoma cell lines and 3 classical Hodgkin’s lymphoma cell lines of B-cell type (L1236, L428, and KM-H), which was generated by application of 216 genes that were significantly different expressed between both lymphoma entities (Student t-test, P-value cutoff .00005 without multiple testing correction).
(in Diehl et al). Two-dimensional cluster analysis of 5 plasmacytoma cell lines and 3 classical Hodgkin’s lymphoma cell lines of B-cell type (L1236, L428, and KM-H), which was generated by application of 216 genes that were significantly different expressed between both lymphoma entities (Student t-test, P-value cutoff .00005 without multiple testing correction).
(in Diehl et al). NF-κB–dependent gene profiling in HRS cells (L428 cells [black bars] and HDLM2 cells [red bars]).
Potential target genes, which fit the criteria for decreased/increased genes upon NF-κB inhibition in both cell lines, are grouped based on their molecular functions.
Reprinted with permission from
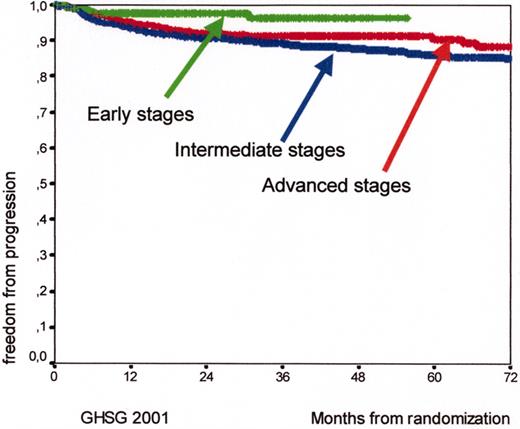
Kaplan Meyer curves for freedom from progression (FFP) and for early (HD7, arm B, 289 patients), intermediate (HD8, 1138 patients), and advanced (HD9, arm C, 466 patients) Hodgkin’s lymphoma patients according to the experience of the German Hodgkin’s Lymphoma Study Group (GHSG) in 2001.
Kaplan Meyer curves for freedom from progression (FFP) and for early (HD7, arm B, 289 patients), intermediate (HD8, 1138 patients), and advanced (HD9, arm C, 466 patients) Hodgkin’s lymphoma patients according to the experience of the German Hodgkin’s Lymphoma Study Group (GHSG) in 2001.
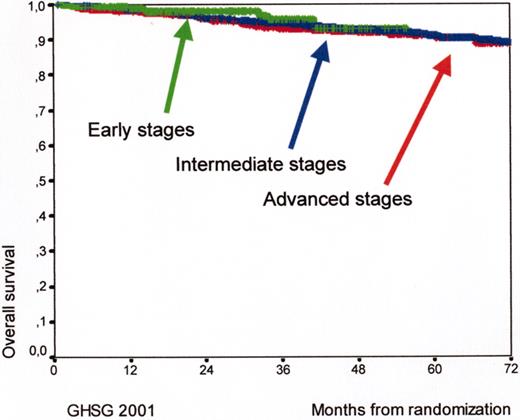
Kaplan Meyer curves for overall survival (OS) for early (HD7, arm B, 289 patients), intermediate (HD8, 1138 patients), and advanced (HD9, arm C, 466 patients) Hodgkin’s lymphoma patients according to the experience of the German Hodgkin’s Lymphoma Study Group (GHSG) in 2001.
Kaplan Meyer curves for overall survival (OS) for early (HD7, arm B, 289 patients), intermediate (HD8, 1138 patients), and advanced (HD9, arm C, 466 patients) Hodgkin’s lymphoma patients according to the experience of the German Hodgkin’s Lymphoma Study Group (GHSG) in 2001.
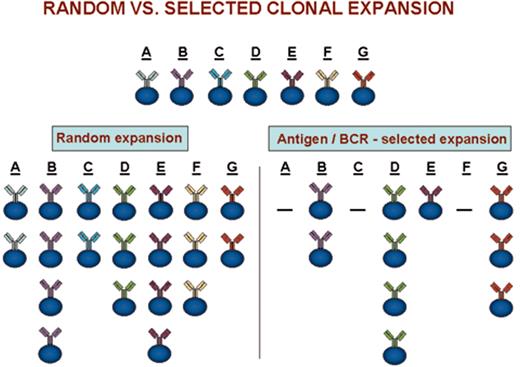
(in Keating et al). Clonal expansions that could occur after random versus antigen/BCR-selected cellular triggering.
(in Keating et al). Clonal expansions that could occur after random versus antigen/BCR-selected cellular triggering.
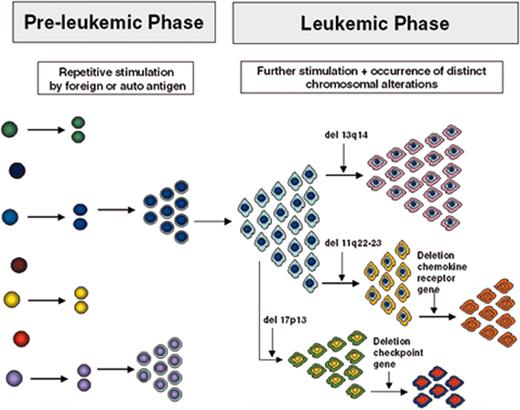
(in Keating et al). Model for the development and evolution of B-CLL cells.
See text for description. Note that the specific chromosomal changes are illustrations of the principle of clonal diversification; their presence and sequence of occurrence are not to be taken literally.
(in Keating et al). Model for the development and evolution of B-CLL cells.
See text for description. Note that the specific chromosomal changes are illustrations of the principle of clonal diversification; their presence and sequence of occurrence are not to be taken literally.
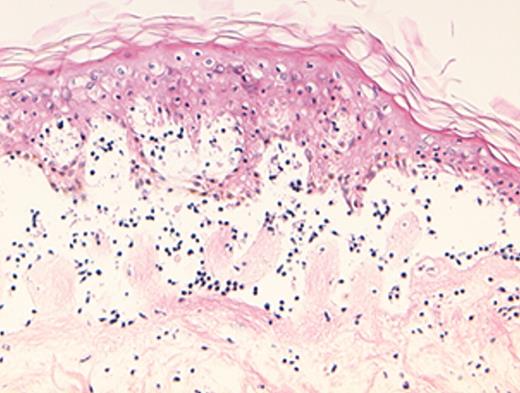
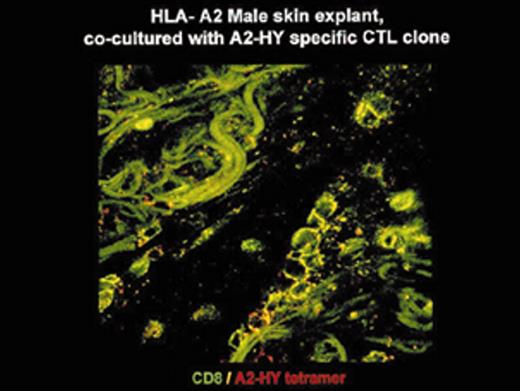
(in Barrett et al). In situ localization of mHa-specific cytotoxic T lymphocytes (CTLs) in the skin explant assay.
Skin sections of an HLAA2 male individual were incubated with autologous peripheral blood mononuclear cells (PBMCs)—data not shown, or with H-Y- or HA-1-specific CTLs.
Figure 2a. H-Y-specific CTLs showing grade IV reactions.
Figure 2b. Skin sections incubated with FITC-conjugated CD8 antibodies (green) plus APC-conjugated (red) tetrameric HLA-A2-H-Y peptide complex (H-YA2 tetramer)—analyzed by confocal microscopy
Figure 2c. Mild histopathological changes induced by HA-1-specific CTLs.
Reprinted with permission of the Nature Publishing Group (http://www.nature.com).44
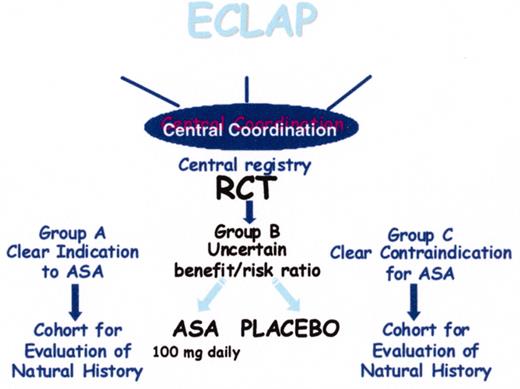
(in Barosi/Spivak et al). Design of the European Collaboration on Low-dose Aspirin in Polycythemia Vera (ECLAP) study.
(in Barosi/Spivak et al). Design of the European Collaboration on Low-dose Aspirin in Polycythemia Vera (ECLAP) study.
(in Barosi/Spivak et al). Probability of death, cardiovascular death, and hematological progression-free survival of 1638 patients with polycythemia vera recruited in the European Collaboration on Low-dose Aspirin in Polycythemia Vera (ECLAP) study.
(in Barosi/Spivak et al). Probability of death, cardiovascular death, and hematological progression-free survival of 1638 patients with polycythemia vera recruited in the European Collaboration on Low-dose Aspirin in Polycythemia Vera (ECLAP) study.








![Stein Figure 2. (in Diehl et al). Two-dimensional cluster analysis of the 5 classical Hodgkin’s lymphoma cell lines (L1236, L428 and KM-H2 [B-cell type]; L540 and HDLM-2 [T-cell type]) using 29 genes that are statistically significantly different expressed (Student t-test, P-value cutoff .05 including correction by Benjamini and Hochberg False Discovery Rate) between B-cell and T-cell type classical Hodgkin lymphoma cell lines.](https://ash.silverchair-cdn.com/ash/content_public/journal/hematology/2003/1/10.1182_asheducation-2003.1.597/5/m_diehl_fig2color.jpeg?Expires=1768650764&Signature=uW~xnWkU~eMQy~TXz1ng2OluplQwX95tPNqMJ2hKbY7XcqTn8KOjmcemO2~fAB7JLgY1SlkKSI4XsxgRjseTsDhzJk77r-IK5FtIxnRkQTp8ozaz9dHAZkSUM4Y14avwf0SSj4c87GAwk-VBo0Ehon8rWDjncVqo7N8x-AgFQeL97nXDpCjkja3M4Nr5eacLltZTYMH1-GQ0ToEGVf~3ntgGE4OoFLXo4hFHah0C-DM0IP7j6mEzrIyqHFNoiHsAee~~8SOOpaTy7YZYvFGnLmvlTiOyVbpkVuv3teQHP7OxTPxF8zpZNwp~GeBe-CksFVoaG-Vg7RM7akphFHsOsA__&Key-Pair-Id=APKAIE5G5CRDK6RD3PGA)

![Stein Figure 8. (in Diehl et al). NF-κB–dependent gene profiling in HRS cells (L428 cells [black bars] and HDLM2 cells [red bars]). / Potential target genes, which fit the criteria for decreased/increased genes upon NF-κB inhibition in both cell lines, are grouped based on their molecular functions. / Reprinted with permission from Hinz M, Lemke P, Anagnostopoulos I, et al. Nuclear factor kappaB-dependent gene expression profiling of Hodgkin’s disease tumor cells, pathogenetic significance, and link to constitutive signal transducer and activator of transcription 5a activity. J Exp Med. 2002;196:605–617. by copyright permission of The Rockefeller University Press.](https://ash.silverchair-cdn.com/ash/content_public/journal/hematology/2003/1/10.1182_asheducation-2003.1.597/5/m_diehl_fig8color.jpeg?Expires=1768650764&Signature=MMEt5kBFP0qtiT5LFslzfx9Shvf-JMFSAGyDOQAhpH2HfAsSH-FI4Ik0D6SRmu2lRQYoQihrL1mNnz3HvKE1mVM92xkbrlvv4b-Fhq-uiVjihOiwdMc~rhMQRA4lGeog4Tqk7ySdD5VB8WlYz~rcovb9WNC1PedT3UBot37bdL8nkEmsREW3jNiw9U3YwqYILQqMF9q18P44g81kcx3~kE2UdOtJl6E8zmZB18mNxOvEHf~jYwyQZlB4f~RYdKkE9bumMZA66QEx5IC3wusCzCYoLsmG3v9Hdf4Jj9oIi~poW-jJN5FU-mJ-NPDgpHXOa3IBVDMpUzkDMrVaYy9YYg__&Key-Pair-Id=APKAIE5G5CRDK6RD3PGA)
