Key Points
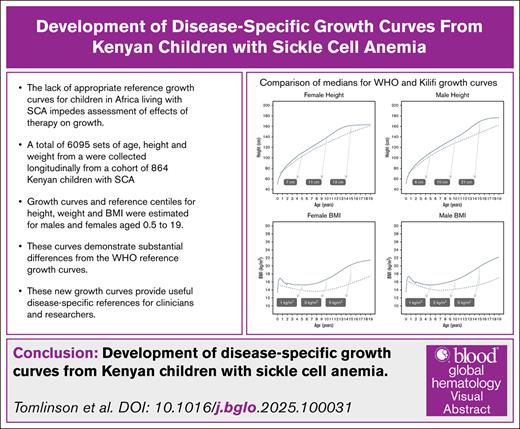
The lack of appropriate reference growth curves for children in Africa living with SCA impedes assessment of the effect of therapy on growth.
Our new growth curves, based on a Kenyan cohort with SCA, will provide useful disease-specific references for clinicians and researchers.
Visual Abstract
Sickle cell anemia (SCA) is a life-threatening hemoglobinopathy with worldwide distribution. Featuring multiple acute and chronic complications, SCA is also associated with growth impairment. A lack of appropriate reference data on height, weight, and body mass index (BMI) impedes assessment of the effect of therapies on growth in African children with SCA. The World Health Organization (WHO) growth curves are derived from healthy populations. We analyzed 6095 height and weight paired measurements (2875 in females, 3220 in males; median, 5 measurements/child) from 864 children with SCA, aged 6 months to 19 years, in Kilifi, Kenya. The growth percentile trajectories showed substantial delays when compared with the WHO curves. The female deficits in median height were 7 cm at age 5 years, 11 cm at 10 years, and 13 cm at age 15 years. Male height deficits were 6 cm at 5 years, 10 cm at 10 years, and 21 cm at 15 years. Median weight deficits were 3.4 kg at 5 years and 9.1 kg at 10 years for females, and 3.0 kg at 5 years and 7.7 kg at 10 years for males. The median BMI was lower by 5 kg/m2 at 15 years for both females and males. These newly developed Kilifi SCA growth curves provide useful disease-specific references for clinicians and researchers.
Introduction
Sickle cell anemia (SCA) is a common and severe inherited hemoglobinopathy with wide global distribution that is particularly concentrated across sub-Saharan Africa.1 SCA leads to a broad array of acute clinical complications, including vaso-occlusive painful events, acute chest syndrome, and stroke.2 Recurrent parenchymal sickling causes chronic damage to the spleen, brain, lungs, kidneys, heart, eyes, and bones. This progressive damage causes substantial morbidity and leads to early mortality.3
In addition to acute and chronic clinical manifestations, SCA is associated with poor linear growth and delayed pubertal development. Early studies from the Jamaica newborn cohort of almost 300 children reported substantial and progressive deficits in both height and weight among children with homozygous sickle cell disease (HbSS) when compared with normal controls,4-6 and males were more affected than females.5 Bone maturation was delayed by 8 years, the growth spurt by 1.4 years, and sexual maturation and menarche by ∼2 years.6 The contemporaneous study in the United States also documented poor growth when compared with United States norms in all sickle cell disease genotypes, especially in individuals with HbSS.7
More than 75% of the estimated 400 000 infants per year born with SCA are born within sub-Saharan Africa.8 Despite this high prevalence, no standard growth curves have been developed for children in Africa who are living with SCA. Moreover, although the standard World Health Organization (WHO) growth curves were derived from healthy pediatric cohorts with a global representation, the cohorts included only a few children in Africa.9 Published growth curves derived from United States7 and Jamaican10 populations of children with SCA may not be relevant for Africa, and clinicians providing care to this population of children would benefit from a more regionally applicable reference for assessing growth trajectories.
To address this gap, we developed childhood growth curves for height, weight, and body mass index (BMI) from longitudinal measurements in a large cohort of children living with SCA in Kilifi, Kenya. These growth curves document significant differences from both the WHO charts and SCA norms derived from children in the Western hemisphere. These new African SCA–specific growth curves provide a clinically relevant reference that will be useful to both health care providers and researchers.
Study design
Patient population
Kilifi County in coastal Kenya has a large pediatric sickle cell clinic. Between January 2003 and December 2021, height and weight pairings were recorded longitudinally at each clinic visit and hospitalization for 864 patients between 6 months and 19 years of age. During this time, all children who attended the clinic received standard-of-care treatments, namely penicillin twice daily until 5 years of age, bed nets and Paludrine for malaria prophylaxis throughout childhood, and folic acid supplementation. Almost all the growth data (98.2%) were collected before 2014 at which time hydroxyurea was introduced to Kilifi through the phase 1/2 REACH trial11; in these analyses, no data were included from children who received hydroxyurea treatment. Height and weight measurements were taken by 2 trained operatives working together. Weights were recorded in kilograms to 1 decimal place using a digital clinical scale (Seca, Hamburg, Germany), and the children’s weights were measured without shoes and with minimal clothing. The lengths of children <2 years of age were measured using a standard length board, and the heights of children ≥2 years of age were measured using a standard drop-down portable stadiometer (Seca); both were recorded in centimeters to 1 decimal place.
Growth analysis
The preliminary analyses of growth data verified that the relationships of height and weight with age did not vary over the year of collection. Data quality was then assessed and confirmed using pairwise plots of height, weight, BMI, and age and using plots of interval growth data within each child. Within each 6-month age period, if a child had 2 or more measurements, a single measurement was selected at random for inclusion in the models to calculate the growth curves. Growth curves were estimated for height, weight, and BMI separately for males and females using the generalized additive model for location, scale and shape (GAMLSS) approach.12,13 In the GAMLSS model, splines were used to model the mean as a function of age; the standard deviation, skewness, and kurtosis were also allowed to vary with age, and random intercepts were used to account for repeated measurements for a child. The fitted models were used to estimate the 3rd, 5th, 10th, 25th, 50th, 75th, 90th, 95th, and 97th percentiles at each age for each growth parameter. The quality of the model fit was evaluated by comparing the observed percentages in bins defined by the percentiles above to the expected numbers and by computing the root-mean-squared error from the discrepancies. Comparisons of the new curves with the WHO growth curves were made by overlaying the matching percentiles for each growth parameter and estimating the median differences in height, weight, and BMI at ages 5, 10, and 15 years.
The study was approved by the Kenya Medical Research Institute Scientific and Ethical Review Unit in Nairobi, Kenya.
Results and discussion
The initial data set included 10 117 observations on 864 youth with confirmed SCA who did not receive hydroxyurea. The age and sex were known for all participants, along with the weight in 99.4% of participants and the height in 97.4% of observations. When limiting the data to 1 measurement per child for each 6-month period, there were 6095 unique height-weight pairs (2875 in females and 3220 in males) from 864 children with SCA with a median of 5 (range, 1-22) sets of measurements per individual.
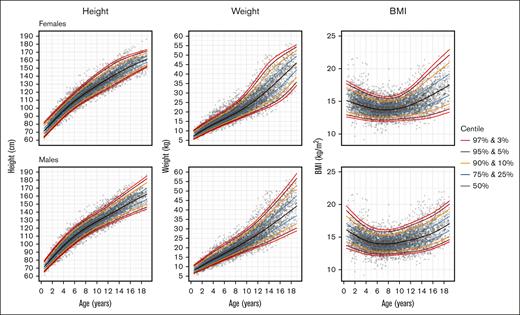
Figure 1 illustrates the estimated growth curves for females and males aged 6 months to 19 years. An expanded set of percentiles is included in the supplemental Material. Figure 2 shows the overlay of the Kilifi SCA growth curves and the WHO pediatric growth curves for height, BMI, and (up to 10 years of age for the WHO curves) weight for females and males. Across the age range, the Kilifi height curves were substantially lower than the WHO curves for all percentiles ranging from 5% to 95% in both sexes. In addition, adult (age ≥18 years) height achievement in the SCA cohort was below the WHO value for males. Similar trajectories were observed for BMI with the biggest discrepancy occurring during the second decade of life. The notable deficits in height and BMI during adolescence may reflect the delayed onset of puberty associated with SCA.
Growth curves from the Kilifi cohort of children with SCA. For females (top graphs) and males (lower graphs), the curves are shown for height, weight, and BMI in percentiles from 3% to 97% as described in “Methods.”
Growth curves from the Kilifi cohort of children with SCA. For females (top graphs) and males (lower graphs), the curves are shown for height, weight, and BMI in percentiles from 3% to 97% as described in “Methods.”
Comparison of the Kilifi SCA growth curves and WHO growth curves. The WHO and Kilifi SCA centiles for height (top row), BMI (middle row) and weight (bottom row) are overlaid, using the same colour for the same centile (eg, 95th) on the two sets of growth curves. For each centile in the range 5%-95%, the Kilifi growth curve is substantially lower than the corresponding WHO growth curve in both males and females. Note that the WHO growth curves for height extend only to 10 years of age.
Comparison of the Kilifi SCA growth curves and WHO growth curves. The WHO and Kilifi SCA centiles for height (top row), BMI (middle row) and weight (bottom row) are overlaid, using the same colour for the same centile (eg, 95th) on the two sets of growth curves. For each centile in the range 5%-95%, the Kilifi growth curve is substantially lower than the corresponding WHO growth curve in both males and females. Note that the WHO growth curves for height extend only to 10 years of age.
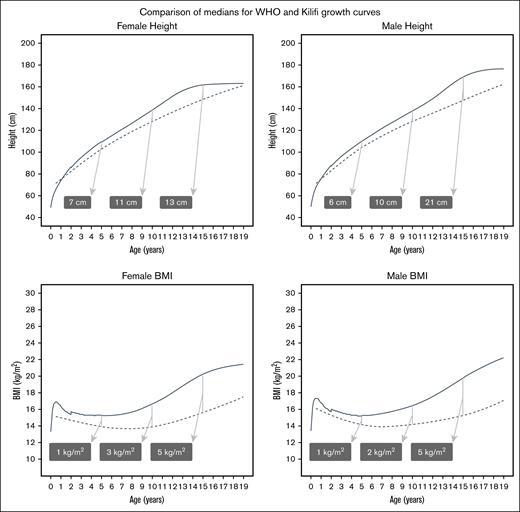
Figure 3 shows that the deficits in median heights for females at ages 5, 10, and 15 years were 7 cm, 11 cm, and 13 cm, respectively. Males had similar deficits at ages 5 and 10 years (6 cm and 10 cm) but had a striking 21 cm deficit at age 15 years. Female median weight deficits at ages 5 and 10 years were 3.4 kg and 9.1 kg; for males, the deficits were 3.0 kg and 7.7 kg at the same ages. For BMI, both females and males had a 5 kg/m2 lower median BMI at age 15 years (Figure 3).
Differences between the median of the Kilifi SCA growth curves and the median of the WHO growth curves. To provide a comparison of the Kilifi growth curves (dashed lines) with the established WHO growth curves (solid lines), the medians (50th percentiles) for female and male height and BMI were overlaid. Differences between the medians increased with age. To illustrate this, the shaded labels show the differences (WHO-SCA, rounded to whole numbers) at 5, 10, and 15 years of age.
Differences between the median of the Kilifi SCA growth curves and the median of the WHO growth curves. To provide a comparison of the Kilifi growth curves (dashed lines) with the established WHO growth curves (solid lines), the medians (50th percentiles) for female and male height and BMI were overlaid. Differences between the medians increased with age. To illustrate this, the shaded labels show the differences (WHO-SCA, rounded to whole numbers) at 5, 10, and 15 years of age.
Growth failure is common in SCA and is likely a multifactorial process. Proposed etiologies include delayed puberty, possibly related to impaired gonadal function,6,14 a high resting metabolic state,15 inadequate nutrition,16 and insufficient hemoglobin.17,18 The growth delay originally reported in children with SCA in Jamaica4-6 and the United States7,17 is worse in children with SCA in sub-Saharan Africa. Other investigators concluded that the WHO growth curves are inappropriate for monitoring SCA growth in Africa and overestimate the degree of growth failure and malnutrition.19,20
The Kilifi age- and sex-specific percentiles of height, weight, and BMI represent, to our knowledge, the largest growth analysis of children with SCA in sub-Saharan Africa. These growth curves document substantial differences from the standard WHO growth curves and, because they provide a more accurate representation than other available growth curves of the population of children with SCA in an African settings, can be used by clinicians and researchers as a new reference tool. A recent analysis in West Africa documented poor growth among those affected by SCA when using the WHO curves for reference.18 These new Kilifi percentiles should be used when investigating the effects of specific comorbidities and clinical complications or poor nutrition on growth trajectories of children with SCA. They are also valuable to study the effects of established or novel disease-modifying therapies on growth.
The most important therapy is hydroxyurea, a potent treatment and standard of care for children with SCA in high-resource settings and the best option to address the global burden of SCA.21 Early concerns about the potential effects of hydroxyurea on growth were not observed in 1- to 2-year prospective studies among infants and children.22,23 Extended hydroxyurea treatment in school-aged children with SCA shows evidence of improved growth with most maintaining their trajectory and even upward crossing of the height and weight percentiles.24 Preliminary analysis of the REACH cohort in 4 sub-Saharan African countries also documents improved growth with hydroxyurea treatment.25
Strengths of this study include the large, representative, and high-quality longitudinal data set and the use of robust statistical methods for estimating percentiles. Weaknesses include the possibility that losses owing to mortality could have led to a shift over time to a healthier cohort, the single site for data collection, and the East African location, which means that the growth curves may not apply equally well to genetically diverse populations across sub-Saharan Africa. This uncertainty could be resolved by the development of growth curves in other geographically and genetically distinct regions. Undoubtedly, the growth of some children would have been affected by infection, malnutrition, and anemia, but the intention of this paper was to describe the growth of a wide range of children, including those with these conditions, and not to estimate the effects of these conditions on growth.
In summary, these standard growth curves that are based on longitudinal historic data illustrate the delayed growth trajectory for children with SCA in Kilifi, Kenya. The differences between the WHO and SCA Kilifi growth curves exemplify the challenge of identifying the correct reference population when evaluating growth in children with SCA in a particular locale. The ideal references would be local normative growth data from children affected and unaffected by SCA, and we encourage the development of such curves throughout the region because of substantial genetic diversity. Until those are available, we provide these data freely as a potentially helpful comparator when evaluating growth in children with SCA in sub-Saharan Africa.
Acknowledgments
The authors acknowledge the patients and their families, and the staff at the Kenya Medical Research Institute (KEMRI)-Wellcome Trust Research Programme and the Kilifi County Referral Hospital for their help with this study.
L.R.S. was supported by training grant K23 HL153763 from the National Heart, Lung, and Blood Institute. R.E.W. was supported by U01 HL133883 from the National Heart, Lung, and Blood Institute and the Cincinnati Children’s Research Foundation. TNW was funded through Senior Research Fellowships (202800 and 091758) from the Wellcome Trust.
The content is solely the responsibility of the authors and does not necessarily represent the official views of the National Institutes of Health.
This article is published with the permission of the Director of KEMRI.
Authorship
Contribution: G.M. and T.N.W. collected the data, designed the study and analysis plan, and edited the manuscript; G.A.T. and T.S.L. designed the analysis plan, analyzed the data, created the growth curves, and edited the manuscript; P.B., L.R.S., and R.E.W. designed the study and analysis plan, analyzed the data, and edited the manuscript; and all authors reviewed and approved the final version of the manuscript.
Conflict-of-interest disclosure: R.E.W. reports receiving hydroxyurea donations from Bristol Myers Squibb and Theravia; receiving research donations from Hemex Health; serving as a medical advisor to Nova Laboratories and Theravia Inc; and serving on a data safety monitoring board for Vaxart Inc. The remaining authors declare no competing financial interests.
Correspondence: George A. Tomlinson, Toronto General Hospital Research Institute, EN-10, 200 Elizabeth St, Toronto, ON M5G 2C4, Canada; email: george.tomlinson@utoronto.ca.
References
Author notes
The source data on which the growth curves were developed and larger tables of percentiles (to allow calculation of z scores from age, height, and weight) are available on request from the corresponding author, George A. Tomlinson (george.tomlinson@utoronto.ca).
The full-text version of this article contains a data supplement.


