Key Points
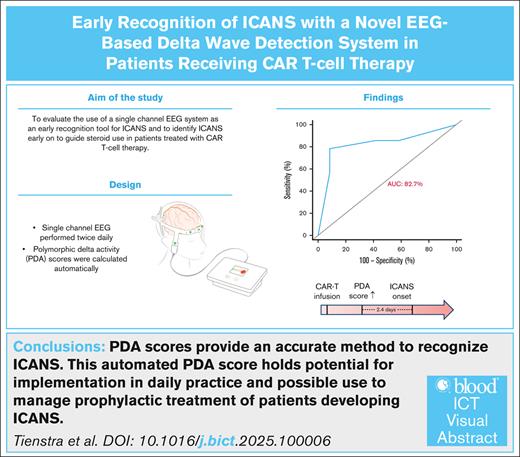
PDA scores can recognize the occurrence of any grade of ICANS early, with an area under the curve of 82.7%.
PDA scores (≥4) can recognize the onset of ICANS a median of 68 hours prior to clinical symptoms.
Visual Abstract
Immune effector cell–associated neurotoxicity syndrome (ICANS) is a potential life-threatening treatment-related adverse event of chimeric antigen receptor (CAR) T-cell therapy. Early recognition of patients at risk of ICANS is crucial, and may guide use of steroids in these patients. Measuring polymorphic delta activity (PDA) may offer an early and reliable recognition for the onset of ICANS. Therefore, a prospective study was performed on adult patients with large B-cell lymphoma or B-cell acute lymphoblastic leukemia treated with CAR T-cell therapy. Before and twice daily after CAR T-cell infusion, patients underwent a single-channel electroencephalogram recording (Fp2-Pz), from which a PDA score (1-5) was automatically generated. Concurrently, ICANS grade was assessed by the treating physician based on the patient’s status, and the immune effector cell encephalopathy score. Twenty-six patients were subjected to analysis, of whom 9 (35%) had a tumor localization within the central nervous system. PDA scores ≥4 showed an excellent discrimination between ICANS (n = 14) and no ICANS (n = 12), with an area under the curve of 82.7%, an accuracy of 84.6%, sensitivity of 78.6%, specificity of 91.7%, positive predictive value of 91.7%, and negative predictive value of 78.6%. Of particular interest, a PDA score ≥4 preceded the clinical manifestation of ICANS with a median lead time of 68.0 hours (interquartile range, 8.0-107.0). PDA scores provide an accurate method to recognize ICANS prior to clinical symptoms, in patients receiving CAR T-cell therapy. This makes it an attractive tool for implementation in daily clinical care, and enables early intervention strategies of patients developing ICANS.
Introduction
CD19-directed chimeric antigen receptor (CAR) T-cell therapy has significantly improved the prognosis of patients with relapsed/refractory large B-cell lymphoma and B-cell acute lymphoblastic leukemia. Despite the clinical benefit, many patients experience early-onset treatment–related toxicities, including cytokine release syndrome (CRS) and immune effector cell–associated neurotoxicity syndrome (ICANS). Depending on the type of CAR T-cell product, up to 60% of patients experience ICANS of any grade, with 21% to 40% developing severe to life-threatening ICANS (grade ≥3), requiring intensive management, including intensive care unit admission and prolonged hospitalization.1-5
So far, many attempts have been made to discover robust early predictors of ICANS, including the presence and severity of CRS, C-reactive protein levels, ferritin levels, lactate dehydrogenase levels, peripheral blood CAR T-cell counts, and the Endothelial Activation and Stress Index (EASIX) score and its derivatives.6-11 However, these prediction tools are limited in their ability to accurately predict ICANS onset hours or even days before clinical manifestation, making early intervention challenging. As a result, treatment is only initiated after manifestation of clinical symptoms, which may require prolonged high-dose corticosteroids to reduce the severity and resolve ICANS. Prophylactic and early use of corticosteroids reduced the incidence and severity of ICANS without compromising efficacy.12,13 Moreover, a lower average corticosteroid dose was required to reduce ICANS severity.13 Nevertheless, patients at low risk are overtreated, and therefore subjected to adverse effects of corticosteroids, including hyperglycemia14 and an increased risk of infections.15
Pathological electroencephalogram (EEG) findings are present in ≤89% of patients with ICANS, including diffuse or focal slowing, frontal intermittent rhythmic delta activity, and even seizure activity, and is therefore considered as a potential predictor of ICANS.16-18 Currently, EEG measurements are only performed after clinical manifestation to exclude epileptic activity. Moreover, performing an EEG recording is time-intensive and, as a result, typically reserved for patients with already severe ICANS, limiting its practicality for routine use in the clinical setting.
To improve feasibility and enable the use of EEG as an early recognition tool for ICANS, a portable, easy-to-use brain state monitor using a single-channel EEG measurement that can be performed within minutes may provide a solution. In this study, we evaluated the use of a single-channel EEG system as an early recognition tool for ICANS, to identify the development of ICANS early on, and guide steroid use in these patients.
Patients and methods
Study design
In this prospective study, all patients treated with commercial CD19-directed CAR T-cell therapy between December 2022 and September 2024 were consecutively included. Patients were eligible if they were aged ≥18 years and received axicabtagene ciloleucel or brexucabtagene autoleucel as a second- or third-line treatment for large B-cell lymphoma or B-cell acute lymphoblastic leukemia.
Single-channel EEG measurements and ICANS scoring
Once before and twice daily after CAR T-cell infusion, patients underwent a single-channel EEG recording using the DeltaScan (Prolira, Utrecht, The Netherlands). In brief, a self-adhesive patch with 3 electrodes, 2 measuring electrodes (Fp2 and Pz) and 1 reference electrode, was placed on the patient’s head by a trained health care professional. To place the patch, first the crown of the head was determined and a hair-free strip of skin was exposed. Next, the skin was cleaned to ensure good electrode contact, and for placing the electrode on the crown Ten20 paste was used to improve adhesion. The first electrode was placed on the crown, and the second electrode was placed at the center of the forehead supplemental Data (supplemental Figure 1). During a 4-minute measurement, the patient kept their eyes closed to ensure a resting state. Next, a polymorphic delta activity (PDA) score with a scale ranging from 1 to 5 was calculated automatically. This is performed without manual EEG segment selection, as this process is time-consuming and prone to high interoperator variability, as previously described in detail.19 In brief, the detection of PDA is based on a proprietary algorithm that included 5 modules, including a preprocessing module, an artefact module, an eye-movement module, a detection of PDA waveshapes module, and the translation of PDA into a likelihood score from 1 to 5. The PDA scores represent the likelihood of acute encephalopathy, and are divided as follows: (1) very unlikely, (2) unlikely, (3) possibly, (4) likely, and (5) very likely. Scores were saved in the patients’ electronic records. Measurements were performed until hospital discharge. Neither health care personnel nor patients were blinded to the measurements.
Concurrently, the presence and severity of ICANS grade was determined daily by the treating physician. ICANS severity was graded based on the 10-point immune effector cell–associated encephalopathy (ICE) score and clinical symptoms, according to the American Society for Transplantation and Cellular Therapy consensus grading for ICANS.20 The ICE was always determined prior to the single-channel EEG recording. Therefore, time differences of <1 hour were considered to correspond to the same measurement.
ICANS treatment
Treatment of ICANS was performed according to institutional guidelines, based on the American Society for Transplantation and Cellular Therapy consensus grading for ICANS,20 and treatment management of the ZUMA 1 cohort 4 study.21 In short, corticosteroid therapy was initiated at grade 1 ICANS, with dosing increased for higher ICANS grades or when symptoms were refractory. At grade 1 ICANS, a single dose of 10 mg dexamethasone was administered; for persistent or severe symptoms, this dose was increased to 10 mg, 2 to 4 times daily. For grade 2 ICANS, patients received 10 mg dexamethasone 4 times daily. In cases of grade 3 ICANS, treatment involved administering 1 g methylprednisolone daily for 3 consecutive days. In steroid-resistant or severe, prolonged ICANS, anakinra was used as second-line agent. Once the patient’s symptoms improved and ICANS started to resolve, corticosteroids were tapered, depending on the patient’s response.
CAR T-cell expansion and cytokine measurements
Patient blood samples were collected on day 7 after CAR T-cell infusion. Whole blood was collected in an EDTA tube (BD Biosciences), and a standard serum separator tube (BD Biosciences). CAR T-cell expansion was measured using flow cytometry, based on a consensus panel of the Immune Monitoring working group of the Dutch Cytometry Society, using the following antibodies: CD3 (clone UCH1, allophycocyanin [APC]-Alexa Fluor 700 [APC-AF750]; Beckman Coulter, Brea, CA), CD4 (clone 13B8.2, PacBlue; Beckman Coulter, Brea, CA), CD8 (clone B9.11, fluorescein isothiocyanate [FITC]; Beckman Coulter, Brea, CA), CD45 (clone J33, Krome Orange [KrO]; Beckman Coulter, Brea, CA), Biotin (clone REA746, phycoerythrin [PE]; Miltenyi Biotec, Bergisch Gladbach, Germany), CD197 (clone G043H7, phycoerythrin-cyanin 7 [PC7]; Beckman Coulter, Brea, CA), and CD45 RO (clone UCH1, APC; Becton Dickinson, Franklin Lakes, NJ). Red blood cells were lysed with ammonium chloride (NH4Cl; 1.0 mM EDTA) for 15 minutes, and washed twice with phosphate-buffered saline/0.5% bovine serum albumin. White blood cells were stained at room temperature with the antibody panel. For CAR T-cell identification, cells were stained with the anti-CD19-CAR detection reagent (Miltenyi Biotec, Bergisch Gladbach, Germany) following the manufacturer’s instructions. Stained cells were resuspended in 200 μL phosphate-buffered saline/0.5% bovine serum albumin, and up to 1 000 000 events were acquired on a 3-laser DxFLEX flow cytometer (Beckman Coulter) depending on the white blood cell count. All measurements were performed within 24 hours after collection. Flow cytometry data were analyzed using Kaluza software (Beckman Coulter, Brea, CA). CAR T-cell expansion was expressed as a percentage of CAR+ T cells within all CD3+ T cells. Cytokine levels were determined in serum or plasma samples. Following centrifugation for 10 minutes at 1500g, samples were collected and stored at −80°C. Cytokine concentrations were determined using Simple Plex cartridges (Bio-Techne, Minneapolis, MN) according to the manufacturer’s instructions. The cartridges were analyzed using the Ella system (Bio-Techne, Minneapolis, MN), and data processing was performed with Simple Plex Runner software (Bio-Techne, Minneapolis, MN). Analyte concentrations were reported in picograms per milliliter.
PSSUQ
User satisfaction among health care professionals who performed the single-channel EEG measurements, primarily nurses, was retrospectively determined using the post-study system usability questionnaire (PSSUQ). This 7-point Likert scale questionnaire had 19 questions to test the users’ perceived satisfaction of the DeltaScan. The questionnaire is divided into 3 sections, including system usefulness, information quality, and interface quality (supplemental Table 1). An overall mean score and standard deviation were calculated, as well as mean scores and standard deviation per subsection. Higher mean scores indicate higher user satisfaction. For practical reasons, the questionnaire was translated to Dutch.
Study end points and definitions
The primary end point was to evaluate the performance metrics of single-channel EEG measurements to predict the occurrence of any grade ICANS. Secondary end points included: (1) the performance of single-channel EEG in predicting grade ≥2 ICANS, (2) the time interval between an elevated PDA score and ICANS onset, (3) the correlation between PDA scores, established predictors, and cytokines associated with ICANS, and (4) the user satisfaction of the single-channel EEG device.
Statistical analysis
Data were summarized using descriptive statistics, counts, proportions, and medians with interquartile ranges (IQRs). The diagnostic performance of the maximum PDA score prior to ICANS onset was assessed using a receiver operating characteristic curve, along with the accuracy, sensitivity, specificity, positive predictive value (PPV), and negative predictive value (NPV). The time difference between an elevated PDA score and ICANS onset was determined by subtracting the date and time of the elevated PDA score from the date and time of ICANS onset. Fisher’s exact test and Mann-Whitney U test were used to test for differences between patients with and without a central nervous system (CNS) localization. Simple linear regression was used to assess the association between the maximum PDA score, and established predictors and cytokines correlated with ICANS. GraphPad Prism v9.0 and R v4.3.1 (R foundation for statistical computing, Vienna, Austria) were used for statistical analysis. Statistical significance was defined as P < .05.
Written informed consent was obtained from all patients. The study protocol was approved by the Medical Ethics Review Board of the University Medical Center Groningen (identifier 202100880) and was conducted in compliance with the Declaration of Helsinki.
Results
Patient, disease, and treatment characteristics
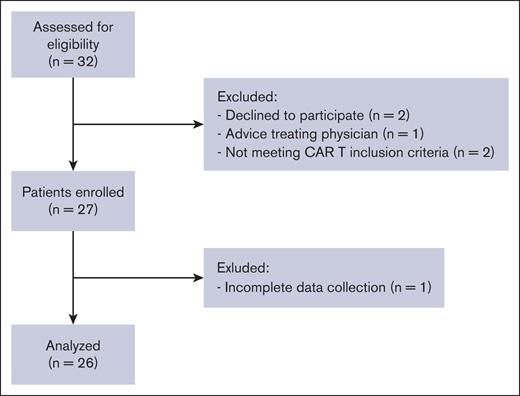
During the study period, 32 patients were screened for inclusion in the study, of whom 27 were enrolled. One patient was excluded from the analysis due to incomplete data collection (Figure 1). Baseline patient and treatment characteristics are summarized in Table 1. In short, the median age was 64 years (range, 29-80), most patients (n = 19, 73%) were male, and were diagnosed with diffuse large B-cell lymphoma (n = 16, 61.5%), stage III to IV (n = 17, 65.4%). Nine patients (35%) had a resolved or active tumor localization within the CNS prior to lymphodepleting chemotherapy. Most patients received axicabtagene ciloleucel treatment (n = 25, 92.3%).
Consort diagram showing the number of participants excluded at each step.
Consort diagram showing the number of participants excluded at each step.
Patient and treatment characteristics
| Characteristics . | All patients (N = 26) . |
|---|---|
| Age, median (range), y | 64 (29-80) |
| Sex, male, n (%) | 19 (73.1) |
| Diagnosis, n (%) | |
| B-ALL | 2 (7.7) |
| DLBCL | 16 (61.5) |
| HGBCL | 2 (7.7) |
| tFL | 6 (23.1) |
| Disease stage at screening, n (%) | |
| Stage I-II | 7 (26.9) |
| Stage III-IV | 17 (65.4) |
| NA | 2 (7.7) |
| Bulky disease at screening, n (%) | |
| No | 20 (76.9) |
| Yes | 5 (19.2) |
| NA | 1 (3.8) |
| Extra nodal sites at screening, n (%) | |
| No | 9 (34.6) |
| Yes | 17 (65.4) |
| Number of extra nodal sites at screening, median (range) | 1 (1-6) |
| CNS localization, n (%) | |
| No | 17 (65.4) |
| Resolved pre-LD | 2 (7.7) |
| Active pre-LD | 7 (26.9) |
| ECOG at screening, n (%) | |
| 0 | 17 (65.4) |
| 1 | 7 (26.9) |
| ≥2 | 2 (7.7) |
| IPI score at screening, n (%) | |
| 0-1 | 8 (30.8) |
| 2 | 7 (26.9) |
| 3 | 3 (11.5) |
| 4-5 | 6 (23.1) |
| NA | 2 (7.7) |
| Previous line of therapy, median (range) | 2 (1-3) |
| Primary refractory to first-line treatment, n (%) | |
| No | 13 (50.0) |
| Yes | 13 (50.0) |
| Primary refractory to second-line treatment, n (%) | |
| No | 10 (38.5) |
| Yes | 16 (61.5) |
| Previous stem cell transplant, n (%) | 11 (42.3) |
| Allogeneic | 2 (7.7) |
| Autologous | 9 (34.6) |
| Response last line of treatment, n (%) | |
| PD | 12 (46.2) |
| SD | 1 (3.8) |
| PR | 1 (3.8) |
| CR | 12 (46.2) |
| Bridging therapy, n (%) | |
| No bridging | 7 (26.9) |
| Radiotherapy | 7 (26.9) |
| Systemic therapy | 5 (19.2) |
| Steroids | 2 (7.7) |
| Combination | 5 (19.2) |
| Response to bridging therapy, n (%) | |
| PD | 9 (34.6) |
| SD | 2 (7.7) |
| PR | 5 (19.2) |
| CR | 3 (11.5) |
| CAR T-cell product, n (%) | |
| Axi-cel | 25 (92.3) |
| Brexu-cel | 2 (7.7) |
| CRP at screening, median (range), mg/L | 6.5 (0.6-78.0) |
| LDH at screening, median (range), U/L | 256.5 (180.0-2024.0) |
| Ferritin at screening, median (range), ng/mL | 660.5 (30.0-1273.0) |
| Missing | 8 |
| EASIX score at screening, median (range) | 1.2 (0.3-22.4) |
| CAR-HEMATOTOX score, median (range) | 2 (1-4) |
| Missing | 6 |
| Comorbidities, n (%) | |
| Atrial fibrillation | 2 (7.7) |
| Atrial flutter | 1 (3.8) |
| Myocardial infarction | 2 (7.7) |
| Melanoma | 2 (7.7) |
| Depression | 1 (3.8) |
| HCT-CI score, n (%) | |
| 0-2 | 24 (92.3) |
| ≥3 | 2 (7.7) |
Axi-cel, axicabtagene ciloleucel; B-ALL, B-cell acute lymphoblastic leukemia; Brexu-cel, brexucabtagene autoleucel; CAR-HEMATOTOX, chimeric antigen receptor T-cell–related hematologic toxicity; CR, complete response; CRP, C-reactive protein; DLBCL, diffuse large B-cell lymphoma; ECOG, Eastern Cooperative Oncology Group; HCT-CI, hematopoietic cell transplant-specific comorbidity index; HGBCL, high-grade large B-cell lymphoma; IPI, integrated pulmonary index; LDH, lactate dehydrogenase; NA, not applicable; PD, progressive disease; PR, partial response; pre-LD, prelymphodepleting chemotherapy; SD, stable disease; tFL, transformed follicular lymphoma.
Following CD19-directed CAR T-cell infusion, CRS of any grade occurred in 24 patients (93.2%), while grade ≥2 CRS was observed in 6 patients (23.1%). Higher grades of CRS were only seen in 1 patient (3.8%; grade 3). The median onset of any grade CRS and grade ≥2 CRS was 3 days (range, 1-8) and 2 days (range, 2-8), respectively, with a median duration of 3 days (range, 1-8). Any grade ICANS was observed in 14 patients (53.8%), with a median time to onset of 5 days (range, 2-11). Grade ≥2 ICANS was observed in 10 patients (38.5%), with a median time to onset of 5.5 days (range, 2-11), and higher grade ICANS was present in 5 patients (19%). ICANS was preceded by CRS in all patients. To restore ICANS, corticosteroids were administered to 13 patients (50.0%) for ICANS management, with a median cumulative dexamethasone dose of 135 mg (range, 10-1338; Table 2).
Clinical characteristics
| Characteristics . | All patients (N = 26) . | Moderate to severe ICANS (n = 10; grade ≥2) . |
|---|---|---|
| CRS | ||
| Any grade, n (%) | 24 (93.2) | 11 (100) |
| Grade ≥2, n (%) | 6 (23.1) | 4 (40.0) |
| Time of CRS onset after infusion, median (range), d | 3 (1-8) | 1 (1-8) |
| Grade ≥2 | 2 (2-8) | 2 (2-8) |
| CRS duration, median (range), d | 3 (1-8) | 3 (1-8) |
| Tocilizumab, n (%) | 9 (34.6) | 6 (60.0) |
| Doses of tocilizumab, median (range) | 1 (1-3) | 1 (1-3) |
| ICANS | ||
| Any grade, n (%) | 14 (53.8) | 10 (100) |
| Time of ICANS onset after infusion, median (range), d | 5 (2-11) | 5.5 (2-11) |
| ICANS duration, median (range), d | 6 (1-15) | 7.5 (2-15) |
| Corticosteroids, n (%) | 13 (50.0) | 9 (90.0) |
| Cumulative dose of dexamethasone∗, median (range), mg | 135 (10-1338) | 170 (30-1338) |
| Anakinra administered, n (%) | 1 (3.8) | 1 (10.0) |
| Hospital stay | ||
| Length of hospital stay, median (range), d | 13.5 (4-38) | 19.5 (4-33) |
| ICU admission, n (%) | 3 (11.5) | 3 (30.0) |
| Hypotension and fever | 1 (33.3) | 1 (33.3) |
| ICANS grade IV | 1 (33.3) | 1 (33.3) |
| Cardiac arrest | 1 (33.3) | 1 (33.3) |
ICU, intensive care unit.
Calculated as the sum of all dexamethasone doses and methylprednisolone doses, and is expressed as the equivalent dose of dexamethasone in milligram.
PDA scores can recognize the onset of ICANS prior to clinical symptoms
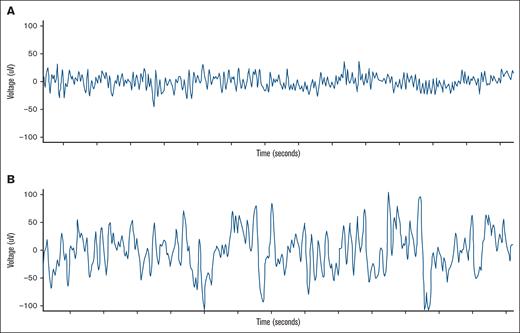
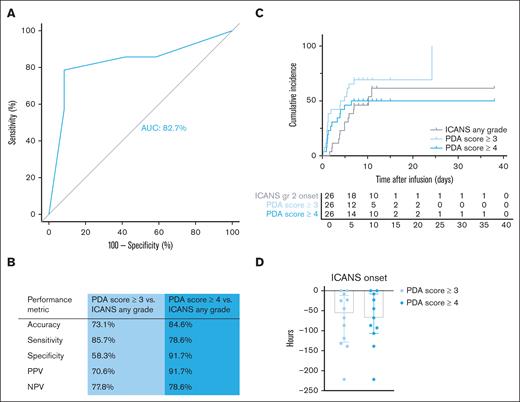
A representative example of a single-channel EEG is shown in Figure 2. Higher PDA scores indicate an increased presence of PDA (score 4) compared with the EEG recorded directly after CAR T-cell infusion (score 1). Prior to CAR T-cell therapy infusion, PDA scores were predominantly within normal range (score 1 or 2; 23/24, 96%; not performed for n = 2). Following CAR T-cell infusion, PDA scores showed an excellent discrimination between any grade ICANS and no ICANS, with an area under the curve (AUC) of 82.7% (Figure 3A). Additionally, PDA scores detected any grade ICANS with an accuracy of 73.1%, sensitivity of 85.7%, specificity of 58.3%, PPV of 70.6%, and NPV of 77.8% for a PDA score ≥3 (n = 19). For a PDA score ≥4 (n = 13), the diagnostic performance was even higher, with an accuracy of 84.6%, sensitivity of 78.6%, specificity of 91.7%, PPV of 91.7%, and NPV of 78.6% (Figure 3B). Moreover, there is a significant association between the maximum ICANS grade and the highest PDA score measured before ICANS onset (R2 = 0.48, P < .0001; supplemental Figure 3).
Example of a single-channel EEG. A normal EEG after infusion of CAR T cells (A), and an EEG 24 hours prior to ICANS (B).
Example of a single-channel EEG. A normal EEG after infusion of CAR T cells (A), and an EEG 24 hours prior to ICANS (B).
The PDA score identifies patients with (any grade) ICANS prior to clinical symptoms. (A) Receiver operating characteristic curve of the prediction of any grade ICANS based on the PDA score. (B) Performance metrics of the PDA score to predict any grade ICANS. (C) Cumulative incidence of any grade ICANS and PDA scores ≥3 and ≥4. (D) Number of hours the PDA score can predict ICANS onset prior to clinical symptoms.
The PDA score identifies patients with (any grade) ICANS prior to clinical symptoms. (A) Receiver operating characteristic curve of the prediction of any grade ICANS based on the PDA score. (B) Performance metrics of the PDA score to predict any grade ICANS. (C) Cumulative incidence of any grade ICANS and PDA scores ≥3 and ≥4. (D) Number of hours the PDA score can predict ICANS onset prior to clinical symptoms.
After infusion, PDA scores increased to ≥3 within a median of 1.3 days (IQR, 1.0-5.1), and ≥4 within a median of 1.8 days (IQR, 1.1-3.9). In addition, an elevated PDA score preceded the clinical manifestation of any grade ICANS (Figure 3C). The median lead time was 56.5 hours (IQR, 11.8-128.8) for a PDA score ≥3, and 68.0 hours (IQR, 8.0-107.0) for a PDA score ≥4 (Figure 3D).
The performance metrics of the PDA score to recognize ICANS grade ≥2 were comparable to any grade ICANS, with an AUC of 73.9% and a median lead time of 87 hours (IQR, 22.5-172.5) for a PDA score ≥3, and 87 hours (IQR, 17.0-153.0) for a PDA score ≥4 (supplemental Figure 2).
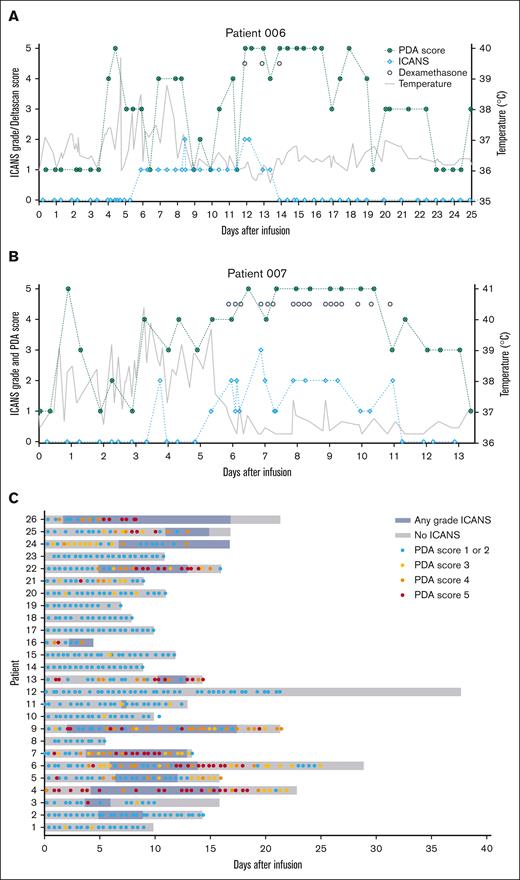
Upon resolution of clinical symptoms of ICANS, PDA scores did not directly normalize. For example, for patient 006 (Figure 4A), PDA scores did not return to baseline, likely due to delirium, which is associated with increased PDA.22 Similarly, in patient 007 (Figure 4B), PDA scores remained elevated for ∼48 hours after clinical symptoms had resolved. Overall, across patients with ICANS, PDA scores normalized later than clinical symptoms, suggesting that PDA requires additional time to fully restore to baseline. At the time of discharge, PDA scores normalized (score 1 or 2) in almost all patients (15/22, 68%; Figure 4; supplemental Table 2).
Patient timeline during hospital admission. Patient 006 (A) and patient 007 (B) with ICANS grade (light blue), PDA score (dark green), temperature (gray), and dexamethasone gifts (black dots). (C) Swimmer plot with a timeline per patient with ICANS presence (blue) and PDA scores (score 1 or 2, light blue; score 3, yellow; score 4, orange; score 5, red).
Patient timeline during hospital admission. Patient 006 (A) and patient 007 (B) with ICANS grade (light blue), PDA score (dark green), temperature (gray), and dexamethasone gifts (black dots). (C) Swimmer plot with a timeline per patient with ICANS presence (blue) and PDA scores (score 1 or 2, light blue; score 3, yellow; score 4, orange; score 5, red).
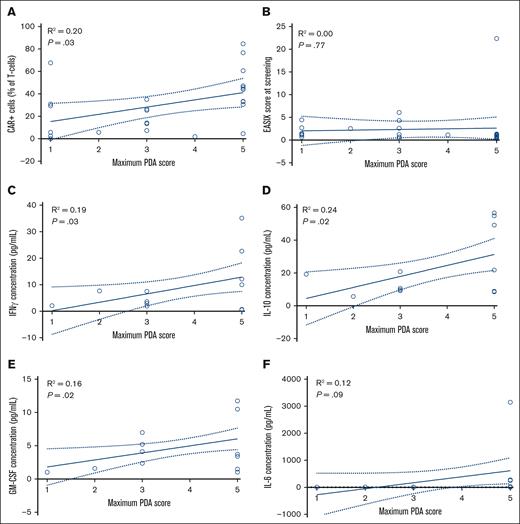
PDA score correlates with most known ICANS predictors and cytokines associated with ICANS. Correlation between the maximum PDA score and percentage of CAR T cells (n = 26; A), EASIX score at screening (n = 26; B), IFN-γ concentration (n = 12; C), IL-10 concentration (n = 12, D), GM-CSF concentration (n = 12; E), and IL-6 concentration (n = 12; F). Percentage of CAR T cells and cytokine measurements were performed at day 7 after infusion.
PDA score correlates with most known ICANS predictors and cytokines associated with ICANS. Correlation between the maximum PDA score and percentage of CAR T cells (n = 26; A), EASIX score at screening (n = 26; B), IFN-γ concentration (n = 12; C), IL-10 concentration (n = 12, D), GM-CSF concentration (n = 12; E), and IL-6 concentration (n = 12; F). Percentage of CAR T cells and cytokine measurements were performed at day 7 after infusion.
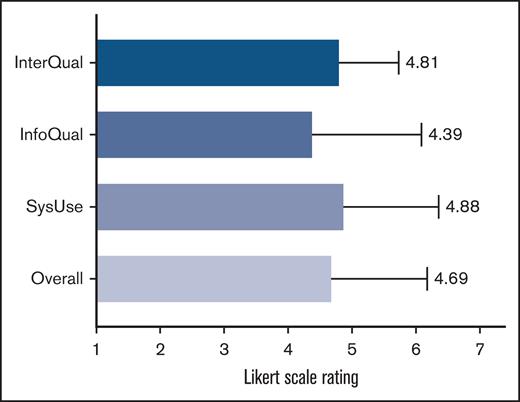
Results of the PSSUQ usability scores for the DeltaScan. Overall user satisfaction of the DeltaScan and the satisfaction divided into 3 sections, including usefulness, information quality, and interface quality. InfoQual, information quality; InterQual, interface quality; SysUse, system usefulness.
Results of the PSSUQ usability scores for the DeltaScan. Overall user satisfaction of the DeltaScan and the satisfaction divided into 3 sections, including usefulness, information quality, and interface quality. InfoQual, information quality; InterQual, interface quality; SysUse, system usefulness.
There was no significant difference in the occurrence of ICANS between patients with and without a CNS localization (relative risk, 2.6; confidence interval, 0.9-9.7; P = .11). These patients also had a normal PDA score (1-2) prior to infusion (7/8, 87.5%; not performed n = 1). Additionally, baseline PDA scores did not differ significantly between these groups (P = .175), there were no significant differences in the median lead times for PDA scores ≥3 (P = .39) and ≥4 (P = .73) to recognize ICANS, and there were no differences in the median PDA score between patients with and without a CNS localization.
Maximum PDA score correlates with known predictors and cytokines associated with ICANS
The maximum PDA score during hospitalization is potentially associated with CAR T-cell expansion (R2 = 0.20; b = 6.4; P = .03), interferon gamma (IFN-γ) levels (R2 = 0.19, b = 3.2, and P = .03), interleukin-10 (IL-10) levels (R2 = 0.24; b = 6.7; P = .02), and granulocyte-macrophage colony-stimulating factor (GM-CSF) levels (R2 = 0.16; b = 1.1; P = .02). However, there was no association between the maximum PDA score and EASIX score at screening (R2 = 0.00; b = 0.2; P = .77), and IL-6 levels (R2 = 0.12; b = 221.7; P = .09) (Figure 5).
Moderate user satisfaction of the single-channel EEG device
Twelve health care professionals, who used the single-channel EEG device, completed the PSSUQ. Overall, the PSSUQ scores indicate moderate user satisfaction, with a score of 4.69 (±1.49). Among the subsections, “information quality” received the lowest satisfaction score of 4.38 (±1.69), while “system usefulness” had the highest satisfaction score of 4.88 (±1.48) (Figure 6).
Discussion
Although toxicity management following CD19-directed CAR T-cell therapy has improved, with the introduction of corticosteroids and other immunosuppressants, CRS and ICANS are still the leading causes of acute morbidity, intensive care unit admissions, and prolonged hospitalization.4,23 In this prospective study, we explored the use of a single-channel EEG that automatically calculates a PDA score to early recognize patients developing ICANS, even before clinical onset. PDA scores showed an excellent discrimination between any grade ICANS and no ICANS, with an AUC of 82.7%, and a high accuracy, sensitivity, specificity, PPV, and NPV. Furthermore, PDA scores ≥4 demonstrated superior performance compared with scores ≥3. Additionally, for any grade ICANS, scores ≥4 could also recognize the onset at an earlier stage.
Although previous studies have described that pathological EEG findings are present in patients with ICANS,16,24,25 our study is, to the best of our knowledge, the first to accurately identify the onset of ICANS prior to clinical manifestation. High PDA scores indicate greater PDA, which has been correlated with an increased likelihood of acute encephalopathy (AUC of 0.86).19,22 Our results indicate that this increase in PDA is also observed in patients treated with CAR T-cell therapy, prior to clinical manifestation of ICANS, and can be used as an early recognition tool. Currently, the ICE score is used as a grading system for ICANS, but has a limited sensitivity in detecting brain dysfunction. This in an area where EEG demonstrates superior diagnostic value. Moreover, because no manual EEG epoch selections are needed, the calculated PDA score can directly be used to guide clinical decision making.
Besides good performance, compared with conventional EEG, a single-channel EEG is less time consuming and demonstrates higher tolerability in patients with ICANS, supporting its suitability for routine daily care. To test this, we used the PSSUQ. This tool provides insight into user experience, and indicated moderate satisfaction. The information quality subsection received the lowest satisfaction score, primarily due to unclear error messages generated by the device. Users reported that these messages were difficult to interpret, and once an error occurred, resolving the issue was not straightforward. To improve future usability, error messages should be made clearer and include guidance on problem resolution.
The association with known predictive biomarkers underscores the potential of PDA scores as a predictive tool. We identified an association between the maximum PDA score and CAR T-cell expansion IL-10, IFN-γ, and GM-CSF levels on day 7 after infusion. The presence of these biomarkers reflects immune activation and cytokine release, as both IL-10 and IFN-γ are immune modulators. IL-10 suppresses antigen presentation and cytokine production by antigen-presenting cells, and increased IL-10 levels are linked to IFN-γ mediated cytotoxicity of CD8+ T cells.11,26,27 GM-CSF, a cytokine involved in myeloid proliferation and activation, is a frequently observed biomarker with a peak in levels after treatment associated with ICANS.11,27,28 In contrast, after treatment, IL-6 levels were not associated with the maximum PDA score. IL-6 is a key marker of CRS,29,30 which typically precedes ICANS; therefore, anti-IL-6R therapy was administered before sampling was performed. Finally, no association was observed between the maximum PDA score and the EASIX score at screening, despite previous reports indicating a correlation between EASIX and ICANS development.8,31 However, to confirm our results, a larger validation cohort is required.
The strengths of our work include the use of an easy-to-use brain state monitor with an automated algorithm, allowing for maximum reproducibility for future research. Moreover, we included patients both with and without ICANS, and performed measurements before, during, and after manifestation of clinical symptoms. Limitations of the study include the limited number of participants and the single-center design, which may lead to a lack of generalizability. Patient satisfaction data were not available, which could have provided additional valuable insights. Moreover, the set-up of the device made it impossible to blind patients and health care providers. This might have had an effect on clinical decision-making; however, ICE scores were determined prior to the single-channel EEG measurement, and corticosteroid administration was solely determined by the treating physician based on institutional guidelines, and never on PDA scores. Furthermore, PDA scores were measured only twice daily, whereas ICE scores were assessed more frequently after onset of clinical symptoms. Consequently, the time interval of elevated PDA scores prior to ICANS may have been underestimated. Lastly, the optimal timing and dosing of corticosteroid administration remains unanswered. Future studies will have to validate this by performing a randomized controlled trial. If confirmed, this easy-to-use brain state monitor that automatically calculates PDA scores holds potential for implementation in daily clinical care, and possible use in early intervention strategies of patients developing ICANS, and may subsequently lower the incidence and severity of ICANS in patients receiving CAR T-cell therapy.
In conclusion, our study provides an accurate method to recognize ICANS onset days prior to clinical symptoms, for patients receiving CAR T-cell therapy.
Acknowledgment
This study received in-kind support from Prolira.
Prolira had no role in the study design, data analysis, data interpretation, or the decision to submit for publication.
Authorship
Contribution: T.v.M. and J.A.v.D. designed the research; M.T., T.N.S., H.T.v.d.G., J.W.d.B., M.T.N., and K.M. contributed to data collection; M.T. and H.A.M.K. contributed to statistical analysis; M.T. wrote the manuscript and analyzed and interpreted the data; T.N.S., H.T.v.d.G., A.G.H.N., and T.v.M. contributed to data analysis and interpretation of the data; and all authors contributed to manuscript writing and review of the manuscript.
Conflict-of-interest disclosure: T.v.M. received research grants from Genentech and Celgene/Bristol Myers Squibb; personal fees from Kite/Gilead and Janssen (advisory boards); and honoraria from Kite/Gilead and Celgene/Bristol Myers Squibb (speaker fees) outside the submitted work. The remaining authors declare no competing financial interests.
Correspondence: Tom van Meerten, Department of Hematology, University Medical Center, University of Groningen, Hanzeplein 1, 9700 RB Groningen, The Netherlands; email: t.van.meerten@umcg.nl.
References
Author notes
Original data are available on request from the corresponding author, Tom van Meerten (t.van.meerten@umcg.nl).
The full-text version of this article contains a data supplement.

