Key Points
Multiple inhibitors, including AT, HC, A2M, and α1-antitrypsin, contribute to thrombin inhibition.
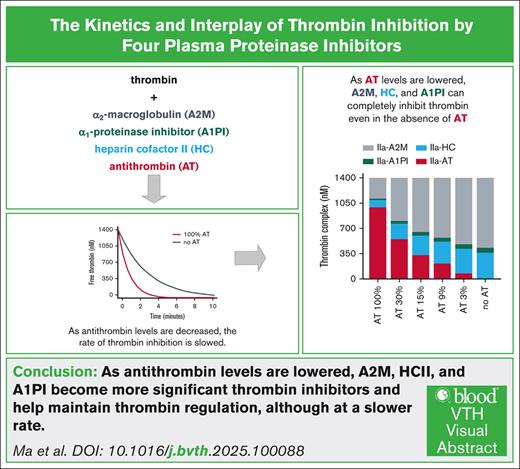
As AT is lowered, the roles of these inhibitors become more significant and can completely inhibit thrombin even in the absence of AT.
Visual Abstract
A novel therapeutic approach for restoring hemostasis in hemophilia is to reduce antithrombin (AT) to rebalance reduced thrombin generation. In plasma, multiple inhibitors including AT, heparin cofactor II (HCII), α2-macroglobulin (A2M), and α1-proteinase inhibitor (A1PI) play a role in thrombin inhibition. The goal was to study the kinetics of thrombin inhibition and the roles of various inhibitors across a broad range of AT levels. Thrombin inhibition was measured at varied concentrations of AT with and without A2M, HCII, and A1PI. Reducing AT to 0 from plasma levels in the presence HCII, A2M, and A1PI, results in slower thrombin inhibition with the time required to inhibit half the thrombin increasing approximately fourfold. Computational models of thrombin inhibition and thrombin generation in hemophilia were constructed and used to analyze thrombin inhibition and the relative contribution of each inhibitor. In a model of thrombin generation, decreased thrombin inhibition resulted in increased peak thrombin and increased area under the thrombin curve. Even at high concentrations of thrombin, all of the thrombin was inhibited with the relative contribution of other inhibitors increasing as AT was decreased. These studies show that in a system without heparin-like glycosaminoglycans, AT is the dominant inhibitor of thrombin, followed by A2M, HCII, and, finally, A1PI. As AT levels decrease, thrombin inhibition is slower, resulting in higher levels of thrombin in a computational model of thrombin generation. Ultimately, the other inhibitors compensate for AT to maintain a level of thrombin regulation.
Introduction
Proteolytic reactions in the coagulation cascade are regulated by multiple plasma inhibitors.1,2 These inhibitors often target >1 coagulation proteinases.1,2 Thrombin is regulated by multiple plasma inhibitors.3-5 Among these inhibitors are the serine proteinase inhibitors antithrombin (AT), heparin cofactor II (HCII), and α1-proteinase inhibitor (A1PI).3,6-10 Thrombin can also be inhibited by the broad-spectrum non–serine proteinase inhibitor α2-macroglobulin (A2M).4,5,11-13 A2M acts through a unique mechanism. Its bait region has cleavage sites for a very wide range of proteinases. Cleavage of the bait region triggers a dramatic structural change that traps the proteinase within the A2M molecule14 (supplemental Figure 1).
To understand the role of a particular thrombin inhibitor, it is necessary to know both the intrinsic activity of that inhibitor toward thrombin and the plasma concentration of the inhibitor. The activity is expressed as the rate at which the inhibitor can react with thrombin (second-order rate constant).15 An inhibitor may have weak inhibitory ability but may nonetheless play an important role because of a high plasma concentration.
A novel strategy for treating hemophilia by rebalancing hemostasis has recently completed phase 3 clinical trials.16,17 This strategy involves reducing the levels of AT with a target of 15% to 35% of the normal plasma levels.18,19 In this report, we have explored how the overall rate of thrombin inhibition is changed as AT levels are lowered in the presence of other inhibitors. We have generated experimental data on thrombin inhibition as AT is decreased from normal levels to 0 in the presence of plasma levels of HCII, A1PI, and A2M. To analyze these data, we used computational models of inhibition.
Methods
Materials
Thrombin, AT, and HCII were purchased from Prolytix (Essex Junction, VT). A1PI was purchased from MyBioSource (San Diego, CA). A2M was purified according to the method of Imber and Pizzo.20 Chromogenic substrate Tos-Gly-Pro-Arg-pNA was purchased from Pentapharm (Aesch, Switzerland). Substrate cleavage was monitored on a Molecular Devices (San Jose, CA) ThermoMax. For all studies, the buffer was 20 mM HEPES (N-2-hydroxyethylpiperazine-N′-2-ethanesulfonic acid; pH 7.4), 150 mM NaCl, 5 mM Ca2+, and 0.02% weight-to-weight ratio polyethylene glycol (Sigma-Aldrich, Saint Louis, MO).
Determination of second-order rate constants
The second-order rate constant was calculated by dividing the measured rate of inhibition by the concentration of the inhibitor.
Thrombin inhibition
Thrombin was incubated either with AT alone or AT with plasma concentrations of the other inhibitors (HCII, A1PI, and A2M). At timed intervals, chromogenic substrate for thrombin was added to give a final concentration of 500 μM. Substrate cleavage was monitored at an absorbance of 405 nm in 12-second intervals for 10 minutes. At each time point, the rate of substrate cleavage was expressed relative to the rate of substrate cleavage in the absence of inhibitors.
Statistical analysis
Uncertainty in the data fits was derived from the covariance of optimized fits to provide the 95% confidence interval and ranges assuming a normal distribution of experimental errors.
Model of thrombin inhibition
Substrate cleavage was modeled as the concentration of free thrombin + (from equation 2).
Computational model of thrombin generation
Thrombin generation was modeled using a modification of the hockin.py module taken from Owen et al24 (https://github.com/mjowen/MathematicalModelsOfCoagulation-AreWeThereYet/).
To model hemophilia, the factor VIII concentration was set to 0. Concentrations and second-order rate constants for HCII, A1PI, and A2M were added to mirror the existing equations for AT inhibition of thrombin and meizothrombin (supplemental Code 3). Integrated thrombin was calculated using the scipy module for the composite trapezoidal rule. Code was run in numerical python using the program Jupyter as a wrapper (supplemental Code 4).25
Results
Thrombin inhibition by individual inhibitors
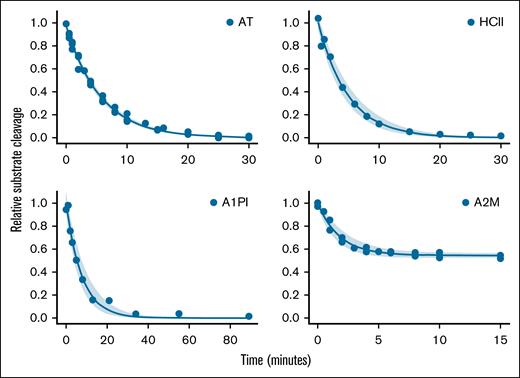
Published values for the second-order rate constants for thrombin inhibition differ by as much as 10-fold.3,6,7,11,26 Thus, we measured the second-order rate constants of the proteins used in this study (Figure 1; Table 1; supplemental Table 1; supplemental Code 1). Note that thrombin complexed with A2M retains the ability to cleave the small molecule chromogenic substrate used in our assays, although at a reduced rate compared with uncomplexed thrombin (supplemental Code 1). This results in a plateau in the A2M inhibition curve at ∼56% residual substrate cleavage (Figure 1, lower right panel).
Calculation of second-order rate constants. Thrombin (10 nM) and inhibitor (AT, 0.3 μM; A1PI, 135 μM; HCII, 1.2 μM; and A2M, 2.4 μM) were incubated. At time points, residual thrombin was measured by addition of a chromogenic thrombin substrate. Note that each plot has a separate time course. The rate of thrombin inhibition was calculated from an exponential decay curve fit to the data (equation 1). As expected, the A2M/IIa complex retains some ability to cleave substrate (equation 2). The shaded area indicates the 95% confidence interval of the fit to the data. The rate measured from each curve fit was divided by the concentration of inhibitor to give the second-order rate constant shown in Table 1. Also shown in Table 1 is the plasma concentration of each inhibitor.
Calculation of second-order rate constants. Thrombin (10 nM) and inhibitor (AT, 0.3 μM; A1PI, 135 μM; HCII, 1.2 μM; and A2M, 2.4 μM) were incubated. At time points, residual thrombin was measured by addition of a chromogenic thrombin substrate. Note that each plot has a separate time course. The rate of thrombin inhibition was calculated from an exponential decay curve fit to the data (equation 1). As expected, the A2M/IIa complex retains some ability to cleave substrate (equation 2). The shaded area indicates the 95% confidence interval of the fit to the data. The rate measured from each curve fit was divided by the concentration of inhibitor to give the second-order rate constant shown in Table 1. Also shown in Table 1 is the plasma concentration of each inhibitor.
Second-order rate constants and plasma concentrations
| Inhibitor . | Second-order rate constant, M–1s–1 . | Plasma concentration, μM . |
|---|---|---|
| AT | 10 000 | 3.5 |
| A2M | 3 900 | 2.4 |
| HCII | 2 700 | 1.2 |
| A1PI | 16 | 32.0 |
| Inhibitor . | Second-order rate constant, M–1s–1 . | Plasma concentration, μM . |
|---|---|---|
| AT | 10 000 | 3.5 |
| A2M | 3 900 | 2.4 |
| HCII | 2 700 | 1.2 |
| A1PI | 16 | 32.0 |
Effect of varied AT on thrombin inhibition
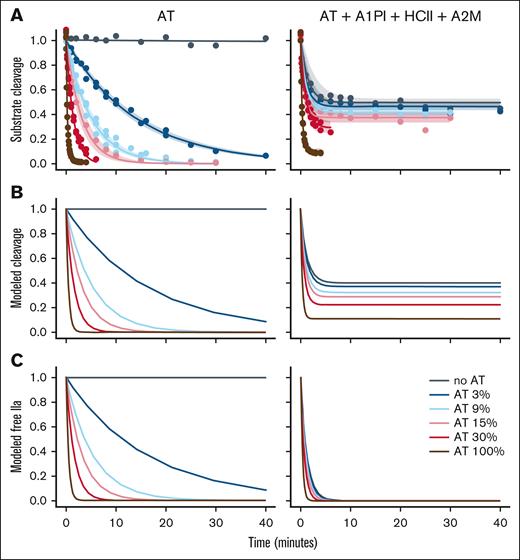
To investigate the interplay of the thrombin inhibitors, inhibition of 4 nM thrombin was studied with either (1) varied AT levels (left side of Figure 2) or (2) varied AT levels in the presence of plasma levels of A2M, HCII, and A1PI (right side of Figure 2). Figure 2A shows the time course of inhibition monitored by substrate cleavage. Thrombin inhibition was modeled using equation 3 and the reactions shown in reaction scheme 1 (supplemental Code 2 showing ODE model). The concentrations of modeled free thrombin and modeled thrombin-A2M complex were used to model substrate cleavage (Figure 2B). The modeled curves show a close match to the experimental data. Note that substrate cleavage is not expected to reach 0 because thrombin in complex with A2M retains its ability to cleave the chromogenic substrate (Figure 1; supplemental Code 1). However, thrombin trapped within A2M is unable to interact with its natural (protein) substrates and is functionally inactive in coagulation.27 Figure 2C models the decrease in free thrombin over time. In the presence of other inhibitors, the time required to inhibit half the thrombin increases from ∼15 seconds at plasma levels of AT to slightly >60 seconds in the complete absence of AT.
Thrombin inhibition without or with other plasma inhibitors. (A) Thrombin (4 nM) was incubated either with the indicated concentration of AT (expressed as a percentage of the plasma concentration of 3500 nM) or with the indicated concentration of AT plus plasma concentrations of A1PI, HCII, and A2M. At time points residual thrombin was measured by addition of a thrombin substrate. The rate of thrombin inhibition was calculated from a decay curve fit to the data. As expected, the thrombin-A2M complex retains some ability to cleave substrate. The shaded area indicates the 95% confidence interval of the fit to the data. (B) Substrate cleavage during thrombin inhibition was modeled as a series of ordinary differential equations (equation 3) using the rate constants determined in Figure 1. The model showed good correlation with the experimental data. (C) The model of substrate cleavage includes the contribution of thrombin bound to A2M. Because the IIa-A2M complex is functionally inactive in coagulation, the contribution of IIa-A2M was removed to give a model of residual free thrombin as a function of time (ie, thrombin not bound to an inhibitor). As expected, in the model with only AT, there was no effect of IIa-A2M.
Thrombin inhibition without or with other plasma inhibitors. (A) Thrombin (4 nM) was incubated either with the indicated concentration of AT (expressed as a percentage of the plasma concentration of 3500 nM) or with the indicated concentration of AT plus plasma concentrations of A1PI, HCII, and A2M. At time points residual thrombin was measured by addition of a thrombin substrate. The rate of thrombin inhibition was calculated from a decay curve fit to the data. As expected, the thrombin-A2M complex retains some ability to cleave substrate. The shaded area indicates the 95% confidence interval of the fit to the data. (B) Substrate cleavage during thrombin inhibition was modeled as a series of ordinary differential equations (equation 3) using the rate constants determined in Figure 1. The model showed good correlation with the experimental data. (C) The model of substrate cleavage includes the contribution of thrombin bound to A2M. Because the IIa-A2M complex is functionally inactive in coagulation, the contribution of IIa-A2M was removed to give a model of residual free thrombin as a function of time (ie, thrombin not bound to an inhibitor). As expected, in the model with only AT, there was no effect of IIa-A2M.
Inhibition of high concentrations of thrombin
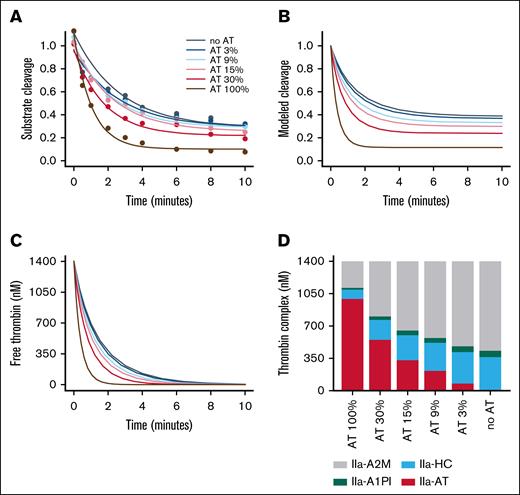
The typical plasma concentration of prothrombin is ∼100 μg/mL (1400 nM).28,29 If converted completely to thrombin, the concentration of thrombin would exceed the concentration of AT when AT is reduced below ∼40%. The ability of these 4 major thrombin inhibitors was studied in the extreme case in which all available prothrombin was converted to thrombin. Experimental data measured the inhibition of 1400 nM thrombin over time with varied AT levels added to plasma levels of A2M, HCII, and A1PI (Figure 3A). Thrombin inhibition was modeled using equation 3 and the reactions shown in reaction scheme 1 (supplemental Code 2). The concentrations of modeled free thrombin and modeled thrombin-A2M complex were used to model substrate cleavage (Figure 3B). The contribution of IIa-A2M was removed to give the modeled free thrombin shown in Figure 3C. The amount of thrombin modeled to be in complex with each inhibitor is shown in Figure 3D. As expected, a decrease in AT results in an increase in the fraction of thrombin inhibited by A2M, HCII, and A1PI instead. With the other inhibitors present, all of the thrombin is eventually inhibited even when the molar concentration of thrombin exceeds the molar concentration of AT.
Thrombin inhibition without or with other plasma inhibitors. (A) Thrombin (1400 nM) was incubated with the indicated concentration of AT (expressed as a percentage of the plasma concentration) plus plasma concentrations of A1PI, HCII, and A2M. At time points, residual thrombin was measured by diluting the sample into a thrombin substrate. As expected, the thrombin-A2M complex retains some ability to cleave substrate. (B) Substrate cleavage was modeled from the thrombin and thrombin-A2M concentrations determined by a series of ordinary differential equations using the rate constants determined in Figure 1 (see supplemental Code 2). (C) The model of substrate cleavage was converted to a model of residual free thrombin (ie, thrombin not bound to an inhibitor). (D) Modeled concentrations of each inhibitor complex at 10 minutes was plotted for each AT concentration.
Thrombin inhibition without or with other plasma inhibitors. (A) Thrombin (1400 nM) was incubated with the indicated concentration of AT (expressed as a percentage of the plasma concentration) plus plasma concentrations of A1PI, HCII, and A2M. At time points, residual thrombin was measured by diluting the sample into a thrombin substrate. As expected, the thrombin-A2M complex retains some ability to cleave substrate. (B) Substrate cleavage was modeled from the thrombin and thrombin-A2M concentrations determined by a series of ordinary differential equations using the rate constants determined in Figure 1 (see supplemental Code 2). (C) The model of substrate cleavage was converted to a model of residual free thrombin (ie, thrombin not bound to an inhibitor). (D) Modeled concentrations of each inhibitor complex at 10 minutes was plotted for each AT concentration.
Effect of varied AT on modeled thrombin generation
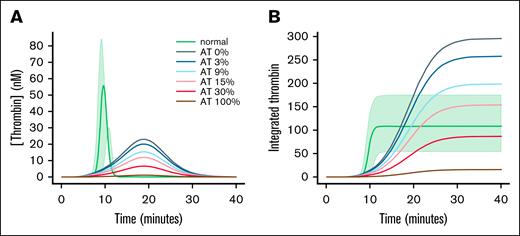
The effect of changes in the rate of thrombin inhibition was studied in a model of thrombin generation. Recently, Owen et al published an examination of a number of current mathematical models of thrombin generation.24 Owen et al24 included python code that implemented the ODE that described the models. The venerable model of Hockin et al was used to study the role of other inhibitors in thrombin generation in hemophilia A.30 To the existing Hockin model, equations for the inhibition of all thrombin species by HCII, A1PI, and A2M were added using the rate constants and plasma concentrations shown in Figure 1 (code provided in the supplemental Code 3 and supplemental Figures 2 and 3). As expected, there was little thrombin generation in the model of hemophilia A (Figure 4A).31-34 Decreasing AT gave increasing thrombin peak (Figure 4A) and an increasing area under the thrombin curve (Figure 4B).
Model of thrombin generation in hemophilia. (A) Thrombin generation was modeled using the parameters of hockin.py modified to include rate constants and concentrations for inhibitors taken from Table 1. Plasma concentrations of factor VIII with 100% AT are indicated with “normal.” The shaded area encompasses the modeled range of thrombin generation values when the inhibitors are collectively set to the extremes of their reference ranges (AT, 86%-128%31; HC, 70%-130%32; A2M, 70%-155%33; and A1PI, 53%-133%34). In hemophilia A, the factor VIII concentration was set to 0. HC, A2M, and A1PI were set to the values shown in Table 1. AT was set to the indicated value. Modeled free thrombin is shown as a function of time. (B) The integrated thrombin was calculated from the free thrombin shown in panel A.
Model of thrombin generation in hemophilia. (A) Thrombin generation was modeled using the parameters of hockin.py modified to include rate constants and concentrations for inhibitors taken from Table 1. Plasma concentrations of factor VIII with 100% AT are indicated with “normal.” The shaded area encompasses the modeled range of thrombin generation values when the inhibitors are collectively set to the extremes of their reference ranges (AT, 86%-128%31; HC, 70%-130%32; A2M, 70%-155%33; and A1PI, 53%-133%34). In hemophilia A, the factor VIII concentration was set to 0. HC, A2M, and A1PI were set to the values shown in Table 1. AT was set to the indicated value. Modeled free thrombin is shown as a function of time. (B) The integrated thrombin was calculated from the free thrombin shown in panel A.
Discussion
This study examines the effects of 4 thrombin inhibitors. The concentrations for each inhibitor are consistent with the plasma concentrations. Antithrombin is varied from its plasma concentration, through the range used for therapeutic reduction in rebalancing therapy in hemophilia, to 0.18 There are several limitations to this study. The reactions studied are in the absence of proteoglycans such as heparan sulfate and dermatan sulfate, which are found in vivo on endothelium. These proteoglycans accelerate thrombin inhibition by AT and HCII.35,36 This study also does not consider “inhibition” of thrombin bound to fibrin. Such thrombin sequestration into a fibrin clot has a procoagulant function that is considered to be important for long-term stabilization and maintenance of clots.37 These studies only consider inhibition of thrombin after it has been formed. This work does not address AT as an inhibitor of the reactions that promote thrombin generation.
As AT levels are decreased, the rate of thrombin inhibition is also decreased. This result is consistent with previous data from patients with low AT levels because of liver disease, which showed that the rate of thrombin inhibition was decreased as AT levels decreased.38 Kremers et al examined thrombin inhibition in AT deficient plasma reconstituted at 40% to 230% of their measured average normal plasma concentration (1.94 μM).4 They also observed that decreasing AT gave decreasing rates of thrombin inhibition.
At normal levels of all of the thrombin inhibitors, AT is the dominant inhibitor in plasma and accounts for three-fourths of the thrombin inhibition. When AT is reduced to 30% levels, AT and A2M each account for just under half of the thrombin inhibition with HCII and A1PI accounting for the remaining inhibition. At 15% AT, A2M accounts for almost twice as much of the thrombin inhibition as does AT. This result is consistent with data from multiple patient populations in which a trend toward reduced thrombin-AT complexes was associated with a trend toward increased thrombin-A2M complexes (appendix of de Laat-Kremers et al5). Even in the complete absence of AT, all of the thrombin was inhibited. This is expected even when all prothrombin is converted to thrombin (1.4 μM). At reduced AT, the concentration of thrombin might exceed the concentration of AT; however, the concentration of thrombin cannot exceed the combined concentrations of HCII (1.2 μM), A2M (2.4 μM), and A1PI (32 μM).
This decrease in the rate of inhibition has dramatic effects on modeled thrombin generation. A decreased rate of inhibition cannot overcome the longer lag phase seen in hemophilia, but peak thrombin increases. The effect of this reduced rate of thrombin inhibition and increased thrombin peak can be seen in the integrated area under the thrombin curve, a measure of how much thrombin is generated and how long that thrombin is available to clot fibrinogen and bind to the fibrin clot. This value is similar to the endogenous thrombin potential (ETP) in a calibrated automated thrombogram (CAT) assay.39 The integrated area increases as the levels of AT are decreased. Tsuchida et al examined thrombin generation in reconstituted AT deficient (but otherwise normal) plasma.39 They showed that peak thrombin increased less than twofold as AT decreased to 0 and the cumulative thrombin production increased fivefold.39 The increase in cumulative thrombin generation in Figure 4B is greater because the baseline level of thrombin is so low.
There are practical consequences to this shift in the pattern of thrombin inhibition. Thrombin generation assays are being used to monitor the effects of reduced AT in patients with hemophilia.40 Because the complex of thrombin and A2M can still cleave a fluorescent substrate, assays such as the CAT that monitor cleavage of substrate will have increased fluorescent signal due to thrombin-A2M. In CAT assays, this increased signal is accounted for by algorithms that remove the effect of thrombin-A2M.41,42 However, in cases of very low AT the increased substrate cleavage can give a high background signal leading to inaccurate estimates of thrombin levels.39,42,43 In some settings all of the substrate is consumed, further complicating the data analysis, particularly calculation of the ETP.42,44
In addition to AT, HCII, A2M, and A1PI can contribute to thrombin inhibition. In plasma with normal levels of AT, AT is the dominant inhibitor with A2M, HCII, and A1PI making smaller contributions to thrombin inhibition. However, at reduced AT levels, these other thrombin inhibitors become the dominant inhibitors and provide a mechanism to maintain regulation of thrombin activity. These findings may be relevant for therapies that reduce AT levels to rebalance hemostasis in people with hemophilia A or B, with or without inhibitors.
Future studies will be done with plasma to directly test the hypothesis that formation of thrombin complexes with HCII and A1PI are increased as AT is reduced. A2M complex formation will also be assessed. Upstream effects of AT reduction on the rate and extent of prothrombin activation on platelets will be probed to assess the role of AT inhibition of factor Xa in the context of the physiologic surface and all of the plasma factor Xa inhibitors.
Acknowledgments
The authors thank Jen-Yea Chang for his advice.
Funding for this study was provided by a research grant from Sanofi to The University of North Carolina.
Authorship
Contribution: A.M. performed the experiments, analyzed the data, and wrote the manuscript; D.M.M. designed and supervised the study, analyzed the data, and wrote the manuscript; and M.H. designed and supervised the study and edited the manuscript.
Conflict-of-interest disclosure: M.H. reports research funding from Takeda and served on advisory boards for Sanofi. The remaining authors declare no competing financial interests.
Correspondence: Dougald M. Monroe, UNC Blood Research Center, 8202B Mary Ellen Jones Building, 116 Manning Dr, Chapel Hill, NC 27599-7035; email: dmonroe@med.unc.edu.
References
Author notes
Code for ordinary differential equation analysis is available in the supplemental File. Modifications to Hockin model of thrombin generation are also available in the supplemental File.
The full-text version of this article contains a data supplement.

