Abstract
Both primary and secondary iron overload are increasingly prevalent in the United States because of immigration from the Far East, increasing transfusion therapy in sickle cell disease, and improved survivorship of hematologic malignancies. This chapter describes the use of historical data, serological measures, and MRI to estimate somatic iron burden. Before chelation therapy, transfusional volume is an accurate method for estimating liver iron burden, whereas transferrin saturation reflects the risk of extrahepatic iron deposition. In chronically transfused patients, trends in serum ferritin are helpful, inexpensive guides to relative changes in somatic iron stores. However, intersubject variability is quite high and ferritin values may change disparately from trends in total body iron load over periods of several years. Liver biopsy was once used to anchor trends in serum ferritin, but it is invasive and plagued by sampling variability. As a result, we recommend annual liver iron concentration measurements by MRI for all patients on chronic transfusion therapy. Furthermore, it is important to measure cardiac T2* by MRI every 6-24 months depending on the clinical risk of cardiac iron deposition. Recent validation data for pancreas and pituitary iron assessments are also presented, but further confirmatory data are suggested before these techniques can be recommended for routine clinical use.
Learning Objectives
To understand how to estimate changes in LIC from transfusional data in unchelated subjects
To learn the strengths and weaknesses of serum metrics of iron stores
To understand how to use liver and heart iron estimates by MRI
Motivation
Iron overload is a common clinical problem, arising from iron hyperabsorption (such as hereditary hemochromatosis or thalassemia intermedia syndromes) or through regular blood transfusion therapy for conditions such as thalassemia, sickle cell disease (SCD) and myelodysplastic syndrome. Survival in iron overload syndromes has increased dramatically in the last decade because of improved access to iron chelation therapy, availability of oral iron chelators, and earlier recognition of life-threatening organ iron deposition.2 This article focuses on techniques for monitoring iron stores, including clinical history, serum markers, and MRI-based approaches, and guidelines for their use.
Estimates of iron intake
In hyperabsorption syndromes such as thalassemia intermedia or hereditary hemochromatosis, the iron absorption rates fluctuate significantly in response to diet, gastrointestinal acidity, and liver iron concentration (LIC), making it nearly impossible to predict rates of iron accumulation from first principles.1 In contrast, secondary iron overload syndromes have well characterized iron intake rates because the iron flux from transfusions can be easily estimated and overwhelms contributions from the diet. In short, the annual iron burden is directly proportional to the volume and average hematocrit of transfused blood as follows:
Where the annual transfusion volume is expressed in milliliters per year and body weight in kilograms.
In the absence of iron chelation, this value can be converted to a predicted change in LIC using the Angelluci relationship3 as follows:
Transfusion rate also affects initial chelator dosing,4 although empiric titration is always necessary because of intersubject variability in chelator efficiency.
Serum ferritin
Despite improved availability of advanced imaging techniques, serum ferritin remains the mostly commonly used metric to monitor iron chelation therapy and remains the sole metric in many countries. Serum ferritin measurements are inexpensive and generally correlate with both total body iron stores and clinical outcomes. However, the biology of circulating ferritin is poorly characterized and many factors affect the relationship between iron overload and serum ferritin levels. In fact, studies in chronically transfused patients consistently demonstrate an r2 between serum ferritin and LIC of only 0.50.5
For any one patient, the predictive value of ferritin is quite poor. Two patients with identical total body iron burdens can have vastly different serum ferritin levels. One major source of systematic bias is transfusional burden. Nontransfused patients have much lower serum ferritin levels for a given iron burden than chronically transfused patients.6 For example, a serum ferritin of 1000 ng/mL represents a significant risk threshold in hereditary hemochromatosis and thalassemia intermedia syndromes,6 but would likely be considered acceptable in a chronically transfused thalassemia or SCD patient.
Other factors that affect serum ferritin levels independent of iron overload are inflammation, liver disease, rapid cell turnover, and ascorbate deficiency.7 Serum ferritin is an acute phase reactant, rising sharply in response to inflammatory stimuli. The liver appears to release a significant fraction of circulating ferritin. Hepatoxic processes cause parallel increases in liver enzymes and serum ferritin. In contrast, ascorbate deficiency appears to lower serum ferritin,8 although the mechanisms aren't fully elucidated. All 3 of these conditions are common in SCD and may contribute to the weaker association between ferritin level and LIC in this population.5
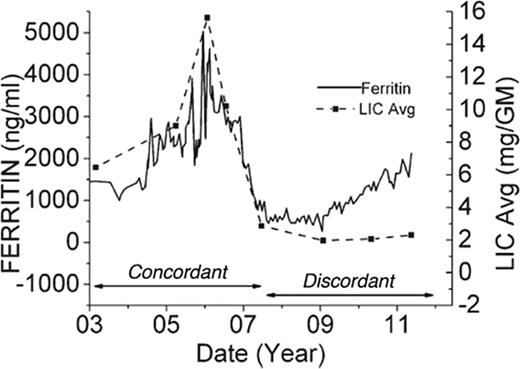
Given interpatient and temporal variability of serum ferritin values, serum ferritin is best checked frequently (every 3-6 weeks) so that running averages can be calculated; this corrects for many of the transient fluctuations related to inflammation and liver damage. Figure 1 depicts long-term trends in serum ferritin compared with regularly recorded LIC by MRI in a single patient. During the first 4 years of monitoring, serum ferritin changes mirror LIC. However, from 2007 to 2011, serum ferritin systematically doubled to nearly 2000, whereas LIC was unchanged at 2.5 mg/g dry weight. In a study of 134 patients followed by MRI for up to 9 years, frank discordance between trends in serum ferritin and LIC occurred in nearly 26% of the intervals evaluated.5 Therefore, although serum ferritin trends can provide more rapid feedback of patient iron status, anchoring of serum ferritin trends to gold standard assessments of iron burden are highly recommended whenever feasible.
Plot illustrating long-term trends in serum ferritin and LIC (estimated by MRI) for a single patient. Results are highly concordant from 2003-2007 and discordant from 2007-2012. (Figure redrawn with permission from Puliyel et al.5 )
Plot illustrating long-term trends in serum ferritin and LIC (estimated by MRI) for a single patient. Results are highly concordant from 2003-2007 and discordant from 2007-2012. (Figure redrawn with permission from Puliyel et al.5 )
Serum markers of labile iron
Iron that is bound to transferrin is not redox active, nor does it produce extrahepatic iron overload. However, once transferrin saturations exceed 85%, non-transferrin-bound iron (NTBI) species begin to circulate, creating a risk for endocrine and cardiac iron accumulation.9 A subset of NTBI can catalyze Fenton reactions and is known as labile plasma iron (LPI). Therefore, transferrin saturation, NTBI, and LPI are potentially attractive serum markers for iron toxicity risk. Transferrin saturation is widely available, but values cannot be interpreted if iron chelator is present in the bloodstream so patients have to be instructed to withhold iron chelation for at least 1 day before measurement. More importantly, the majority of thalassemia patients chronically exist in the high-risk region (saturation >85%) and there is no evidence that the risk of extrahepatic iron increases proportionally to transferrin saturation above this threshold.9 In contrast, most chronically transfused SCD patients have transferrin saturations <85%; values >85% might prompt more aggressive monitoring for extrahepatic iron deposition and complications. Transferrin saturation is also a useful metric in deciding when to initiate iron depletion therapies in nontransfused patients and potentially in transfusion-dependent children who are naive to iron chelation.
Assessment of NTBI requires high-pressure liquid chromatography, limiting its widespread use. LPI can be measured using fluorescent plate readers. However, both assays are incompletely standardized and there is high interlaboratory variation.10 More importantly, values inherently have a short time horizon. For example, presence of a fever will cause labile iron values to plummet. Ingestion of an iron supplement will produce the opposite effect. The pattern of iron chelation is particularly important, with labile iron species emphasizing events of the previous 24-48 hours.11 Although some studies link elevated LPI to cardiac iron accumulation,12 large validation studies are lacking. Therefore, to date, these metrics remain important and interesting research tools, but are not suitable for routine monitoring.
LIC
The liver is the dominant repository for excess iron in the body. Quantitative phlebotomy studies performed in thalassemia patients after BM transplantation also demonstrate that LIC tracks total body iron stores quite closely.3 Severely elevated LIC values (15-20 mg/g dry weight) are associated with expansion of the chelatable iron pool13 and labile plasma iron levels.12 LIC values above this range are also associated with increased liver fibrosis, cardiac iron deposition,13,14 and mortality15 in thalassemia major. As a result, annual liver biopsy was proposed as a routine tool for monitoring iron chelation therapy. Unfortunately, patient acceptance is poor. Sampling error is also quite high and can provide misleading results on serial analysis.16 Differences in tissue processing can also have a profound impact on the results. Therefore, liver biopsy was never fully embraced as a standard of care and newer alternatives have made it obsolete except for histopathology to stage liver disease.
Noninvasive techniques for LIC estimation
Several approaches have been used to quantify liver iron noninvasively. Superconducting quantum interference devices (SQUIDs) use sensitive magnetic coils to estimate the magnetic susceptibility of the liver.17 Although generally accurate and reproducible, there are currently only 4 working devices in the world, making the technique untenable in clinical practice. However, ongoing research to develop cheaper, smaller, room-temperature devices that could be operated in a clinic environment could affect clinicians in the future.
Computed tomography can also be used to quantitate LIC and is quite accurate for high LICs.18 Using modern machines and scanning techniques, radiation exposure is <0.1 mSv, equivalent to a round-trip airline flight in North America. Unfortunately, single energy techniques cannot accurately distinguish mild hepatic iron overload from normal fluctuations in liver attenuation.18 Dual-energy scans compensate for background attenuation and newer dual-beam scanners potentially offer means to overcome this limitation, but these approaches have not been validated.
The undisputed “winner” for noninvasive LIC quantification has been MRI and it can be considered the standard of care where available. Tissue iron is stored as ferritin and its breakdown product, hemosiderin. Both of these compounds are paramagnetic, which means that they become magnetic themselves when placed in a strong magnetic field, similar to iron filings. As a result, MRI signals darken more quickly in regions of increased iron concentration.
In fact, this darkening process can be described by a “half-life,” similar to radioactive decay. The half-life for a spin-echo image is known as T2 and the half-life for a gradient echo is known as T2*. The greater the tissue iron, the smaller the T2 and the T2* become.
One can also report rates of signal decay, R2 or R2*, instead of the half-lives. These rates of signal decay are simply the reciprocals of T2 and T2*, as follows:
T2 and T2* are usually reported in milliseconds and the units of R2 and R2* are Hertz or sec−1, so the factor of 1000 is used for the milliseconds to seconds conversion. R2 and R2* are directly proportional, rather than inversely, proportional to iron. For historical reasons, MRI results in the liver are typically reported as R2 and R2* values19,20 and LIC units, whereas T2 and T2* reporting is more common in the heart.21,22
Validation of MRI LIC measurements
Liver R2 and R2* measurements have been calibrated to liver in multiple studies. Limits of agreement between noninvasive and invasive LIC measurements are ∼±53% for R220 and ∼±45% for R2*.19
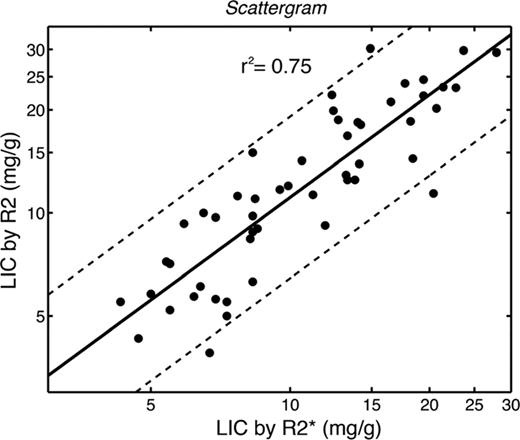
Although it is tempting to attribute all of the variability in MRI LIC measurements to spatial sampling errors in the liver biopsy samples, this is not the case. Liver iron distribution varies across individuals, creating patient-specific deviations in the relationship between R2 or R2* value and the LIC.23 It is entirely analogous to the variable relationship between serum ferritin and LIC, but of much smaller magnitude. Figure 2 demonstrates the agreement between LIC estimated using Ferriscan R2 and using R2* techniques.24 Although the 2 estimators are linearly correlated with one another (r2 = 0.75), there is a small, systematic bias (LIC-R2 is 11% higher than LIC-R2*) and the confidence intervals are quite broad (65%–190%). As a result, LIC by R2 and LIC by R2* cannot be used interchangeably in the same patient.24 However, both techniques have such superb reproducibility that trends between the 2 techniques agree quite well, particularly compared on longer time scales (such as on an annual basis). In fact, simulation data indicate that either approach is superior to liver biopsy for tracking response to iron chelation.25 The choice of which technique to use depends primarily on availability of local expertise to ensure quality control.
Scattergram of LIC by Ferriscan R2 plotted against LIC by R2*. Both axes are logarithmic. LIC predicted by R2 was 11% higher than LIC by R2* and the 95% confidence intervals were quite broad (65%–190%), indicating that these measurements cannot be interchanged. (Figure redrawn with permission from Wood et al.24 )
Scattergram of LIC by Ferriscan R2 plotted against LIC by R2*. Both axes are logarithmic. LIC predicted by R2 was 11% higher than LIC by R2* and the 95% confidence intervals were quite broad (65%–190%), indicating that these measurements cannot be interchanged. (Figure redrawn with permission from Wood et al.24 )
Iron quantification should be performed on 1.5 Tesla magnets whenever possible because the measurements are better validated and more robust. R2 and R2* values increase with magnetic field strength26 and calibration curves must be adjusted for these effects. 3T magnets have advantages when tissue iron levels are low and imaging resolution is imperative, such as for brain or pituitary iron quantitation. However, artifacts are worse at 3T, particularly in the abdomen, and severe hepatic iron loading (>15 or 20 mg/g) cannot be measured.
Limitations of LIC: need to image other organs
Although LIC is a good surrogate for total body iron flux,3,15 the majority of iron toxicities occur in extrahepatic tissues. These iron-sensitive “target” organs have different mechanisms and kinetics of iron uptake/clearance27 than the liver. In particular, endocrine tissue and the heart almost exclusively absorb NTBI species, whereas liver iron uptake is predominantly transferrin mediated.27 As a result, extraheptic organ iron deposition is strongly influenced by the duration of chelator exposure, whereas hepatic iron levels track the total dose of iron chelation administered. High-dose iron chelation taken 3 days per week can be sufficient to balance total body iron burden, but is unlikely to prevent cardiac and endocrine iron deposition. The different iron uptake kinetics between liver and heart causes ferritin and liver iron values to have little predictive value for cardiac iron deposition when evaluated on a cross-sectional basis.21,22 High LICs can place patients at cardiac risk indirectly by increasing circulating NTBI species.12 In these patients, missed chelator doses leave extrahepatic organs exposed to high NTBI. However, some patients have fully saturated transferrin and high NTBI levels even if their LIC is well controlled, leaving them at risk for endocrine and cardiac iron accumulation when chelator is not present.28 The ability of MRI to document preclinical extrahepatic iron deposition has transformed our ability to manage patients safely and has provided insights into the kinetics of iron loading/unloading in different organs28 and chelator access to these different tissue iron pools.
Validation of cardiac iron overload
Because cardiac biopsy is more variable and more dangerous than hepatic biopsy, cardiac T2* had to be validated in animal models29 and autopsy specimens.30 However determination of absolute cardiac iron levels is unnecessary. From a practical perspective, patients may be divided into cohorts using a “stoplight” scheme: green (T2* > 20 ms), yellow (10 ms < T2* < 20 ms) and red (T2* < 10 ms) based upon their risk of arrythmias and cardiac dysfunction.21,31 As a result, a T2* value <10 ms is often used as a “trigger” for aggressive escalation of chelator therapy.32 Cardiac T2* is routinely used to monitor response to iron chelation therapy in high-risk disorders such as beta thalassemia major and Blackfan-Diamond syndrome. Cardiac T2* also serves as an end point for clinical trials of all new iron chelators.
MRI in iron overload disorders other than thalassemia
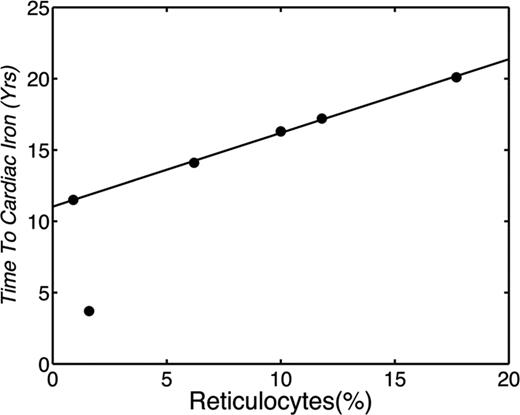
Most of our understanding of iron overload monitoring, complications, and treatment come from studies in beta thalassemia major. Nonetheless, there is expanding monitoring and treatment experience in beta thalassemia intermedia, SCD, myelodysplasia, and other rare anemias.33,34 The risk of cardiac iron overload varies with the degree of effective erythropoiesis, among other factors, being most common in Blackfan-Diamond syndrome33,34 and least common in SCD22,35 and thalassemia intermedia.33,36 Chronically transfused Blackfan-Diamond patients are particularly vulnerable to extrahepatic iron deposition34 and require close monitoring in the first decade of life. In contrast, the prevalence of cardiac iron deposition in chronically transfused SCD patients is only ∼3% and occurs later in life.35 Work to date suggests that cardiac risk is linked to transfusion practices and bone marrow response. Figure 3 demonstrates the time to cardiac iron deposition in 6 SCD patients as a function of reticulocyte count35 ; the greater the reticulocyte count, the greater the exposure to transfusions was required before cardiac iron accumulation occurred. When reticulocyte levels were suppressed to <1%, similar to reticulocyte counts found in thalassemia major patients, cardiac iron accumulation occurred after only 13 years of transfusions; this is similar to the timing of cardiac iron overload described for thalassemia major patients.22
Plot demonstrating the years of chronic transfusion before documentation of cardiac iron plotted against the patient's average reticulocyte count calculated over the preceding 3 years. (Figure redrawn with permission from Meloni et al.35 )
Plot demonstrating the years of chronic transfusion before documentation of cardiac iron plotted against the patient's average reticulocyte count calculated over the preceding 3 years. (Figure redrawn with permission from Meloni et al.35 )
Practical monitoring
Liver iron examinations should be repeated on an annual basis unless there is a clinical indication for more frequent assessment, such as the use of intensive chelation strategies.32 With appropriate distraction techniques (such as video goggles), children as young as 4 or 5 years of age may be studied without sedation.37 Cardiac iron assessments require more patient cooperation and may be safely deferred until the patient is able to cooperate (6-10 years of age) in standard-risk patients.32 However, Blackfan-Diamond patients should undergo cardiac T2* assessments after 2 years of chronic transfusion therapy even if anesthesia is required. Thereafter, cardiac T2* studies are recommended at 24-, 12-, and 6-month intervals for low-, standard-, and high-risk patients, respectively.32 Classification of low, standard, and high risk is based upon many factors, including degree of effective and ineffective erythropoeisis, hemolytic rate, genotype, transfusion rate, known adherence with chelation, and previous MRI results of the liver, heart, and pancreas (if available). Therefore, no simple risk stratification exists and clinical judgment is required.
Iron in other organs
Pancreas R2* measurements can readily be obtained using the same approach as for liver R2*. Although currently not being used in routine clinical practice, pancreas R2* values offer complementary information to liver and heart iron estimates.38 Because the pancreas takes up similar iron species as the heart, but earlier, it serves as an early and robust marker of prospective cardiac risk. A “clean” pancreas has nearly 100% negative predictive value for cardiac iron deposition,35,38 and our laboratory has used this relationship to eliminate cardiac T2* scanning in >1/2 of our patients.
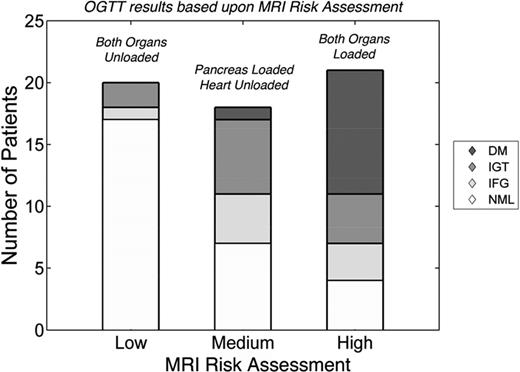
Pancreas R2* also predicts glucose intolerance and diabetes independent of cardiac T2*.39 Figure 4 summarizes the relationship between MRI risk assessment and oral glucose tolerance test (OGTT) results. In this example, if neither the pancreas nor the heart had iron (low risk), 15% of patients had abnormal OGTT and no patient had diabetes. When the pancreas R2* was >100 Hz, but the heart T2* remained normal (medium risk), a little more than 50% of patients had abnormal OGTT, including diabetes. In patients in whom cardiac T2* had decreased <20 ms (indicating longstanding pancreas iron loading), nearly 80% had abnormal OGTT, including 40% with overt diabetes mellitus. Therefore, isolated pancreas iron deposition stratifies the risk of glucose dysregulation and better identifies preclinical disease. Although promising, pancreas R2* assessment and its functional consequences require multicenter validation before routine clinical use.
Risk of abnormal OGTT as a function of MRI risk. MRI risk was considered low if both the heart and pancreas had no significant iron overload. Isolated pancreas iron loading (R2* >100 Hz) represented medium risk. Cardiac iron loading (T2* <20 ms) represents high risk; no patient had isolated cardiac iron loading. OGTT results were graded according to American Diabetes Association Standards and were coded as normal (NML), impaired fasting glucose (IFG), impaired glucose tolerance (IGT), and diabetes mellitus (DM). The prevalence and severity of glucose abnormalities increased with MRI risk. (Figure redrawn with permission from Noetzli et al.39 )
Risk of abnormal OGTT as a function of MRI risk. MRI risk was considered low if both the heart and pancreas had no significant iron overload. Isolated pancreas iron loading (R2* >100 Hz) represented medium risk. Cardiac iron loading (T2* <20 ms) represents high risk; no patient had isolated cardiac iron loading. OGTT results were graded according to American Diabetes Association Standards and were coded as normal (NML), impaired fasting glucose (IFG), impaired glucose tolerance (IGT), and diabetes mellitus (DM). The prevalence and severity of glucose abnormalities increased with MRI risk. (Figure redrawn with permission from Noetzli et al.39 )
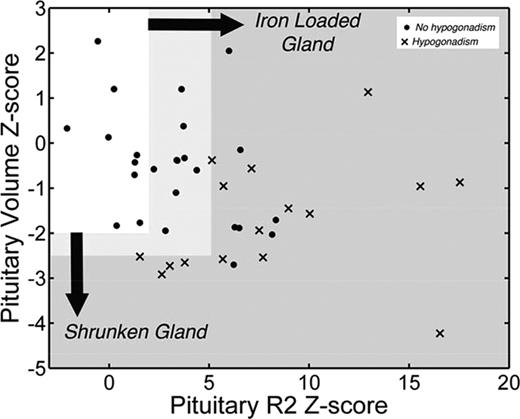
Similar arguments can be raised for pituitary iron assessment. The pituitary gland is easily injured and damage can be difficult to detect until puberty. Hypogonadism occurs in ∼1/2 of thalassemia major patients, with long-term consequences for fertility, bone density, and quality of life.40 Hypogonadism rates are lower in cohorts having better access to iron chelation, particularly oral chelators, but secondary hypogonadism and impaired fertility remain a major issue. Preclinical pituitary iron deposition can be detected using R2 techniques,41 whereas severe iron deposition is associated with decreased response to gonatropin-releasing hormone challenge and clinical hypogonadism.41 Shrinkage of the pituitary gland is associated with more significant, irreversible loss of gonadotrophic production41 ; Figure 5 summarizes the relationship. Pituitary volume and pituitary iron both change with age and need to be converted to Z-scores using nomograms.37 Both heavy iron deposition (Z-scores >5) and volume loss (Z-scores <−2.5) are associated with hypogonadism. However, there is a broad range of moderate iron deposition (2 < Z < 5) and 50% of patients with heavy iron deposition are symptom free, similar to the relationships observed in the heart. Although restoration of gonadal function can be achieved in some patients with intensive chelation,42 Figure 5 suggests the gland shrinkage is specific for hypogonadism and may be a marker of irreversibility. Further studies are ongoing.
Scattergram of pituitary volume versus pituitary iron. Because normal values are age dependent, results are displayed as Z-scores according to published nomograms.37 Normal pituitary iron and size (Z ≤ 2) is represented by the clear box. Solid dots represent patients with normal gonadal function, clinically, and X's represent patients with clinical hypogonadism. (Figure redrawn with permission from Noetzli et al.41 )
Scattergram of pituitary volume versus pituitary iron. Because normal values are age dependent, results are displayed as Z-scores according to published nomograms.37 Normal pituitary iron and size (Z ≤ 2) is represented by the clear box. Solid dots represent patients with normal gonadal function, clinically, and X's represent patients with clinical hypogonadism. (Figure redrawn with permission from Noetzli et al.41 )
Conclusion
Serum markers of somatic stores (ferritin and transferrin saturation) are useful surrogates for total iron stores and extrahepatic risk, respectively. However, they cannot replace LIC or cardiac T2* assessment for monitoring chelator efficacy or stratifying end organ risk. Annual MRI assessment of liver and heart has become the de facto standard of care in chronically transfused patients. R2 and R2* techniques can both be used with clinical accuracy in the liver when good quality control is performed, whereas T2* analysis is standard for the heart. Pancreas R2* and pituitary R2 correlate with glandular function and provide additional metrics of non-transferrin-bound iron control. However, more validation work is necessary before measures of pancreatic and pituitary iron burden can be considered standard of care.
Disclosures
Conflict-of-interest disclosure: The author is on the board of directors or an advisory committee for Apopharma, has received research funding from Shire, and has consulted for BioMed Informatics and Shire. Off-label drug use: None disclosed.
Correspondence
John C. Wood, MD, PhD, Division of Cardiology, Children's Hospital of Los Angeles, 4650 Sunset Boulevard, MS #34, Los Angeles, CA 90027; Phone: (323)361-5470; Fax: (323)361-7317; e-mail: jwood@chla.usc.edu.


