Key Points
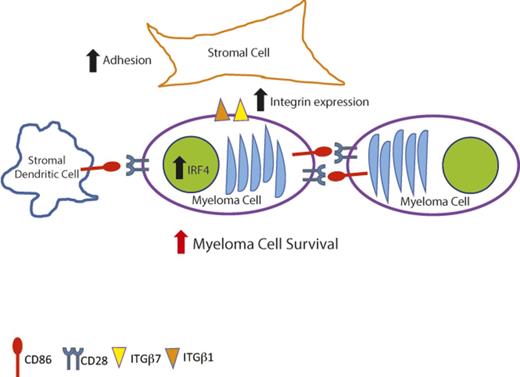
CD86 mediates myeloma survival via activity from its cytoplasmic tail and the CD28-CD86 interaction facilitates stromal independence.
Blocking the CD28-CD86 pathway is a promising therapeutic avenue for myeloma, as there are already approved agents that target this pathway.
Abstract
Although prognosis for patients with multiple myeloma has improved over the past decade, research toward discovery of new therapeutic avenues is important and could lead to a cure for this plasma cell malignancy. Here we show that blocking the CD28-CD86 pathway via silencing of either CD28 or CD86 leads to myeloma cell death. Inhibiting this pathway leads to downregulation of integrins and IRF4, a known myeloma survival factor. Our data also indicate that CD86, the canonical ligand in this pathway, has prosurvival activity that is dependent on its cytosolic domain. These findings indicate that targeting of this pathway is a promising therapeutic avenue for myeloma, because it leads to modulation of different processes important in cell viability.
Introduction
Multiple myeloma is a malignancy of long-lived plasma cells and is the second most common hematologic malignancy. Although recent therapeutic advances have led to an increase in overall survival (OS) rates, most patients will eventually die as a result of drug-resistant disease.1,2 Because myeloma cells retain much of the physiological characteristics of their normal counterparts, bone marrow plasma cell, further understanding of the survival mechanisms of plasma cells is important and could lead to knowledge that will help in developing agents to potentially cure myeloma.3
Recently, it was shown that long-lived bone marrow plasma cells require CD28 signaling for their generation and survival.4 The signals downstream of CD28 activation have been thoroughly investigated in T cells; however, the downstream mediators in plasma cells are only beginning to be characterized.5-7 CD28 is expressed in the subset of bone marrow cells to which the most long-lived fraction of human plasma cells belong8 and has been reported to be a poor prognostic indicator for patients with myeloma. It is highly expressed at diagnosis in patients with MAF translocations, and expression correlates with disease progression.9-11 We previously showed that CD28 activation can protect myeloma cells against cell death induced by different death stimuli, including different chemotherapeutic agents.12,13 Thus, this pathway may be a feasible therapeutic avenue in myeloma, especially because US Food and Drug Administration–approved agents that target and block CD28-CD86 interactions (CTLA-4–immunoglobulin) exist and are being used to treat autoimmune disorders14,15 and to facilitate transplant acceptance.16,17
Most CD28+ myeloma cells also express its ligand, CD86, and like CD28, CD86 has also been reported to be a poor prognostic indicator for patients with myeloma.18 Little is known about what happens downstream of CD86 ligation, although recent work has shed some light on the matter, particularly in terms of B-cell function and activation in mice.19-25 Therefore, we investigated the role of CD86 in human myeloma cells.
Materials and methods
Cell lines
Cell lines used in these studies are described in supplemental Table 1 and were cultured as previously described.26
Patient sample processing
All samples were collected following an Emory University Institutional Review Board–approved protocol. Samples were collected from patients who were already scheduled to undergo the procedure (bone marrow aspiration) and provided consent to allow for additional material to be collected for research purposes. Samples were deidentified before they were provided to the laboratory. Mononuclear cells from bone marrow aspirates from patients with myeloma were collected as previously described.26
Lentiviral shRNA preparation and transduction
Short hairpin RNA (shRNA) clones were obtained from Open Biosystems and Sigma Aldrich. Clones used are listed in supplemental Table 2. Viral particles were prepared and myeloma cells were infected as previously described.13
Flow cytometry and analysis
Cell-surface expression of CD28, CD86, ITGB7, and ITGB1 (catalog numbers listed in supplemental Table 3) was measured via flow cytometry. Live cells (100 000) were collected, washed with 1× phosphate-buffered saline, and stained with appropriate antibodies in 100 µL 1× annexin staining buffer. After incubation (15 minutes) at 4°C in the dark, cells were washed in 1× phosphate-buffered saline, resuspended in 400 µL annexin staining buffer containing 1 µL of annexin V. Samples were collected in a BD FACSCanto II. Analysis of flow cytometry data was performed using FlowJo.
RNA extraction, complementary DNA synthesis, and qRT-PCR
RNA was extracted and quantitative reverse transcription polymerase chain reaction (qRT-PCR) was performed as previously described.26 All data are functions of relative quantity compared with pLKO.1 empty vector control. Glyceraldehyde-3-phosphate dehydrogenase and β-actin were used as endogenous control genes. qRT-PCR probes are from Applied Biosystems and are listed in supplemental Table 4.
Protein extraction and western blotting
Cell pellets were lysed in radioimmunoprecipitation assay buffer with protease and phosphatase inhibitors as previously described.26 Lysates were quantified using the bicinchoninic acid assay, and 15 to 30 µg of lysate were run in sodium dodecyl sulfate–polyacrylamide gel electrophoresis gels, then blotted as previously described.26 Antibodies used for detection are listed in supplemental Table 3.
RNA preparation for RNA-seq analysis
RNA was isolated using the Qiagen RNEasy Kit as described and quality control tested at the Emory Integrated Genomics Core, and 1 µg was sent to Hudson α for RNA sequencing (RNA-seq) library construction using the Illumina TruSeq messenger RNA (mRNA) protocol. RNA-seq libraries were sequenced using 50-bp paired-end reads on an Illumina Hi-sequation 2500 to a depth of approximately 25 × 106 paired-end reads.
Alignment and quantification of RNA-seq data, and differential and bioinformatic analyses of RNA-seq data
Please refer to supplemental Methods for detailed description of RNA-seq analyses.
Cell adhesion assays
Please refer to the supplemental Methods for detailed description of cell adhesion assay methodology.
Statistical analysis
Statistical significance was assessed using two-tailed Student t test using GraphPad Prism.
Results
CD28 and CD86 expression influence patient outcomes
Previous studies demonstrated that individually, CD28 and CD86 expression correlates with poor prognosis.9,18 Using data from University of Arkansas for Medical Sciences, we previously showed that the high-risk MF (MAF) subtype of myeloma expressed high levels of CD2811 and found similar results with CD86 (supplemental Figure 1A), indicating that high expression of these molecules is associated with a form of high-risk disease. We confirmed these findings using data from CoMMpass (Clinical Outcomes in Multiple Myeloma to Personal Assessment; supplemental Figure 1B). CoMMpass is a prospective study that follows 1000 newly diagnosed patients with myeloma, linking clinical, genomic, and transcriptomic data.
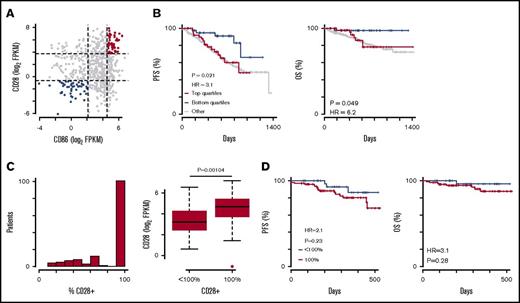
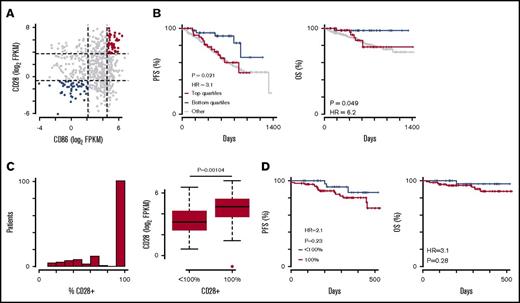
We next determined if CD28 or CD86 expression alone influenced patient outcome. In contrast with previous reports, we found that high expression of CD28 or CD86 alone did not affect progression-free survival (PFS) or OS (data not shown). We next evaluated if combined expression of CD28 and CD86 was prognostic of outcome. Patients who were in the top quartile of both CD28 and CD86 expression (n = 53 of 645) were compared with those in the bottom quartile (n = 47 of 645; Figure 1A). Significant differences between these 2 groups were observed in both PFS and OS (Figure 1B), suggesting that the combination of CD28 and CD86 expression on myeloma cells significantly affects patient prognosis. However, these differences were due to patients in the bottom quartile (Figure 1B) having a better prognosis compared with the rest of the patient cohort, indicating that low expression of both CD28 and CD86 positively affects patient outcome. We compared data generated from CoMMpass with similar data from analyses performed using the Arkansas patient database (supplemental Figure 1C-D) and found a similar trend, showing that patients whose myeloma cells expressed low levels of both CD28 and CD86 had better OS than the rest of the patient cohort. Although these data demonstrate that expression of high levels of both CD28 and CD86 is associated with a worse outcome than expression of low levels, they are not consistent with CD28 and CD86 being markers of high-risk disease.
CD28 and CD86 expression influences patient outcomes. (A) Plot of CD28 vs CD86 expression in patients enrolled in CoMMpass. Vertical and horizontal dashed lines represent the 25th and 75th percentiles. (B) Kaplan-Meier survival curves for patients in the top (red) and bottom (blue) CD28 and CD86 expression quartiles and all other patients (gray) in the CoMMpass study. Both PFS (left) and OS (right) are shown. (C) Histogram of percentage of myeloma cells positive for CD28 by flow cytometry data from 141 patients (left) and boxplot of CD28 mRNA expression for patients with myelomas that are <100% CD28+ and those that are 100% CD28+ (right). (D) PFS (left) and OS (right) for 141 patients with both CD28 flow cytometry and outcome data in the CoMMpass study. FPKM, fragments per kilobase of transcript per million reads mapped; HR, hazard ratio.
CD28 and CD86 expression influences patient outcomes. (A) Plot of CD28 vs CD86 expression in patients enrolled in CoMMpass. Vertical and horizontal dashed lines represent the 25th and 75th percentiles. (B) Kaplan-Meier survival curves for patients in the top (red) and bottom (blue) CD28 and CD86 expression quartiles and all other patients (gray) in the CoMMpass study. Both PFS (left) and OS (right) are shown. (C) Histogram of percentage of myeloma cells positive for CD28 by flow cytometry data from 141 patients (left) and boxplot of CD28 mRNA expression for patients with myelomas that are <100% CD28+ and those that are 100% CD28+ (right). (D) PFS (left) and OS (right) for 141 patients with both CD28 flow cytometry and outcome data in the CoMMpass study. FPKM, fragments per kilobase of transcript per million reads mapped; HR, hazard ratio.
Previous analyses demonstrating a prognostic role for CD28 and CD86 were generated from cell-surface expression as measured by flow cytometry, whereas our current study used RNA-seq data. Therefore, we compared values obtained via sequencing (RNA-seq) with available data from flow cytometry. CD86 cell-surface expression was not determined in CoMMpass; however, data were available for CD28. We analyzed 141 patient samples where CD28 staining had been performed and found 101 (71%) of 141 were samples wherein 100% of the myeloma cells were characterized to be CD28+ (Figure 1C). We compared CD28 mRNA expression in this group (100% CD28+) with that in the rest of the patients for whom we had myeloma cell-surface CD28 expression data available (<100% CD28+) and found that surface expression correlated with higher mRNA levels (Figure 1C). We then compared PFS and OS between these 2 groups and found that no statistically significant differences; however, those with low CD28 expression again seemed to have slightly better prognoses (Figure 1D). Taken together, data from CoMMpass show that low expression of CD28 and CD86 provides a clinical advantage to patients with myeloma, and therefore, CD28 and CD86 may contribute to outcomes in patients with myeloma.
Blockade of CD86 expression leads to myeloma cell death
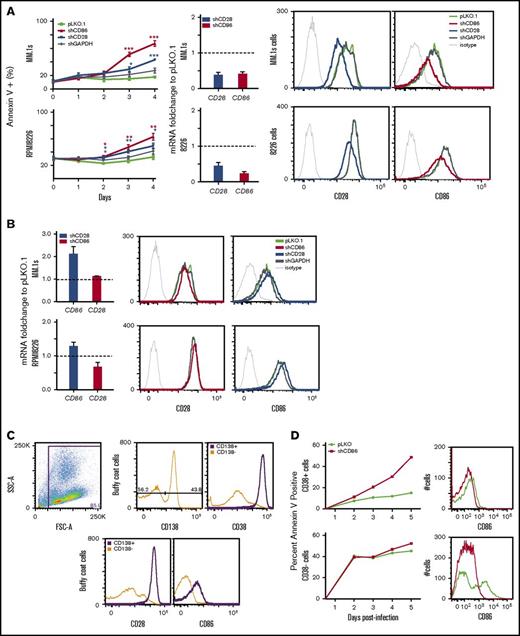
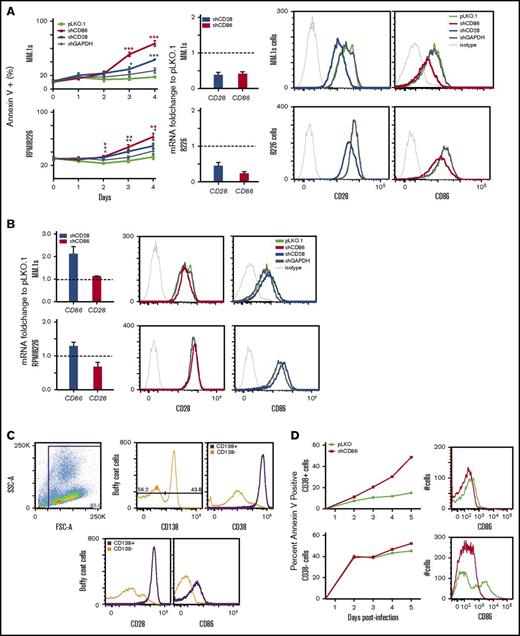
We previously demonstrated that silencing of CD28 resulted in significant cell death in the RPMI8226 (8226) myeloma cell line.13 We extended these findings using additional myeloma cell lines and determined the effects of CD86 silencing. We found that silencing of CD28 resulted in significant levels of cell death compared with empty vector controls in 2 of the 3 additional CD28+/CD86+ lines tested (Figure 2A; supplemental Figure 2A-B). Silencing of CD86 also resulted in significant cell death in 4 of 4 CD28+/CD86+ cell lines tested. Cell death in 3 of 4 (MM.1s, 8226, H929) lines was greater with CD86 silencing than with CD28 (Figure 2A; supplemental Figure 2A-B). Additionally, in both 8226 and MM.1s cell lines, CD86 expression was increased when CD28 was silenced both at protein (Figure 2B; supplemental Figure 3) and mRNA levels (Figure 2B). Similar results were observed with independent shRNAs against both CD28 and CD86 (supplemental Figure 2C); however, no death was observed in these short-term assays when glyceraldehyde-3-phosphate dehydrogenase was silenced, indicating that the effects are not nonspecific (Figure 2A; supplemental Figure 2A-B). Finally, silencing of CD28 or CD86 had no effect in the CD28− cell line, KMS12BM (supplemental Figure 2B). Taken together, these data suggest that myeloma cells that express both CD28 and CD86 are dependent on CD28-CD86 signaling for survival. Moreover, signaling through this pathway may be self-regulated, where CD28 signaling is a negative regulator for CD86 expression.
Silencing or blockade of CD86 results in myeloma cell death. (A) Myeloma cell lines were infected with lentiviral particles carrying empty vector (pLKO.1) or the individual shRNAs, and cell death was monitored by annexin V–fluorescein isothiocyanate staining for 4 days. Data for different time points were all compared with pLKO.1 controls (left). mRNA quantification as measured via qRT-PCR comparing levels of CD28 or CD86 to vector-controls (middle). Representative histograms show CD28 or CD86 surface levels at day 4 postinfection. Thin gray histograms at left are isotype controls (right). (B) mRNA quantification as measured via qRT-PCR comparing levels of CD28 or CD86 with vector controls (left). Representative histograms show CD28 or CD86 surface expression at day 4 postinfection. Thin gray histograms at left are isotype controls (right). (A-B) All data are presented as mean ± standard error of the mean (SEM) of at least 3 independent experiments. *P < .05, **P < .01, ***P < .005. All qRT-PCR data are normalized to β-actin as an endogenous control and then compared relative to mRNA levels in pLKO.1 empty vector control. RNA was extracted on day 3 postinfection. For flow cytometry data, histograms are representative of the annexin V− set in the population. (C) Gating strategy for cells from the buffy coat from a bone marrow aspirate of a patient with myeloma. Total cells were separated into CD138+ (purple) vs CD138− (orange). Histograms show that CD138+ cells are also CD38− CD28− CD86+. (D) Cells from the buffy coat from the same patient with myeloma were infected with lentivirus containing shCD86 or pLKO.1 empty vector control. Cell death of CD38+ vs CD38− cells was assessed via staining with annexin V at indicated time points postinfection. Representative histograms for CD86 surface expression are from day 3 postinfection. FSC, forward scatter; GAPDH, glyceraldehyde-3-phosphate dehydrogenase; SSC, side scatter.
Silencing or blockade of CD86 results in myeloma cell death. (A) Myeloma cell lines were infected with lentiviral particles carrying empty vector (pLKO.1) or the individual shRNAs, and cell death was monitored by annexin V–fluorescein isothiocyanate staining for 4 days. Data for different time points were all compared with pLKO.1 controls (left). mRNA quantification as measured via qRT-PCR comparing levels of CD28 or CD86 to vector-controls (middle). Representative histograms show CD28 or CD86 surface levels at day 4 postinfection. Thin gray histograms at left are isotype controls (right). (B) mRNA quantification as measured via qRT-PCR comparing levels of CD28 or CD86 with vector controls (left). Representative histograms show CD28 or CD86 surface expression at day 4 postinfection. Thin gray histograms at left are isotype controls (right). (A-B) All data are presented as mean ± standard error of the mean (SEM) of at least 3 independent experiments. *P < .05, **P < .01, ***P < .005. All qRT-PCR data are normalized to β-actin as an endogenous control and then compared relative to mRNA levels in pLKO.1 empty vector control. RNA was extracted on day 3 postinfection. For flow cytometry data, histograms are representative of the annexin V− set in the population. (C) Gating strategy for cells from the buffy coat from a bone marrow aspirate of a patient with myeloma. Total cells were separated into CD138+ (purple) vs CD138− (orange). Histograms show that CD138+ cells are also CD38− CD28− CD86+. (D) Cells from the buffy coat from the same patient with myeloma were infected with lentivirus containing shCD86 or pLKO.1 empty vector control. Cell death of CD38+ vs CD38− cells was assessed via staining with annexin V at indicated time points postinfection. Representative histograms for CD86 surface expression are from day 3 postinfection. FSC, forward scatter; GAPDH, glyceraldehyde-3-phosphate dehydrogenase; SSC, side scatter.
We next evaluated whether CD86 silencing would have the same effect on myeloma cells from a freshly isolated patient sample. We infected cells from bone marrow aspirates of patients with myeloma with lentivirus containing shRNA against CD86. shCD86 could induce cell death in the CD38+ cells from the sample, despite incomplete silencing at day 3 postinfection, similar to results obtained using myeloma cell lines (Figure 2C-D). No difference was observed in the CD38− subset (Figure 2D). In contrast, in patient samples where myeloma cells were found to lack either CD28 or CD86, no effect was observed with shCD86 on CD38+ cells (supplemental Figure 4).
Gene expression changes in CD28- vs CD86-silenced cells are consistent with regulation of both distinct and common pathways, including expression of IRF4
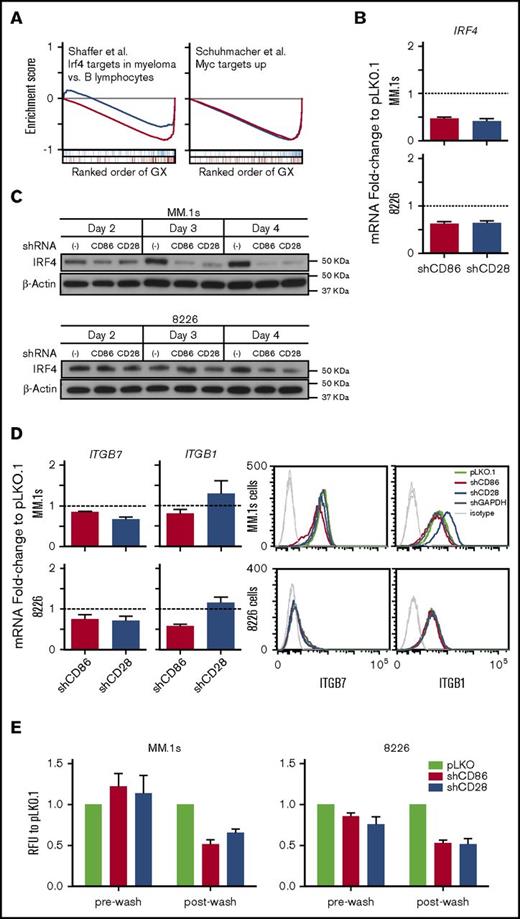
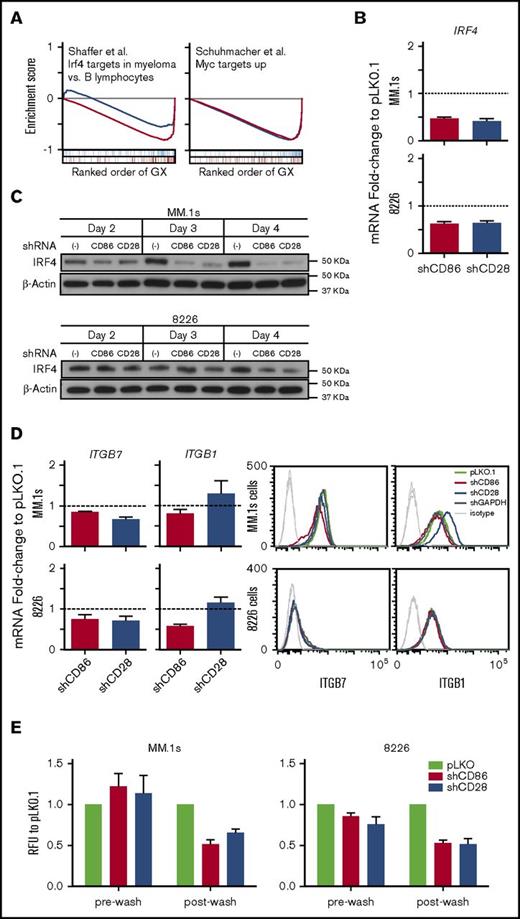
To determine potential mechanisms of CD28-CD86 cell survival signaling, both CD28 and CD86 were silenced by shRNA in MM.1s, 8226, and KMS18 myeloma cell lines and compared with mock-silenced cells (pLKO.1 vector) using RNA-seq. Hierarchical clustering showed that RNA expression separated samples by cell type as expected, but CD86-silenced cells clustered more closely to controls than CD28-silenced cells (supplemental Figure 5A). Additionally, RNA-seq confirmed our qRT-PCR and flow cytometry analyses and showed that CD28 silencing resulted in upregulation of CD86 in MM.1s and 8226 cells (supplemental Figure 5B). To determine genes affected by silencing of CD28 or CD86, differential analysis was performed while controlling for cell-line differences. This analysis yielded 390 genes regulated by CD28 silencing and 207 genes regulated by CD86 silencing and showed that they regulated few genes in common (supplemental Figure 5C). However, gene set enrichment analysis indicated that overlaps did occur with respect to pathways affected by the expression changes. Interestingly, the primary overlap between CD28 and CD86 silencing seemed to involve the downregulation of IRF4 and c-Myc targets (Figure 3A; supplemental Table 5), transcription factors known to play important roles in myeloma cell survival.
Gene expression changes in CD28- vs CD86-silenced cells are consistent with regulation of both distinct and common pathways, including expression of IRF4. (A) Gene set enrichment analysis showing upregulated (top) and downregulated (bottom) gene sets in shCD28- (blue) and shCD86-treated (red) myeloma cells. For each gene set, the enrichment score is shown above the ranked change in gene expression, where genes that overlap the gene set are denoted by blue and red ticks for shCD28 and shCD86, respectively. (B) qRT-PCR showing IRF4 mRNA levels when CD28 or CD86 was silenced in MM.1s or 8226 cells. (C) Representative western blots showing IRF4 levels with silencing of CD28 or CD86 in cell lines indicated at different time points. (D) Integrin levels were measured via qRT-PCR (ITGB7 and ITGB1; left). Representative histograms showing ITGβ1 and ITGβ7 on day 4 after shRNA treatment (right). For qRT-PCR, all data are normalized to β-actin as an endogenous control and then compared relative to mRNA levels in pLKO.1 empty vector control. RNA was extracted at day 3 postinfection. Data shown are mean ± SEM of at least 3 independent experiments. Histograms showing surface levels of indicated molecules. Gray histograms at left represent unstained or isotype controls. Flow cytometry data shown are from day 4 postinfection with lentiviral vectors. Flow cytometry and western blot data shown are representative of at least 3 independent experiments. (E) Cell adhesion 3 days postinfection with lentivirus containing the indicated shRNA. Myeloma cells stained with calcein AM were cocultured with HS-5 cells for 2 hours. Fluorescence was measured (485/528 emission/excitation) with BioTek Synergy H1 multiwell plate reader, and data are presented as fluorescence relative to pLKO.1 controls (mean ± SEM). Prewash readings were taken to ensure similar numbers of live cells were added to each well. All samples were plated in triplicate. Data are mean of 3 independent experiments. GAPDH, glyceraldehyde-3-phosphate dehydrogenase; GX, gene expression changes; RFU, relative fluorescence unit.
Gene expression changes in CD28- vs CD86-silenced cells are consistent with regulation of both distinct and common pathways, including expression of IRF4. (A) Gene set enrichment analysis showing upregulated (top) and downregulated (bottom) gene sets in shCD28- (blue) and shCD86-treated (red) myeloma cells. For each gene set, the enrichment score is shown above the ranked change in gene expression, where genes that overlap the gene set are denoted by blue and red ticks for shCD28 and shCD86, respectively. (B) qRT-PCR showing IRF4 mRNA levels when CD28 or CD86 was silenced in MM.1s or 8226 cells. (C) Representative western blots showing IRF4 levels with silencing of CD28 or CD86 in cell lines indicated at different time points. (D) Integrin levels were measured via qRT-PCR (ITGB7 and ITGB1; left). Representative histograms showing ITGβ1 and ITGβ7 on day 4 after shRNA treatment (right). For qRT-PCR, all data are normalized to β-actin as an endogenous control and then compared relative to mRNA levels in pLKO.1 empty vector control. RNA was extracted at day 3 postinfection. Data shown are mean ± SEM of at least 3 independent experiments. Histograms showing surface levels of indicated molecules. Gray histograms at left represent unstained or isotype controls. Flow cytometry data shown are from day 4 postinfection with lentiviral vectors. Flow cytometry and western blot data shown are representative of at least 3 independent experiments. (E) Cell adhesion 3 days postinfection with lentivirus containing the indicated shRNA. Myeloma cells stained with calcein AM were cocultured with HS-5 cells for 2 hours. Fluorescence was measured (485/528 emission/excitation) with BioTek Synergy H1 multiwell plate reader, and data are presented as fluorescence relative to pLKO.1 controls (mean ± SEM). Prewash readings were taken to ensure similar numbers of live cells were added to each well. All samples were plated in triplicate. Data are mean of 3 independent experiments. GAPDH, glyceraldehyde-3-phosphate dehydrogenase; GX, gene expression changes; RFU, relative fluorescence unit.
We confirmed RNA-seq results via qRT-PCR and protein analyses. We focused on genes where a consistent pattern was observed in the 3 cell lines tested. First, we looked at IRF4 expression and confirmed downregulation upon CD28 and CD86 silencing in MM.1s, 8226 (Figure 3B-C), and KMS18 (data not shown).
We also confirmed changes in expression of integrins β1 and β7. ITGB7 mRNA was downregulated when either CD28 or CD86 was silenced, whereas ITGB1 was downregulated with CD86 silencing and upregulated with CD28 silencing, in a pattern similar to CD86 itself (Figure 3D). However, we did not observe significant changes at the cell surface except for the increase in ITGβ1 after CD28 silencing in MM.1s. To determine if these changes in expression of adhesion molecules could be of functional significance, we next determined if silencing CD28 or CD86 would affect the ability of myeloma cells to adhere to stromal HS-5 cells. We performed cell adhesion assays with cells that were infected with either shCD28 or shCD86 or the control vector. We found that in both MM.1s and RPMI8226, cells infected with either shCD28 or shCD86 adhered less compared with pLKO.1 controls (Figure 3E postwash), despite similar numbers of live cells loaded into wells (Figure 3E prewash).
Given the differential pattern in changes in integrin expression, where ITGβ1 seemed to be following the same pattern as CD86 (Figure 3D), we hypothesized that CD86 may mediate downstream signals that involve regulation of ITGβ1 expression. In addition, because silencing of CD86 alone had a profound effect on myeloma cell viability, and our RNA-seq data showed that this leads to expression changes in genes distinct from when CD28 is silenced, we next investigated the role of the cytoplasmic domain of CD86 in myeloma cells.
Cytoplasmic tail of CD86 plays a role in CD28-CD86 function
Alignment of the cytoplasmic tail of CD86 from 8 mammalian species showed only 3.3% identity and 9.8% similarity (supplemental Figure 6) for the 61-residue cytoplasmic region (human). Upon closer inspection, the lack of conservation was primarily due to rodent species, and removal of rat and mouse sequences resulted in an increase to 21.3% identity and 50.8% similarity (Figure 4A). This suggests that the CD86 cytoplasmic tail may have a role in human cells that is distinct from that in rodents. Therefore, to test the role of the CD86 cytoplasmic tail in myeloma cell survival, we expressed both CD86FLm and CD86TLm, which lacked all but the first 7 residues of the cytoplasmic tail (Figure 4B). These residues were previously reported to be required to stabilize CD86 surface expression.27 Additionally, silent mutations were introduced to render the constructs resistant to the shCD86 used for CD86 silencing. After transfection into RPMI8226 cells, we sorted cells with high CD86 expression and used these cells in subsequent experiments (Figure 4B). We reasoned that with these cell lines, we could differentiate between signals coming from CD28 vs CD86, because CD86TLm would have little to no signaling capacity. After silencing of endogenous CD86, we would then have a means by which to determine the role of the CD86 cytoplasmic tail.
Overexpression of CD86 provides a survival advantage against different cell death signals. (A) Alignment of CD86 cytoplasmic domains using Clustal. *Denotes identity; : and . denote similarity. (B) Diagrams showing structure of the 2 different CD86 constructs. CD86FLm represents full-length CD86, whereas CD86TLm represents the tail-less version, wherein the cytosolic domain was shortened to 7 amino acids to abrogate signaling capacity. The histograms at the right show surface levels of stable transfection of CD86 constructs compared with pCDNA3.1 vector control and parental cells. (C) Representative histograms showing surface expression of indicated molecules in RPMI8226 CD86FLm- and CD86TLm-expressing cells. (D) Concentration curves for CD86 transfectants and vector controls with indicated pharmacologic agents. Cells were treated for 24 hours (except in the case of dexamethasone [48 hours]), and cell death was measured via annexin V–propidium iodide staining. Data shown as percentage of untreated control for each cell line. Data shown are mean ± SEM of at least 3 independent experiments. TM, transmembrane.
Overexpression of CD86 provides a survival advantage against different cell death signals. (A) Alignment of CD86 cytoplasmic domains using Clustal. *Denotes identity; : and . denote similarity. (B) Diagrams showing structure of the 2 different CD86 constructs. CD86FLm represents full-length CD86, whereas CD86TLm represents the tail-less version, wherein the cytosolic domain was shortened to 7 amino acids to abrogate signaling capacity. The histograms at the right show surface levels of stable transfection of CD86 constructs compared with pCDNA3.1 vector control and parental cells. (C) Representative histograms showing surface expression of indicated molecules in RPMI8226 CD86FLm- and CD86TLm-expressing cells. (D) Concentration curves for CD86 transfectants and vector controls with indicated pharmacologic agents. Cells were treated for 24 hours (except in the case of dexamethasone [48 hours]), and cell death was measured via annexin V–propidium iodide staining. Data shown as percentage of untreated control for each cell line. Data shown are mean ± SEM of at least 3 independent experiments. TM, transmembrane.
We found that overexpression of CD86FLm and CD86TLm resulted in a downregulation of surface CD28 (Figure 4C). This occurred irrespective of the presence of the CD86 cytoplasmic tail, suggesting modulation of CD28 levels is due primarily to a negative feedback loop, where overstimulation of CD28 via ligation with surface CD86 results in subsequent downregulation of CD28 expression.
To determine if overexpression of CD86FLm or CD86TLm would affect expression of genes regulated by CD86 silencing, we looked at surface levels of ITGβ7 and ITGβ1 (Figure 4C). We found that overexpression of CD86FLm resulted in an induction of integrin expression. The induction of integrin expression occurred only with CD86FLm but not CD86TLm, which indicates that the cytoplasmic domain of CD86 is necessary for regulation of integrin surface expression.
Because silencing of CD86 resulted in myeloma cell death, we next determined if there would be a survival advantage with CD86 overexpression. We treated the cell lines with a Bcl-2/Bcl-xL inhibitor (ABT-737), proteasome inhibitors (bortezomib, carfilzomib), a corticosteroid (dexamethasone), and an alkylating agent (melphalan; Figure 4D). We found that CD86FLm but not CD86TLm provided a distinct survival advantage for cells treated with ABT-737 or dexamethasone. In the case of the proteasome inhibitors, a small but reproducible shift in the dose response curves was observed, whereas with melphalan, there was no effect. Overall, our data indicate that the cytoplasmic domain of CD86 is relaying a signal in myeloma cells that can provide a survival advantage.
Overexpression of shRNA-resistant CD86FLm protects against CD28 and CD86 silencing but not against loss of IRF4
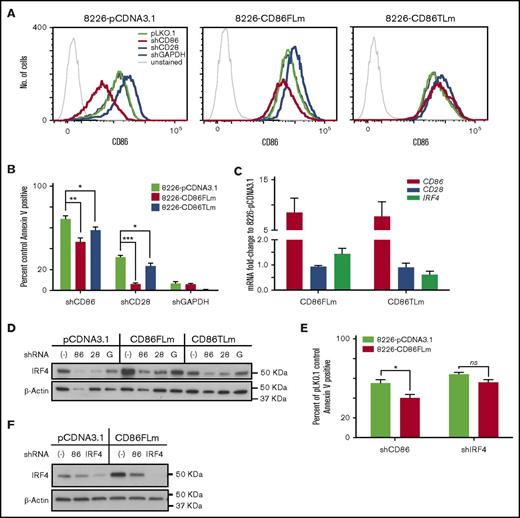
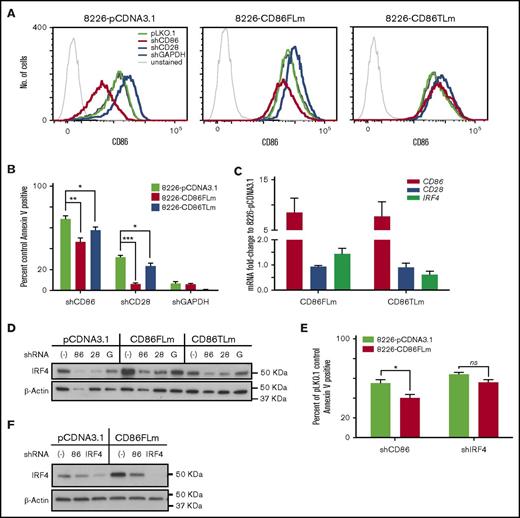
To determine if overexpression of CD86FLm or CD86TLm could protect against CD28-CD86 blockade, we silenced endogenous CD28 or CD86 in cells that overexpressed these constructs. As seen in Figure 5A, silencing of CD28 and CD86 in the vector control cells yielded results similar to those in parental 8226. We saw a 50% decrease in CD86 expression when CD86 was silenced, whereas CD28 silencing resulted in a nearly two-fold increase in CD86. In contrast, CD86 expression in the cells overexpressing CD86TLm was completely resistant to the effects of shCD86. Although shCD86 did lower CD86 in the CD86FLm-expressing cells, these cells still expressed higher levels than endogenous CD86 expression. Overexpression of CD86FLm completely blocked shCD28-induced death and significantly protected against shCD86-induced death. In contrast, CD86TLm protected against both hairpins reproducibly; however, the level of protection was modest (Figure 5B).
Overexpression of CD86FLm provides a survival advantage against silencing of CD86 and CD28 but not against silencing of IRF4. (A) Representative histograms showing the levels of surface CD86 in 3 different cell lines when either CD28, CD86, or glyceraldehyde-3-phosphate dehydrogenase (GAPDH) are silenced. Thin black histograms at left are unstained pLKO.1-infected controls. (B) Cell death measured at day 4 postinfection via annexin V staining, shown as percentage of pLKO.1-infected controls. (A-B) Data shown are from day 4 postinfection and representative of at least 3 independent experiments. (C) qRT-PCR was performed to determine levels of CD86, CD28, and IRF4 to compare the different cell lines. Data are normalized to β-actin as endogenous control and then compared relative to mRNA levels in pLKO.1 empty vector control. Data shown are mean ± SEM of at least 3 independent experiments. (D) Representative western blots showing levels of IRF4 in cells overexpressing CD86FLm or CD86TLm when either CD86 or CD28 are silenced. Lysates are from day 4 postinfection. (E) Cell death as measured by annexin V staining at day 4 postinfection in 8226-pCDNA3.1 or 8226-CD86FLm cells where CD86 or IRF4 was silenced; shown as percentage of pLKO.1-infected controls. (F) Representative western blots showing levels of IRF4 and β-actin in lysates from experiments in panel E. Data shown are mean ± SEM of at least 3 independent experiments. *P < .05, **P < .01, ***P < .005.
Overexpression of CD86FLm provides a survival advantage against silencing of CD86 and CD28 but not against silencing of IRF4. (A) Representative histograms showing the levels of surface CD86 in 3 different cell lines when either CD28, CD86, or glyceraldehyde-3-phosphate dehydrogenase (GAPDH) are silenced. Thin black histograms at left are unstained pLKO.1-infected controls. (B) Cell death measured at day 4 postinfection via annexin V staining, shown as percentage of pLKO.1-infected controls. (A-B) Data shown are from day 4 postinfection and representative of at least 3 independent experiments. (C) qRT-PCR was performed to determine levels of CD86, CD28, and IRF4 to compare the different cell lines. Data are normalized to β-actin as endogenous control and then compared relative to mRNA levels in pLKO.1 empty vector control. Data shown are mean ± SEM of at least 3 independent experiments. (D) Representative western blots showing levels of IRF4 in cells overexpressing CD86FLm or CD86TLm when either CD86 or CD28 are silenced. Lysates are from day 4 postinfection. (E) Cell death as measured by annexin V staining at day 4 postinfection in 8226-pCDNA3.1 or 8226-CD86FLm cells where CD86 or IRF4 was silenced; shown as percentage of pLKO.1-infected controls. (F) Representative western blots showing levels of IRF4 and β-actin in lysates from experiments in panel E. Data shown are mean ± SEM of at least 3 independent experiments. *P < .05, **P < .01, ***P < .005.
Because IRF4 is a well-characterized myeloma survival factor,28,29 we investigated whether IRF4 levels changed in cells that were overexpressing either the CD86FLm or CD86TLm constructs. We found that overexpression of CD86FLm led to a modest increase in IRF4 at both the mRNA and protein levels (Figure 5C-D). Downregulation of IRF4 in these lines was less pronounced after silencing of either CD28 or CD86 compared with vector control cells (Figure 5D). These data are consistent with CD28-CD86 signaling promoting myeloma cell survival via the regulation of IRF4 expression. To determine if overexpression of CD86FLm could protect against cell death from IRF4 loss, we silenced IRF4 in these cells. Although CD86FLm could protect against shCD86, it could not significantly protect against shIRF4 (Figure 5E). Silencing with shIRF4 resulted in comparable loss of IRF4 at day 4 postinfection in both empty vector controls and CD86FLm overexpressers (Figure 5F).
Overexpression of prosurvival Bcl-2 family members leads to partial inhibition of CD86 knockdown–induced death
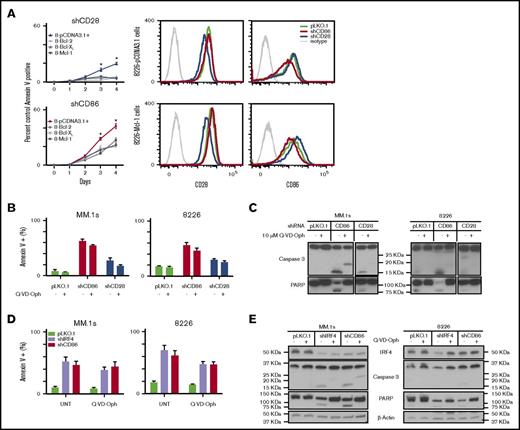
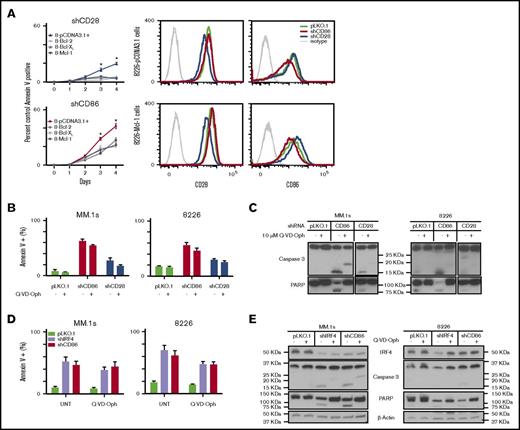
To characterize the mechanism(s) of cell death induced by blockade of the CD28-CD86 pathway, we next determined whether overexpression of the prosurvival Bcl-2 family members could protect against silencing of either molecule. Compared with pCDNA3.1 (empty vector controls), we found that overexpression of Bcl-2, Bcl-xL, or Mcl-1 significantly protected against cell death induced by silencing of either CD28 or CD86 (Figure 6A; supplemental Figure 7). In the case of CD28 silencing, overexpression of any of the prosurvival proteins abrogated cell death (Figure 6A top). Silencing of CD86 in the cells that overexpressed prosurvival proteins resulted in significantly lower levels of cell death as compared with empty vector controls (Figure 6A bottom); however, cell death was only partially blocked.
Cell death induced by CD86 blockade is only partially caspase dependent and has similarities to death induced by loss of IRF4. (A) Panels showing cell death represented as percentage of pLKO.1-infected controls over time in RPMI8226 cells overexpressing the indicated Bcl-2 family members (left). Representative histograms showing surface expression of CD28 or CD86 in 8226-pCDNA3.1 controls and 8226–Mcl-1 transfectants (right). (B) Cell death levels measured via percentage of annexin V+ cells at day 4 postinfection. For Q-VD-Oph–treated cells, the caspase inhibitor was added at day 2 postinfection. All data are from day 4 postinfection. (C) Representative western blots showing caspase-3 and poly (ADP-ribose) polymerase (PARP) cleavage with silencing of CD28 or CD86, with or without Q-VD-Oph. (D) Cell death with IRF4 or CD86 silencing was measured via annexin V staining, in the presence or absence of Q-VD-Oph. (E) Representative western blots showing expression of IRF4, caspase 3, and PARP when CD86 or IRF4 are silenced in MM.1s and 8226 cells. Data shown are mean ± SEM or representative of at least 3 independent experiments. *P < .05. UNT, untreated.
Cell death induced by CD86 blockade is only partially caspase dependent and has similarities to death induced by loss of IRF4. (A) Panels showing cell death represented as percentage of pLKO.1-infected controls over time in RPMI8226 cells overexpressing the indicated Bcl-2 family members (left). Representative histograms showing surface expression of CD28 or CD86 in 8226-pCDNA3.1 controls and 8226–Mcl-1 transfectants (right). (B) Cell death levels measured via percentage of annexin V+ cells at day 4 postinfection. For Q-VD-Oph–treated cells, the caspase inhibitor was added at day 2 postinfection. All data are from day 4 postinfection. (C) Representative western blots showing caspase-3 and poly (ADP-ribose) polymerase (PARP) cleavage with silencing of CD28 or CD86, with or without Q-VD-Oph. (D) Cell death with IRF4 or CD86 silencing was measured via annexin V staining, in the presence or absence of Q-VD-Oph. (E) Representative western blots showing expression of IRF4, caspase 3, and PARP when CD86 or IRF4 are silenced in MM.1s and 8226 cells. Data shown are mean ± SEM or representative of at least 3 independent experiments. *P < .05. UNT, untreated.
Because overexpression of prosurvival Bcl-2 family members was unable to completely protect against cell death induced by CD86 silencing, we treated cells with pan-caspase inhibitors to determine whether shCD86-induced cell death was caspase dependent. After infection with lentivirus containing either shCD28 or shCD86, cells were treated with the caspase inhibitor Q-VD-Oph at day 2 postinfection, and viability was determined after 48 hours. We found that inhibition of caspase activity could not protect against cell death induced by CD86 or CD28 silencing (Figure 6B). To ensure that the lack of protection after caspase inhibition was not simply due to incomplete blockade, we determined the effect of silencing and Q-VD-Oph on caspase-3 and PARP cleavage (Figure 6C). In both MM.1s and 8226 cells, silencing of CD28 or CD86 resulted in caspase-3 cleavage to the mature p17 form and cleavage of the caspase-3 substrate PARP. Q-VD-Oph treatment resulted in a complete block of PARP cleavage, suggesting that effector caspase (caspase-3,7) activity is completely blocked under these conditions. However, for CD86 silencing, there seemed to be some residual initiator caspase activity, as demonstrated by the appearance of the pro-p20 intermediate band that was the expected product of partially processed caspase-3. Because PARP cleavage was ablated, this product did not have activity under these conditions.
Because our data indicated that IRF4 expression was being regulated by CD86 cytoplasmic tail activity, we next determined if shIRF4-induced death would phenocopy that of shCD86. Silencing of IRF4 in MM.1s and 8226 cell lines led to high levels of cell death that could only be partially inhibited by treatment with Q-VD-Oph (Figure 6E). Consistent with CD86 silencing, we found that treatment with the pan-caspase inhibitor could only partially block caspase-3 cleavage but effectively blocked effector caspase function, as shown by lack of cleavage of PARP in the presence of Q-VD-Oph (Figure 6F). Overall, our data indicate that CD86 is mediating a signal that involves regulation of myeloma survival via the regulation of IRF4 expression.
Discussion
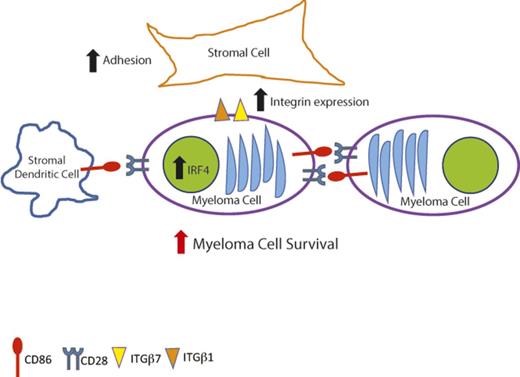
We previously characterized how CD28 on myeloma cells can interact with dendritic cells that express CD80/CD86, which leads to secretion of interleukin-6 by dendritic cell,11 indicating how myeloma cells can influence the tumor microenvironment to their advantage. However, progression in myeloma involves the development of independence from stroma, and coexpression of both CD28 and CD86 is a means to gain that independence, because it allows for survival signaling to be mediated either between myeloma cells or via autocrine activation of the pathway. This could explain the sensitivity of CD28-CD86 myeloma cell lines and patient samples to blockade of this pathway, because once either component is partially silenced, a key survival signal is lost. This is the first demonstration that a receptor-ligand pair on myeloma cells mediates stroma-independent survival.
Our data also indicate that the cytosolic domain of CD86 is relaying a signal that is separate but not independent from its role as a ligand for CD28 activation. Although previous reports have indicated that CD86 has signaling capacity, these studies were primarily performed using murine models. The extracellular domain of the different CD86 orthologs is highly conserved; however, the cytosolic domains are highly variable, with the rodent orthologs showing the greatest divergence. This indicates that although the function of CD86 as a CD28 activator is conserved, what happens downstream of its ligation to CD28 may differ across species. Thus, studies in murine systems may not completely explain which signals are mediated in human cells by CD86. Given the differences in the cytoplasmic tail, and our finding that the cytoplasmic tail is required for maximal CD86 activity, additional studies of the downstream signaling events from human CD86 are warranted.
We were surprised that overexpression of CD86FLm could only partially protect against cell death induced by shCD86. We hypothesize that this could have been a result of the variant of CD86 we were overexpressing in 8226. This cell line expresses the CD86-A304 allele; however, the complementary DNA in the overexpression construct (CD86FLm) contains the CD86-T304 allele. This change is a result of a polymorphism (rs1129055) that has been linked to increased cancer risk30-32 and graft acceptance,33,34 suggesting this version of CD86 may be less effective in an immunological setting. Interestingly, A304 is in the cytoplasmic tail and was conserved in all species analyzed except rat and mouse (supplemental Figure 4).
The survival signal being mediated by CD28-CD86 is multifaceted, as shown by how this pathway seems to be regulating expression of different gene families that play important roles in normal myeloma cell physiology. Interestingly, the top gene ontologies downregulated for CD28 (RNA processing) and CD86 silencing (unfolded protein response, protein processing) are processes wherein mutations were found to be prevalent in the initial genome sequencing analysis performed in myeloma.35 This could explain why we saw more significant gene expression changes with silencing of CD28 but saw a higher impact on viability with silencing of CD86, given that myeloma cells are so reliant on protein metabolic pathways for function and survival. Although our RNA-seq data show limited overlap in the list of genes whose expression changed with silencing of either CD28 or CD86, gene set enrichment analyses indicate that these 2 molecules regulate common pathways important in maintaining cell viability. Additionally, differences in expression could be due to the availability of other ligands. CD28 can also bind to CD80 and ICOSLG.36 Although CD80 is not observed on myeloma cells, ICOSLG has been detected in myeloma37 and seemed to be more highly expressed than CD86 at the mRNA level in the KMS18 cell line (data not shown).
CD86 also plays a role in regulating surface expression of integrins, which are important molecules for facilitating cell-cell and cell-stroma interactions. Myeloma cells are dependent on integrin-mediated interactions with the bone marrow stroma components.38-40 Consistent with altering integrin levels, silencing of either CD28 or CD86 resulted in decreased adhesion to stromal cells, demonstrating a role for this pathway in regulating myeloma cell adhesion. Additionally, our studies demonstrate that ITGβ1 expression is regulated in a similar fashion as CD86 itself, and importantly, the cytoplasmic tail of CD86 is required for increased ITGβ1. These data suggest that ITGβ1 is regulated downstream of CD86 and is not a consequence of CD28 signaling. Interestingly, upregulation of ITGβ1 when CD28 was silenced did not seem to compensate for the decrease in expression of ITGβ7, because we still observed a decrease in the ability of myeloma cells to adhere to the HS-5 stromal cells. This indicates that ITGβ7 may play a more significant role in adhesion to HS-5 cells than does ITGβ1.
Myeloma cells require IRF4 for survival.28 Our data show that CD28-CD86 signaling plays a role in the regulation of this transcription factor, because silencing of CD28 or CD86 resulted in downregulation of IRF4. IRF4 regulates homeostatic autophagy in myeloma cells.41 Autophagy is a catabolic pathway that cells use to compensate for nutrient deficiency or extreme protein burden. If overactivated, however, it can lead to cell death that is caspase independent but can be inhibited by Bcl-2/Bcl-xL,42,43 as we observed with CD86 silencing or blockade.
Our data do not support previous findings that CD28 and/or CD86 is associated with poor prognosis. Several potential reasons could account for these differences, including the number of patients evaluated, the length of follow-up observations, differences in treatment regimens, and the proportion of t(14:16) patients in each cohort. This translocation is associated with both poor prognosis and significantly higher CD28 expression. Although we see a similar pattern in CoMMpass, of the 645 patients analyzed, sequencing-derived fluorescence in situ hybridization on 552 samples indicated that only 17 (3.02%) had c-MAF translocations. Because flow cytometry data for CD28 expression was available for 141 of 645 patients, we were able to compare RNA and protein expression. Although unable to perform a direct comparison of expression levels, we were able to demonstrate that nearly all had myeloma plasma cells that expressed CD28 at diagnosis. Of these, we observed 100% CD28+ staining in 71% of the samples (101 of 141). This is significantly higher than previously reported (47.8% positive)44 and suggests CD28 may play a more important role in myeloma pathogenesis than previously appreciated. Although cell-surface expression of CD86 was not available for comparison, RNA expression also suggests that CD86 expression is more prevalent at diagnosis than previously appreciated.18
Taken together, our data strongly indicate the combination of CD28-CD86 signaling plays an important role in mediating myeloma cell survival. Data from CoMMpass show that low expression of CD28 and CD86 is prognostic of a better outcome for patients as compared with the rest of the patient cohort (ie, intermediate or high expressers of CD28 and CD86). However, this represents a minority of newly diagnosed patients. Therefore, blocking this pathway may prove beneficial for most patients with myeloma. Because a pharmacologic agent that inhibits this pathway is already US Food and Drug Administration approved, we believe this is a promising therapeutic addition for the treatment of myeloma.
The full-text version of this article contains a data supplement.
Acknowledgments
The authors thank Greg Doho for initial analyses of sequencing data, Jeremy M. Boss for providing helpful feedback, and members of the Boise and Lee laboratories for reagents, technical support, feedback, and helpful discussion.
This work was supported by National Institutes of Heath, National Cancer Institute grants R01 CA127910 (L.H.B.), R01 CA192844 (L.H.B.), R01 CA121044-09 (K.P.L.), and P30 CA138292 (L.H.B. and S.N.); and by funding from the T. J. Martell Foundation (L.H.B.).
Authorship
Contribution: C.M.G. and L.H.B. conceptualized and designed all experiments; C.M.G. performed all experiments; B.G.B. performed in-depth computational analyses of the sequencing data; all authors analyzed and interpreted data; C.M.G. and L.H.B. wrote the paper; and all authors reviewed and edited the final manuscript.
Conflict-of-interest disclosure: S.L. is a consultant for Millennium Pharmaceuticals, Celgene, Novartis, Bristol-Myers Squibb, Onyx Pharmaceuticals, and Janssen and receives research support from Bristol-Myers Squibb, Janssen, Takeda Pharmaceuticals, and Celgene. A.K.N. is a consultant/advisory board member for Spectrum Pharmaceuticals, Novartis, and Amgen. L.H.B. is a consultant for AbbVie. The remaining authors declare no competing financial interests.
Correspondence: Lawrence H. Boise, 1365C Clifton Rd NE, Suite C4012, Atlanta, GA 30322; e-mail: lboise@emory.edu.

![Figure 4. Overexpression of CD86 provides a survival advantage against different cell death signals. (A) Alignment of CD86 cytoplasmic domains using Clustal. *Denotes identity; : and . denote similarity. (B) Diagrams showing structure of the 2 different CD86 constructs. CD86FLm represents full-length CD86, whereas CD86TLm represents the tail-less version, wherein the cytosolic domain was shortened to 7 amino acids to abrogate signaling capacity. The histograms at the right show surface levels of stable transfection of CD86 constructs compared with pCDNA3.1 vector control and parental cells. (C) Representative histograms showing surface expression of indicated molecules in RPMI8226 CD86FLm- and CD86TLm-expressing cells. (D) Concentration curves for CD86 transfectants and vector controls with indicated pharmacologic agents. Cells were treated for 24 hours (except in the case of dexamethasone [48 hours]), and cell death was measured via annexin V–propidium iodide staining. Data shown as percentage of untreated control for each cell line. Data shown are mean ± SEM of at least 3 independent experiments. TM, transmembrane.](https://ash.silverchair-cdn.com/ash/content_public/journal/bloodadvances/1/25/10.1182_bloodadvances.2017011601/3/m_advances011601f4.jpeg?Expires=1766019856&Signature=a0r6NRB9DA7vrNeITovJxtRNcXm34SQAiVrml3MsDgQA~~Y8a3xHGyMFeopsTDmcRAvkLBm1W2PdyaTcvgHSYvSQdT-I~KhGke4d1rkJTIV4pteTnshmbYp60osCRX44MF8UvKU9yMk0vCH4hnv468Se80eJmPLLQAwfy1bHY39qn8WwPksvxjAzyg6MIudAZQfffGfp9LlCPpHBdkye-sXePkm3Fh6A-7rHCmIlCNkmOjMPEZLNNbmveKdmh6T0CFFgLuh0-Cs-4Lx8ZETbBpPyywD75UctREGpmhBRUfNQxiIr22yHkCG8rk9rU2GNQQ97pfEPK~1lPbDEX4Bcjw__&Key-Pair-Id=APKAIE5G5CRDK6RD3PGA)

![Figure 4. Overexpression of CD86 provides a survival advantage against different cell death signals. (A) Alignment of CD86 cytoplasmic domains using Clustal. *Denotes identity; : and . denote similarity. (B) Diagrams showing structure of the 2 different CD86 constructs. CD86FLm represents full-length CD86, whereas CD86TLm represents the tail-less version, wherein the cytosolic domain was shortened to 7 amino acids to abrogate signaling capacity. The histograms at the right show surface levels of stable transfection of CD86 constructs compared with pCDNA3.1 vector control and parental cells. (C) Representative histograms showing surface expression of indicated molecules in RPMI8226 CD86FLm- and CD86TLm-expressing cells. (D) Concentration curves for CD86 transfectants and vector controls with indicated pharmacologic agents. Cells were treated for 24 hours (except in the case of dexamethasone [48 hours]), and cell death was measured via annexin V–propidium iodide staining. Data shown as percentage of untreated control for each cell line. Data shown are mean ± SEM of at least 3 independent experiments. TM, transmembrane.](https://ash.silverchair-cdn.com/ash/content_public/journal/bloodadvances/1/25/10.1182_bloodadvances.2017011601/3/m_advances011601f4.jpeg?Expires=1766420541&Signature=qq537gmxrlGgjrh50B~brUMsjXv5OVKSuozUWIOERWDF18iVhxoDXRdfFaAtN8Z911-w212iC8YBCJbewpaDlT1mjIqALiq5N09KRE9C4j-eyNUUkrV7soqtWDr84tcOslimDYAbTiw-DXFzV216O0qp8hrJQCuSgJLKBn~NKPSAw-Rn0i6vgbJsnjt2PPbASOcvyx1~UHBGXvmZH-f5sPUj3voQ71KNrEUQbdJ4r4R2Eii9a89lvHCNFLNiJ~oXn2iW0Ew-8Si5RC8nGYXUCaN6hYBknneuVIysoOQYbB~iDY1eZWSRjmmDT2wirJwPuc~lI-W9sVy0VofkQdpnDA__&Key-Pair-Id=APKAIE5G5CRDK6RD3PGA)
