Key Points
Human type 3 ILCs acquire features of early differentiated NK cells upon cytokine stimulation.
IL-12 and IL-15–differentiated human ILC3s acquire cytotoxicity and kill leukemic targets.
Abstract
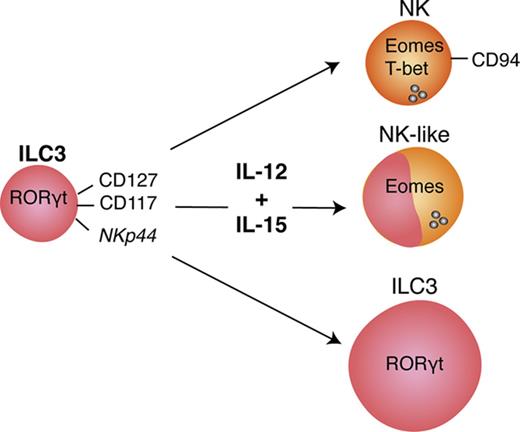
Type 3 innate lymphoid cells (ILC3s) fulfill protective functions at mucosal surfaces via cytokine production. Although their plasticity to become ILC1s, the innate counterparts of type 1 helper T cells, has been described previously, we report that they can differentiate into cytotoxic lymphocytes with many characteristics of early differentiated natural killer (NK) cells. This transition is promoted by the proinflammatory cytokines interleukin 12 (IL-12) and IL-15, and correlates with expression of the master transcription factor of cytotoxicity, eomesodermin (Eomes). As revealed by transcriptome analysis and flow cytometric profiling, differentiated ILC3s express CD94, NKG2A, NKG2C, CD56, and CD16 among other NK-cell receptors, and possess all components of the cytotoxic machinery. These characteristics allow them to recognize and kill leukemic cells with perforin and granzymes. Therefore, ILC3s can be harnessed for cytotoxic responses via differentiation under the influence of proinflammatory cytokines.
Introduction
Adaptive immune responses are orchestrated by helper T-cell subsets that tailor the immune system’s effector function for optimal restriction of pathogenic threats.1 Along these lines, CD4+ T helper 1 (Th1) cells aid in the priming and maintenance of cytotoxic CD8+ T cells during cell-mediated immune control of viruses and tumors, CD4+ Th2 cells assist B cells to mount humoral immune responses to parasites, and CD4+ Th17 cells defend mucosal barriers by stimulating epithelial cells and recruiting neutrophils. It has been suggested that innate lymphoid cells (ILCs) represent the innate counterpart to these polarized Th-cell responses, whereby type 1 ILCs (ILC1s) fulfill some of the functions of Th1, ILC2s of Th2, and ILC3s of Th17 cells.2-4 Indeed, by both lineage-defining transcription factors and hallmark cytokines, the ILC subsets seem to resemble Th-cell subsets. ILC1s express T-box transcription factor T-bet and produce interferon-γ (IFN-γ); ILC2s carry the highest levels of GATA-binding protein 3 (GATA3) and produce interleukin-4 (IL-4), IL-5, IL-9, and IL-13; and ILC3s harbor RAR-related orphan receptor γ T (RORγt) and produce IL-22. However, this clear structure of discrete ILC lineages has been challenged by recent reports that both human ILC2s and ILC3s can differentiate into helper ILC1s under inflammatory conditions in the presence of IL-12.5-10 Moreover, mass cytometric and single-cell transcriptomic studies of human ILCs have called into question the existence of a helper ILC1 subset distinct from natural killer (NK) cells.11,12
In contrast to ILCs, NK cells are considered the innate counterpart of cytotoxic CD8+ T cells as they express cytolytic molecules, like perforin and granzymes, and the transcription factor Eomes.13-15 NK cells do not develop exclusively in the bone marrow and seem to undergo functional maturation in the periphery.16 Interestingly, NK developmental intermediates found in secondary lymphoid tissues, namely Lineage−CD117+CD94− stage 3 and CD117−/+CD94+NKp80− stage 4a cells, share features with ILC3s such as IL-22 production.17,18 Moreover, RORγt-expressing precursors might give rise to NK cells.18,19 Therefore, these studies, as a second line of evidence, also suggest that cells with phenotypic and functional similarities to ILC3s can give rise to NK cells. To investigate this question in more detail, we isolated ILC3s from pediatric tonsils and secondary lymphoid and intestinal tissues of mice with reconstituted human immune system components and exposed them to proinflammatory cytokines. We report here that human cytokine-differentiated ILC3s transcriptionally and phenotypically resemble early differentiated NK cells and upregulate their cytolytic machinery under inflammatory conditions. Thus, cytotoxic innate lymphocytes can develop from ILC3s, and IL-12 plus IL-15 are the most efficient cytokines at inducing this differentiation.
Materials and methods
Tissue collection
Tonsils were collected from patients undergoing tonsillectomy at the University Children’s Hospital of Zürich and the University Hospital Zürich. Human fetal liver tissues were procured from Advanced Bioscience Resources. Tissues were collected after patients provided informed consent in accordance with the Declaration of Helsinki. All studies involving human samples were reviewed and approved by the cantonal ethical committee of Zürich, Switzerland (protocol no. KEK-StV-Nr.19/08).
Humanized mice
Humanized mice were generated as described in supplemental Materials and methods.
Cell lines
K562, 721.221, and Jurkat cells were maintained in R10 (RPMI 1640 with 10% fetal calf serum; Bioswisstec/Gibco) and antibiotics (penicillin [50 U/mL], streptomycin [50 μg/mL]). All culture reagents, unless otherwise indicated, were purchased from Life Technologies.
Cell isolation and purification
Cell isolations and purifications were performed as described in supplemental Materials and methods.
Flow cytometry and cell sorting
All antibodies used for flow cytometric analysis are listed in supplemental Table 1. Dead cells were excluded with a LIVE/DEAD Fixable Aqua or Near-IR kit (Invitrogen). For detecting cell surface markers, cells were stained for 20 minutes on ice. For cytokine/granzyme B (GzmB)/perforin detection, cells were fixed and permeabilized with a Cytofix/Cytoperm kit from BD Biosciences and stained for 30 minutes on ice. For intranuclear stainings, a Foxp3/Transcription Factor Staining Buffer Set from eBioscience was used, and cells were stained for 45 minutes at room temperature or at 4°C overnight. Data were acquired on an LSR II Fortessa cytometer (BD Biosciences). For cell sorting, a FACSAria III instrument (BD Biosciences) was used. Analysis was performed using FlowJo software (TreeStar).
Expansion of ILCs
ILCs were seeded with irradiated allogeneic peripheral blood mononuclear cells and the B-lymphoblastoid cell line 721.221 in the presence of phytohemagglutinin (PHA-L) (2.5 μg/mL; EMD Millipore) and cytokines (Peprotech); the latter were replenished every 3 to 4 days starting at day 5. ILCs were stimulated with IL-2 (600 U/mL), IL-7 (10 ng/mL), IL-12 (50 ng/mL), IL-15 (20 ng/mL), IL-18 (50 ng/mL), or combinations thereof as specified in the respective figures. NK cells were expanded with IL-15 (20 ng/mL). Cultures were maintained in RPMI 1640 plus 10% human serum AB (Bioconcept) plus L-glutamine (2 mM; Gibco) plus gentamicin (20 μg/mL) at 37°C with 5% CO2 for 2 to 5 weeks. For single-cell cultures, ILC3s were single-cell sorted into 96-well plates preseeded with irradiated Cell Trace Violet–labeled feeders, and cultured in the presence of IL-2 plus IL-7 or IL-12 plus IL-15 for 21 days.
Cytokine production, degranulation, and cytotoxicity assays
For flow cytometric analyses, K562 cells were labeled with Cell Trace Violet (Invitrogen).
For the analysis of cytokine production and cytotoxic effector molecule release, cultured ILCs were stimulated for 4 hours with K562 cells at an effector-to-target (E:T) ratio of 1:1, with 10 ng/mL phorbol myristate acetate (PMA) and 500 ng/mL ionomycin (both from Sigma-Aldrich) or in addition with IL-1β (50 ng/mL) and IL-23 (50 ng/mL). After 45 minutes, 2 μM monensin (eBioscience) and 5 μg/mL brefeldin A (Sigma-Aldrich) were added.
For degranulation assays, cultured ILCs were coincubated with K562 cells at a ratio of 1:1 in the presence of fluorescein isothiocyanate–conjugated anti-CD107a monoclonal antibody (mAb). After 1 hour, degranulation was blocked by addition of GolgiStop (BD Biosciences); after a total of 4 hours, CD107a surface expression on effector cells was assessed.
To detect spontaneous degranulation or constitutive expression of cytokines/cytotoxic effectors, a control without target cells was included.
Cytolytic activity was measured using a lactate dehydrogenase cytotoxicity assay (ThermoFisher) and calculated according to the manufacturer’s instructions. K562 or Jurkat cells (2 × 10³ cells per well) were incubated with effectors at a 10:1 ratio for 18 hours, unless otherwise stated. For blocking experiments, anti-TRAIL (2E5; 1 μg/mL), anti-FasL (NOK-1; 10 μg/mL), and control mouse immunoglobulin G1 (IgG1 [MOPC-21]; 10 μg/mL) antibodies were used. Antibodies were titrated on Jurkat cells using purified effector molecules (data not shown). For perforin-mediated cytotoxicity inhibition, effector cells were preincubated for 2 hours with concanamycin A (CMA; 10 nM).
RNA sequencing
Total RNA was isolated using the PicoPure RNA isolation kit (ThermoFisher). NKp44+ ILC3s were either transferred to lysis buffer right after sorting or differentially cultured for 3 weeks. Samples were stored at −80°C until use. Freshly isolated splenic ILC3s (2000-15 000), tonsillar ILC3s (900-9 000), and expanded cells (10 000) were used for RNA isolation. Quality control and sequencing was performed by the Genomics Facility Basel (Department of Biosystems Science and Engineering, Eidgenössische Technische Hochschule Zürich [ETH], Basel, Switzerland). Adapter sequence (AAGCAGTGGTATCAACGCAGAGT) was trimmed from obtained single-end RNA sequencing (RNA-seq) reads (51 mer) using the preprocessReads function from the QuasR package (Gaidatzis et al,20 version 1.14.0, R version 3.3.1). Preprocessed reads were mapped to the human genome assembly, version hg19, with RNA-STAR,21 with default parameters except for reporting only 1 hit in the final alignment files for multimappers (outSAMmultNmax=1) and allowing only reads after filtering to pass into the spliced junction table (outFilterType=“BySJout”). Using RefSeq messenger RNA (mRNA) coordinates from the University of California Santa Cruz (UCSC; https://genome.ucsc.edu) and the qCount function from the QuasR package, we quantified gene expression as the number of reads that started within any annotated exon of a gene. The differentially expressed genes were identified using the edgeR package (Robinson et al,22 version 3.16.5). Genes with a false discovery rate smaller than 0.05 and a minimum log2 fold change of ±1 were used for downstream analysis. The obtained data sets (GSE99246) were compared with the gene expression analysis of Montaldo et al23 (GSE63197). For every gene, the probe with highest variance across samples was kept. The differential expression analysis between NK and ILC3 cells was calculated using the “limma” package.24 Patient structure was taken into account as a covariate.
Statistical analysis
Comparison between differentially cultured ILCs was done via paired Student t tests. The Spearman coefficient was used to determine the correlation between cytotoxicity and frequency of the indicated populations within cultures. Statistical analysis was performed using Prism software (GraphPad). Data are displayed as mean ± standard deviation (SD), unless otherwise stated.
Results
ILC3s in tonsils and humanized mouse tissues
The findings that human NK cells can be derived from RORγt-expressing precursors18,19 and the controversial existence of an ILC1 population distinct from NK cells in humans11 suggest fundamental species differences in ILC biology25-27 and the need for a better experimental model to study human ILC biology. To that end, we characterized ILCs, specifically ILC3s and NK cells, in NOD-scid Il2rγnull mice engrafted with human CD34+ hematopoietic progenitor cells, denoted as huNSG mice (human reconstitution shown in supplemental Figure 1). We were able to detect ILC3s, identified as CD127+CD117+Lineage−(CD3−CD19−CD14−CD16−FcεRIα−CD34−TCRα/β−TCRγ/δ−CD294−) cells, across various lymphoid and nonlymphoid organs of huNSG mice (Figure 1 and data not shown) and focused on spleen and small intestine (SI) in our further analysis. In parallel, we analyzed ILC3s from human tonsils, where they are readily found.11 ILC3s and NK cells, sorted as NKp46+CD94+CD127−Lineage− cells, were similarly represented in tonsils (18% and 24% of ILCs of interest, respectively) and the SI of huNSG mice (both 36%), whereas in huNSG spleens ILC3 frequency was more than twofold lower (22% vs 54% of ILCs of interest) (Figure 1B). Spleen and SI not only differed in relative subset distribution, but also in ILC frequency among CD45+ cells (Figure 1C). Consistent with human data,9,11 ILC3s were enriched in the intestine but were rare in spleen (6%-9% and circa 0.2% of human leukocytes, respectively). No differences were observed between huNSG mice with and without a HLA-A2 transgene. Thus, ILC3s develop in huNSG mice and this model can be exploited for studying human ILC development and function.
ILC3s in pediatric tonsils and spleens of huNSG mice. (A) Sorting strategy for isolation of viable (Aqua Live/Dead−) human (huCD45+) ILCs: after exclusion of cells positive for CD3, CD19, CD14, CD16, FcεRIα, CD34, TCRα/β, TCRγ/δ, and CD294, ILC3s were identified as CD127+CD117+ and selected for NKp44+ (red) or NKp44−NKp46− (dark blue, referred to as NCR−). NK cells were sorted as NKp46+CD127−CD94+ cells (yellow). Shown is a representative spleen sample, magnetic-activated cell sorting (MACS)–depleted for CD19, CD14, CD4, and CD8. (B) Pie charts show mean frequency (±SD) of the indicated populations among ILCs of interest, as defined in panel A, within spleen (N = 26 from 20 human fetal liver [HFL] donors with 2 to 15 mice per donor), small intestine (SI) (N = 12 from 9 HFL donors with 4-15 pooled mice), and pediatric tonsils (N = 16). (C) Mean frequency (±SD) of the indicated populations among huCD45+ cells derived from spleen (N = 3, 1-8 mice per HFL donor) and SI (samples as in panel B). FSC-A, forward scatter area; FSC-H, forward scatter height; SSC-A, side scatter area; TCR, T-cell receptor.
ILC3s in pediatric tonsils and spleens of huNSG mice. (A) Sorting strategy for isolation of viable (Aqua Live/Dead−) human (huCD45+) ILCs: after exclusion of cells positive for CD3, CD19, CD14, CD16, FcεRIα, CD34, TCRα/β, TCRγ/δ, and CD294, ILC3s were identified as CD127+CD117+ and selected for NKp44+ (red) or NKp44−NKp46− (dark blue, referred to as NCR−). NK cells were sorted as NKp46+CD127−CD94+ cells (yellow). Shown is a representative spleen sample, magnetic-activated cell sorting (MACS)–depleted for CD19, CD14, CD4, and CD8. (B) Pie charts show mean frequency (±SD) of the indicated populations among ILCs of interest, as defined in panel A, within spleen (N = 26 from 20 human fetal liver [HFL] donors with 2 to 15 mice per donor), small intestine (SI) (N = 12 from 9 HFL donors with 4-15 pooled mice), and pediatric tonsils (N = 16). (C) Mean frequency (±SD) of the indicated populations among huCD45+ cells derived from spleen (N = 3, 1-8 mice per HFL donor) and SI (samples as in panel B). FSC-A, forward scatter area; FSC-H, forward scatter height; SSC-A, side scatter area; TCR, T-cell receptor.
IL-12 and IL-15 induce phenotypic NK-cell markers on ILC3s
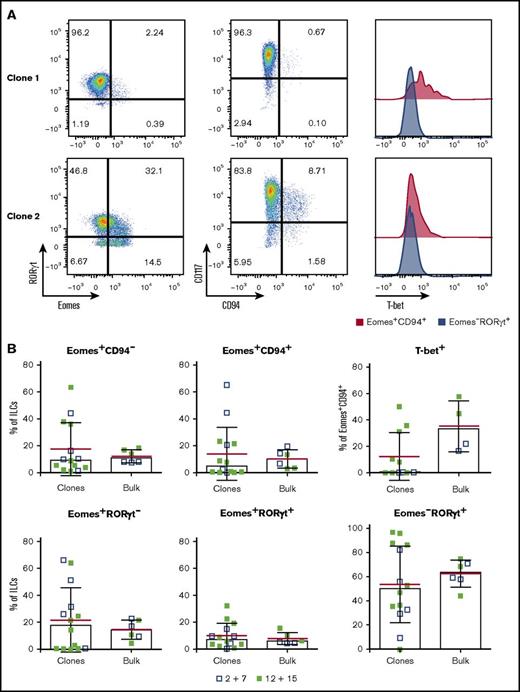
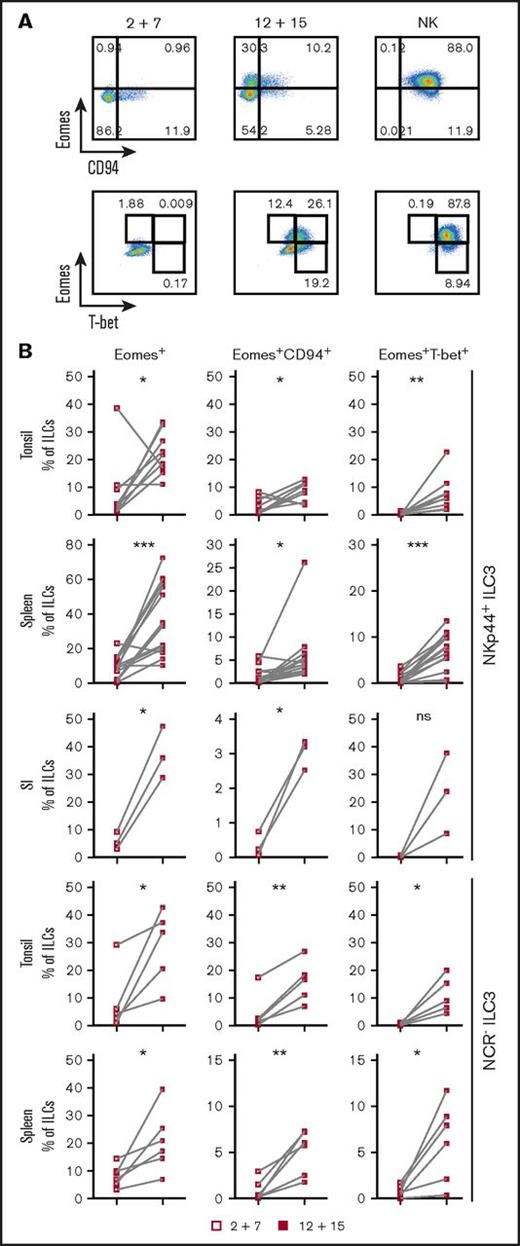
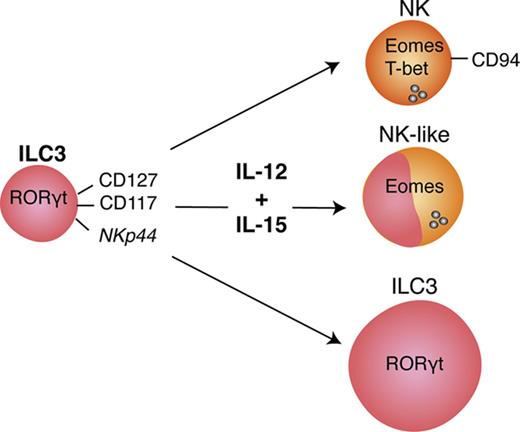
ILC3s show flexibility in their functional program and can shift toward IFNγ production depending on the cytokine milieu.9,10,28,29 Likely because ILC3s and NK cells are generated through mutually exclusive pathways in mice, human ILC3 plasticity toward an NK program has not been extensively investigated. To address this, tonsillar NKp44+ ILC3s were isolated and cultured with IL-2 and IL-7 to obtain sufficient cell numbers for in vitro experiments. After repurification to remove any NK cells, ILC3s were incubated with the type 1 polarizing cytokines IL-2, -12, -15, -18, or combinations thereof. Exposure to IL-12 resulted in a low but consistent increase in CD94+ cells, which also upregulated T-bet and downregulated RORγt. Modulation of the ILC3 profile by IL-12 has been previously demonstrated,9,10 but, in contrast to these studies and mouse data,25 we observed induction of Eomes, a transcription factor associated solely with cytotoxic lymphocytes (supplemental Figure 2A). Although IL-12 and IL-15 alone or in combination promoted differentiation of Eomes+CD94+ cells, additional T-bet induction was primarily observed in IL-12–containing conditions and synergized with IL-15 (supplemental Figure 2B). Hence this cytokine combination was used for further investigations into the properties of differentiated cells. In line with the data from tonsils, cultures of NKp44+ ILC3s derived from huNSG spleen and SI in the presence of IL-12 and IL-15 led to the appearance of bona fide CD94+Eomes+ NK cells (Figure 2; experimental outline shown in supplemental Figure 3A). Similar results were also obtained with NKp44−NKp46−, referred to as NCR−, ILC3s (not tested for SI) (Figure 2). Although Eomes+CD94+ cells were also generated with IL-2 and IL-7, even more so when ILC3s were purified from freshly isolated tonsillar mononuclear cells, additional T-bet induction was more prominent in IL-12 plus IL-15 conditions (supplemental Figure 3B). Thus, IL-2 and IL-15 might have similar roles in this process with differences between cultures generated from fresh and cryopreserved cells, possibly arising from reduced sensitivity to IL-2 or reduced viability of IL-2–responsive ILC3 cells after freezing/thawing. Interestingly, only a fraction of Eomes+ cells coexpressed CD94 or T-bet (Figure 2). Instead, a considerable population retained RORγt expression (supplemental Figure 3C) and thus displayed an intermediate phenotype between ILC3s and NK cells. Furthermore, we observed the same effects in clonal assays. Single ILC3s gave rise to Eomes+CD94− and Eomes+CD94+T-bet± cells and their frequencies were comparable to the bulk cultures, with, however, larger variations. Percentages of Eomes+RORγt−, Eomes+RORγt+, Eomes−RORγt+ cells were also similar between single-cell and bulk cultures (Figure 3). Collectively, IL-12 plus IL-15 stimulation of ILC3s led to the differentiation of phenotypically distinct populations with features of NK cells.
IL-12 and IL-15 induce phenotypic NK-cell markers on ILC3s. NKp44+ and NCR− ILC3s derived from pediatric tonsils or the indicated humanized mouse tissues were cultured with IL-2 plus IL-7 or IL-12 plus IL-15 and analyzed for expression of Eomes, CD94, and T-bet by flow cytometry. Tonsillar and splenic ILC3 cultures were maintained for 3 weeks, intestinal cultures for 4 weeks. (A) Representative flow cytometry plots of expanded tonsillar NKp44+ ILC3s and NK cells, each row gated on viable ILCs. (B) Frequency of the indicated subsets in cultures. For tonsils, N = 9 and N = 5 for NKp44+ and NCR− ILC3s, respectively. For spleen, N = 14 (10 HFL donors, 2-8 mice per donor) and N = 6 (6 HFL donors, 2-8 mice per donor) for NKp44+ and NCR− ILC3s, respectively. For SI, N = 3 (3 HFL donors, 4-5 mice each). not significant (ns), P > .05; *P < .05; **P < .01; ***P < .001 using the paired Student t test.
IL-12 and IL-15 induce phenotypic NK-cell markers on ILC3s. NKp44+ and NCR− ILC3s derived from pediatric tonsils or the indicated humanized mouse tissues were cultured with IL-2 plus IL-7 or IL-12 plus IL-15 and analyzed for expression of Eomes, CD94, and T-bet by flow cytometry. Tonsillar and splenic ILC3 cultures were maintained for 3 weeks, intestinal cultures for 4 weeks. (A) Representative flow cytometry plots of expanded tonsillar NKp44+ ILC3s and NK cells, each row gated on viable ILCs. (B) Frequency of the indicated subsets in cultures. For tonsils, N = 9 and N = 5 for NKp44+ and NCR− ILC3s, respectively. For spleen, N = 14 (10 HFL donors, 2-8 mice per donor) and N = 6 (6 HFL donors, 2-8 mice per donor) for NKp44+ and NCR− ILC3s, respectively. For SI, N = 3 (3 HFL donors, 4-5 mice each). not significant (ns), P > .05; *P < .05; **P < .01; ***P < .001 using the paired Student t test.
Single NKp44+ILC3s give rise to NK-like cells. Single-cell sorted tonsil-derived NKp44+ ILC3s were cultured on irradiated Cell Trace Violet–stained feeders in the presence of IL-2 plus IL-7 or IL-12 plus IL-15 and each well was individually assessed by flow cytometry after 3 weeks. (A) Representative flow cytometry plots of 2 clonal cultures. (B) Comparison between the frequency of the indicated populations in ILC3 clones and the corresponding bulk-sorted cultures. Data from 3 independent donors (mean in red ± SD, bars indicate median).
Single NKp44+ILC3s give rise to NK-like cells. Single-cell sorted tonsil-derived NKp44+ ILC3s were cultured on irradiated Cell Trace Violet–stained feeders in the presence of IL-2 plus IL-7 or IL-12 plus IL-15 and each well was individually assessed by flow cytometry after 3 weeks. (A) Representative flow cytometry plots of 2 clonal cultures. (B) Comparison between the frequency of the indicated populations in ILC3 clones and the corresponding bulk-sorted cultures. Data from 3 independent donors (mean in red ± SD, bars indicate median).
IL-12 and IL-15 culture of ILC3s leads to a transcriptional profile reminiscent of early differentiated NK cells
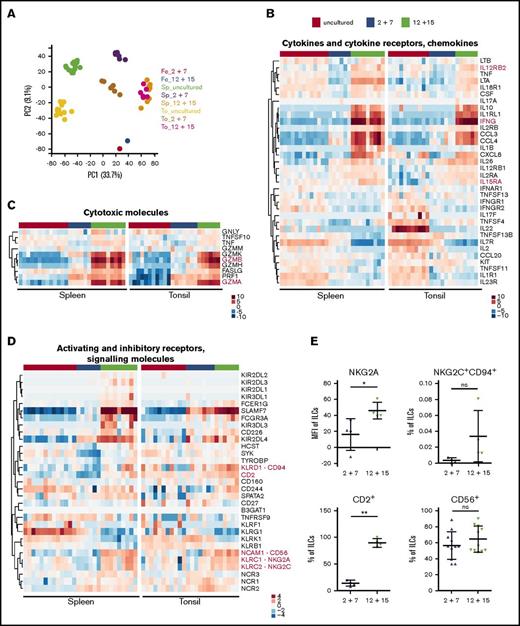
To further study how cytokine treatment modifies the ILC3 profile, we performed RNA-seq of IL-12 plus IL-15–treated cultures of NKp44+ ILC3s in comparison with IL-2 plus IL-7–expanded and untreated cells. Tonsillar- and huNSG-derived splenic NKp44+ ILC3s were used as cell sources. In a principal component analysis, samples formed individual clusters dependent on their tissue origin and cytokine exposure with the exception of those cultured with IL-12 and IL-15 (Figure 4A), which clustered together, indicating that on a transcriptional level this stimulation overrides any tissue-specific differences. For example, we observed that freshly sorted spleen-derived ILC3s had more transcripts for lymphotoxin-α (LTA), lymphotoxin-β (LTB), and tumor necrosis factor (TNF) compared with those isolated from tonsils, which in contrast showed abundant IL22 expression (Figure 4B), in line with a previous report.30 In both populations, we detected expression of IL1R1, IL23R, TNFSF11 (encoding TRANCE), and CCL20, which are genes selectively transcribed in ILC3s among innate lymphocytes.12 Taken together, ILC3s isolated from huNSG spleens were similar to those derived from human tissues, suggesting that huNSG mice recapitulate many aspects of human ILC biology.
Transcriptional profile of ILC3s upon IL-12 and IL-15 culture is reminiscent of early differentiated NK cells. Tonsil (To)- and spleen (Sp)-derived NKp44+ ILC3s were expanded for 3 weeks with IL-2 and IL-7 or IL-12 and IL-15 and together with freshly sorted cells were subjected to RNA-seq. (A) Clustering of samples using the first 2 principal components (PC). Sp_uncultured, N = 13 samples (10 HFL donors, 4-15 mice per donor); Sp_2+7, N = 6 (3 HFL donors, 4 mice per donor); Sp_12+15, N = 9 (6 HFL donors, 4-5 mice per donor); To_uncultured N = 11; To_2+7, N = 7; To_12+15, N = 6. (B-D) Heatmaps depict differential expression of selected genes encoding (B) cytokines/chemokines and cytokine receptors, (C) cytotoxic effector molecules, and (D) activating and inhibitory receptors and signaling molecules. Treatment conditions are color-coded on top: uncultured cells (red), IL-2 and IL-7 (blue), and IL-12 and IL-15 (green). Red text indicates genes of interest. (E) Protein expression of selected markers in IL-2 plus IL-7 and IL-12 plus IL-15 cultures of splenic ILC3s. For quantification (mean ± SD) of NKG2A, NKG2C, and CD2, N = 4 (3 HFL donors, 4 mice per donor); for CD56, N = 11 (7 HFL donors, 2-8 mice per donor). ns, P > .05; *P < .05; **P < .01 using paired Student t test. Fe, feeders alone (pooled from several expansions); MFI, geometric mean fluorescence intensity.
Transcriptional profile of ILC3s upon IL-12 and IL-15 culture is reminiscent of early differentiated NK cells. Tonsil (To)- and spleen (Sp)-derived NKp44+ ILC3s were expanded for 3 weeks with IL-2 and IL-7 or IL-12 and IL-15 and together with freshly sorted cells were subjected to RNA-seq. (A) Clustering of samples using the first 2 principal components (PC). Sp_uncultured, N = 13 samples (10 HFL donors, 4-15 mice per donor); Sp_2+7, N = 6 (3 HFL donors, 4 mice per donor); Sp_12+15, N = 9 (6 HFL donors, 4-5 mice per donor); To_uncultured N = 11; To_2+7, N = 7; To_12+15, N = 6. (B-D) Heatmaps depict differential expression of selected genes encoding (B) cytokines/chemokines and cytokine receptors, (C) cytotoxic effector molecules, and (D) activating and inhibitory receptors and signaling molecules. Treatment conditions are color-coded on top: uncultured cells (red), IL-2 and IL-7 (blue), and IL-12 and IL-15 (green). Red text indicates genes of interest. (E) Protein expression of selected markers in IL-2 plus IL-7 and IL-12 plus IL-15 cultures of splenic ILC3s. For quantification (mean ± SD) of NKG2A, NKG2C, and CD2, N = 4 (3 HFL donors, 4 mice per donor); for CD56, N = 11 (7 HFL donors, 2-8 mice per donor). ns, P > .05; *P < .05; **P < .01 using paired Student t test. Fe, feeders alone (pooled from several expansions); MFI, geometric mean fluorescence intensity.
Despite the spatial principal component analysis proximity of ILC3s stimulated with IL-2 and IL-7 to untreated cells (Figure 4A), IL-2 plus IL-7–expanded cells upregulated EOMES, TBX21, PRF1 (perforin), and transcripts encoding granzymes, in particular, GZMA in tonsils and GZMK in spleen (supplemental Figure 4B-C), indicating that they shifted away from an ILC3 transcriptional program.
When cultured with IL-12 and IL-15, ILC3s upregulated genes that encode NK-related markers such as CD56, CD94, NKG2A, NKG2C, DNAM-1/CD226, and CD2 (Figure 4D). Surprisingly, transcripts for NKG2D (KLRK1) were lower upon IL-12 and IL-15 stimulation compared with unstimulated and IL-2 plus IL-7 conditions. Furthermore, splenic untreated cells already expressed genes encoding the NK-associated receptors 2B4 (CD244), KLRG1, and 4-1BB (TNFRSF9). FCGR3A (CD16) expression was also increased relative to untreated cells, however, it was diverse across samples and tissues and rarely detected on the protein level (data not shown). In contrast, CD56 was found on the majority of cells in both conditions. We also assessed NKG2A, NKG2C, and CD2 expression by flow cytometry and observed upregulation in IL-12 and IL-15–treated ILC3s (Figure 4E). KIR3DL3 expression partially overlapped with that of FCGR3A in spleen and less so in tonsils, whereas other inhibitory killer immunoglobulin-like receptors had a lower and more scattered expression pattern in spleen and were absent in tonsil (Figure 4D top). Hence, IL-12 and IL-15–stimulated ILC3s acquired a profile reminiscent of the previously published early differentiated NK-cell phenotype.31,32 Concurrently, these showed enrichment of genes encoding IFNγ, macrophage inflammatory protein-1α (MIP-1α), MIP-1β, and IL-8 (in spleen) as well as subunits of the IL-2/-12/-15/-18 receptors (Figure 4B), which suggested that IL-12 and IL-15 primed ILC3s toward a type 1 inflammatory response. When examining their cytotoxic potential, we found that untreated splenic ILC3s had low constitutive TNFSF10 (encoding TRAIL) expression, which was unchanged after exposure to IL-12 and IL-15. Conversely, this stimulation elevated TNFSF10 transcripts in tonsillar cells. Furthermore, IL-12 and IL-15 increased EOMES, FASLG, and granzyme expression compared with IL-2 and IL-7–cultured cells, whereas PRF1 levels were similar between the 2 culture conditions (Figure 4C; supplemental Figure 4B). This IL-12 and IL-15–driven differentiation to an NK-cell–like phenotype was further supported by comparison with a previously published transcriptome analysis of ILC3s and NK cells.23 This demonstrated that hallmark functional genes of NK cells correlated with genes upregulated in IL-12 and IL-15–differentiated ILC3 cultures (supplemental Figure 4A). To further characterize the functional properties of NK-cell–like ILC3-derived cells, we next analyzed their response toward leukemic cells.
IL-12 and IL-15 induce type 1 cytokine production in ILC3s
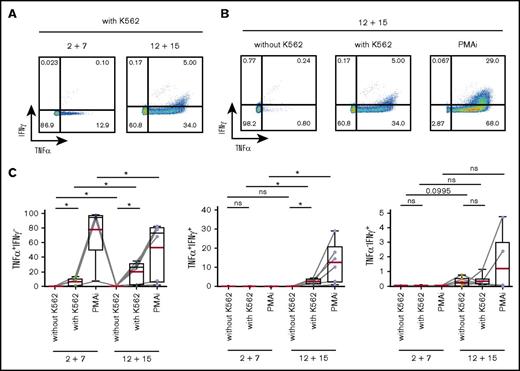
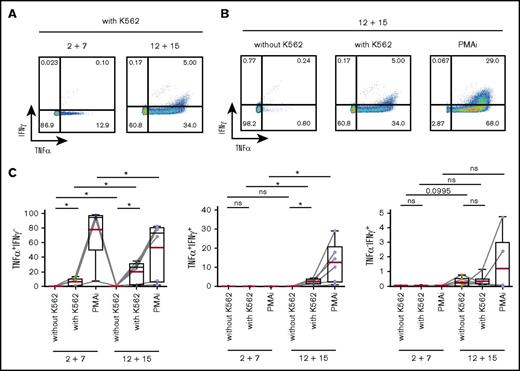
We first assessed the IFNγ and TNFα expression in response to stimulation with a classical NK-cell target, the erythroleukemic cell line K562, as well as with PMA and ionomycin (PMAi). K562 cells induced TNFα, which was detected both in CD117+ and CD117− cells after differentiation (Figure 5; supplemental Figure 5A). In contrast, IFNγ expression was solely observed in IL-12 plus IL-15 cultures and coincubation with K562 cells triggered only a weak IFNγ response in differentiated ILC3s in comparison with that induced by PMAi (Figure 5). Stimulation with IL-23 and IL-1β in addition to PMAi increased IL-22 expression in both splenic and tonsillar ILC3s from either culture (supplemental Figure 5B), further indicating that a fraction of ILC3s maintained their phenotypic and functional program. Altogether, IL-12 and IL-15 induced a type 1 cytokine profile in ILC3s, a finding consistent with previous reports for differentiated ILC3 as well as ILC2 cells.5-10
IL-12 and IL-15 induce a type 1 cytokine profile in ILC3s. Splenic NKp44+ ILC3s, cultured for 4 weeks with IL-2 and IL-7 or IL-12 and IL-15, were stimulated for 4 hours with K562 target cells or PMAi and analyzed for cytokine production. Flow cytometric analysis of IFNγ and TNFα expression in IL-12 and IL-15–treated cells (A-B) and quantification of IFNγ- and/or TNFα-expressing cells in the indicated conditions (C). N = 6 (3 HFL donors, 4 mice per donor). Red lines show mean and box-and-whiskers plot extend minimum (min) to maximum (max) with black lines representing median value. ns, P > .05; *P < .05 using paired Student t tests.
IL-12 and IL-15 induce a type 1 cytokine profile in ILC3s. Splenic NKp44+ ILC3s, cultured for 4 weeks with IL-2 and IL-7 or IL-12 and IL-15, were stimulated for 4 hours with K562 target cells or PMAi and analyzed for cytokine production. Flow cytometric analysis of IFNγ and TNFα expression in IL-12 and IL-15–treated cells (A-B) and quantification of IFNγ- and/or TNFα-expressing cells in the indicated conditions (C). N = 6 (3 HFL donors, 4 mice per donor). Red lines show mean and box-and-whiskers plot extend minimum (min) to maximum (max) with black lines representing median value. ns, P > .05; *P < .05 using paired Student t tests.
Upregulation of the cytotoxic machinery in ILC3s upon IL-12 and IL-15 exposure
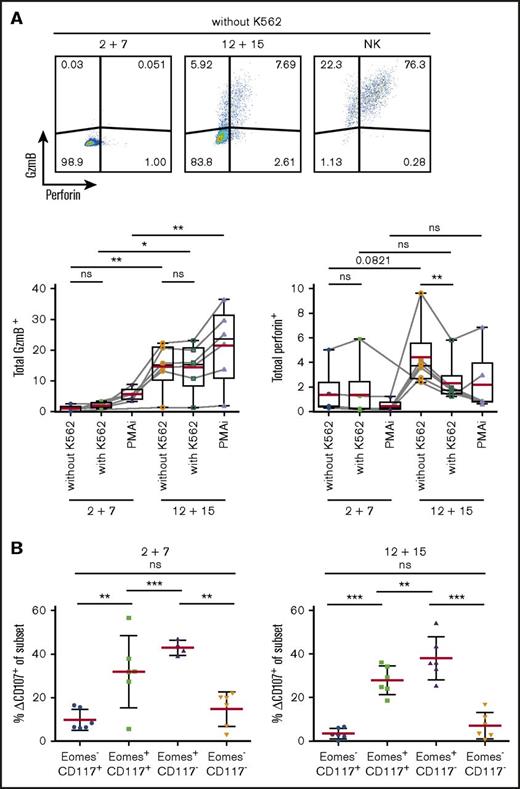
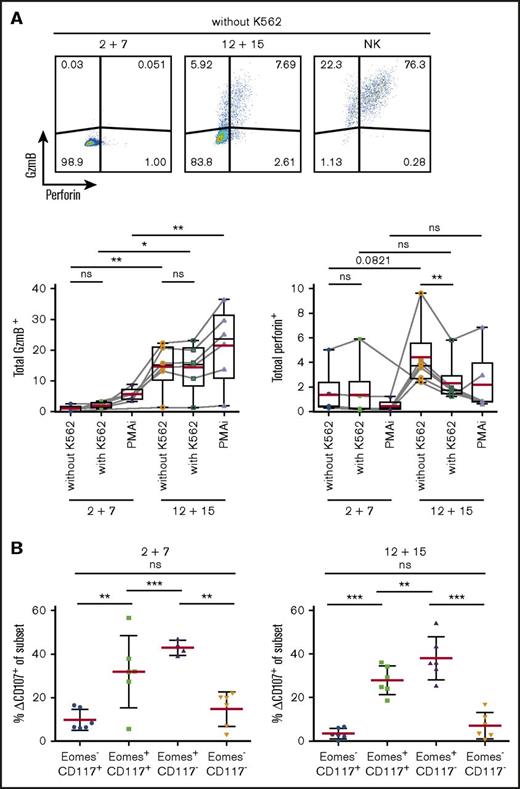
As transcriptional profiling revealed expression of cytotoxic effector molecules, we investigated protein expression of GzmB and perforin in differentially cultured ILC3s (Figure 6A). Surprisingly, perforin was barely detectable in IL-12 and IL-15–treated cells but the addition of K562 cells resulted in a rapid release as indicated by reduced staining. Consistent with abundant mRNA transcripts in IL-12 and IL-15 cultures, GzmB was expressed in significantly more cells at the protein level.
Upregulation of cytotoxic machinery in ILC3s upon IL-12 and IL-15 exposure. Splenic NKp44+ ILC3s were cultured for 4 weeks with IL-2 and IL-7 or IL-12 and IL-15 and stimulated for 4 hours with K562 target cells or PMAi. (A) Flow cytometric analysis (top) and quantification (bottom) of total GzmB or perforin expression in cultures. Fluorescence-activated cell sorting (FACS) plots shown for unstimulated expanded ILC3s and NK cells. Red lines show mean and box-and-whiskers plot extend min to max with black lines representing median value. (B) Degranulation of bulk cultures. Δ%CD107 indicates the difference in degranulation with and without K562 coincubation. N = 6 (3 HFL donors, 4 mice per donor). ns, P > .05; *P < .05; **P < .01; ***P < .001 using the paired Student t test.
Upregulation of cytotoxic machinery in ILC3s upon IL-12 and IL-15 exposure. Splenic NKp44+ ILC3s were cultured for 4 weeks with IL-2 and IL-7 or IL-12 and IL-15 and stimulated for 4 hours with K562 target cells or PMAi. (A) Flow cytometric analysis (top) and quantification (bottom) of total GzmB or perforin expression in cultures. Fluorescence-activated cell sorting (FACS) plots shown for unstimulated expanded ILC3s and NK cells. Red lines show mean and box-and-whiskers plot extend min to max with black lines representing median value. (B) Degranulation of bulk cultures. Δ%CD107 indicates the difference in degranulation with and without K562 coincubation. N = 6 (3 HFL donors, 4 mice per donor). ns, P > .05; *P < .05; **P < .01; ***P < .001 using the paired Student t test.
To investigate the cytolytic potential of ILC3s, we evaluated their capacity to degranulate toward K562 cells. After 4-hour stimulation, degranulation levels in total expanded cells were similar in the 2 conditions (circa 13%) (data not shown). Therefore, we checked CD107 expression among the various subsets (Figure 6B). Eomes+ cells, irrespective of culture conditions, showed higher degranulation ability.
Thus, ILC3s treated with IL-12 and IL-15 acquired cytotoxic granule proteins, associated with Eomes expression, and Eomes+ cells preferentially degranulate in response to leukemic cells.
Cytotoxicity of IL-12 and IL-15–cultured ILC3s toward classical NK-cell targets
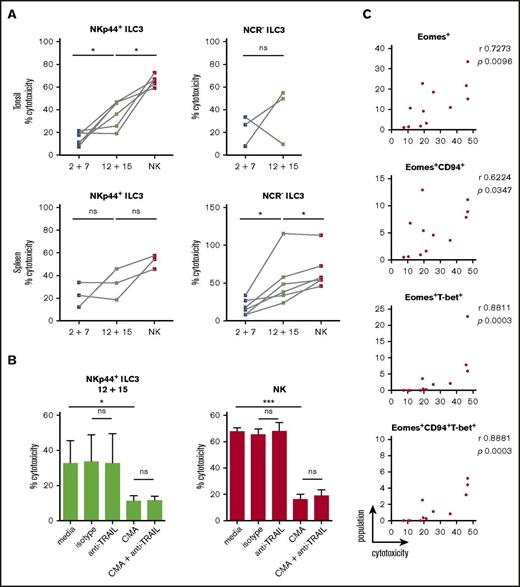
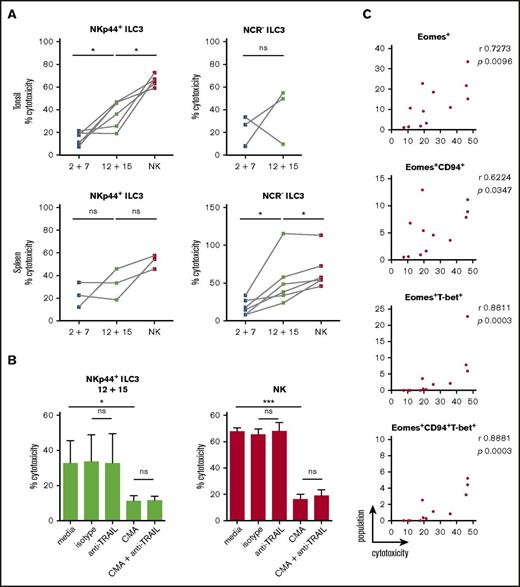
As IL-2 and IL-7–treated cells were devoid of GzmB and perforin protein expression but showed some surface CD107 expression upon K562 coincubation, we directly assessed target cell killing. Differentially stimulated bulk ILC3 cultures were incubated with K562 cells for 18 hours to allow for both perforin-dependent and -independent cytotoxicity, because TRAIL expression was detected at the transcriptional level in some of the differentiated innate lymphocyte cultures. Expanded tonsillar NKp44+ ILC3s acquired a twofold higher cytotoxicity when stimulated with IL-12 and IL-15, whereas NCR− ones showed variability in their cytolytic potential (Figure 7A). Splenic expanded NKp44+ ILC3s from both culture conditions showed moderate cytotoxicity, whereas NCR− ILC3s had a threefold increase in cytolytic activity after IL-12 and IL-15 relative to IL-2 and IL-7 exposure. We analyzed the latter following 4 and 18 hours of coincubation at different E:T ratios (supplemental Figure 6A). Longer coculture at higher E:T ratios enhanced target cell lysis, which reached a similar level compared with NK cells at a 20:1 E:T ratio, despite the heterogeneity of the ILC3 cultures. Thus, IL-12 and IL-15–induced cytolytic activity in ILC3 cells. Similar to NK cells, this cytotoxicity was to a large extent mediated by perforin and granzymes because inhibition with concanamycin A reduced killing of K562 cells by 60%, whereas antibody-mediated blocking of TRAIL did not reduce leukemic cell death (Figure 7B). We did not test blocking of TNF and FasL because we were not able to induce K562 cell death with agonistic reagents that stimulate these pathways (data not shown). In contrast, the T-cell leukemia cell line Jurkat is sensitive to apoptosis-inducing cell death (data not shown), and IL-12 and IL-15–stimulated ILC3s seemed to use numerous mechanisms to induce Jurkat cell death, including but not restricted to perforin, FasL, and TRAIL (supplemental Figure 6B). Therefore, IL-12 and IL-15–differentiated ILC3s seem to use all transcriptionally upregulated cytotoxicity molecules for tumor cell lysis. Next, we aimed to identify the subset of differentiated ILC3s that mediates the cytotoxicity in the K562 cocultures. Considering both tonsillar NKp44+ (Figure 7C) and splenic NCR− (supplemental Figure 6C) ILC3 cultures, the degree of cytotoxicity correlated best with Eomes+T-bet+ cells. Taken together, our data indicated that IL-12 and IL-15 promoted acquisition of both phenotypic and functional traits associated with NK cells, which were strongly associated with the expression of Eomes.
Cytotoxicity of IL-12 and IL-15–cultured ILC3s toward the classical NK-cell target K562 is perforin-mediated. ILC3s were expanded for 3 weeks with IL-2 and IL-7 or IL-12 and IL-15 and the cytolytic potential of bulk cultures against K562 targets was assessed after 18-hour stimulation at a 10:1 E:T ratio using a lactate dehydrogenase (LDH) cytotoxicity assay. (A) Cytotoxicity of expanded tonsillar and splenic NKp44+ and NCR− ILC3s. For tonsils, N = 6 and N = 3 for NKp44+ and NCR− ILC3s, respectively. For spleen, N = 3 and N = 6 for NKp44+ and NCR− ILC3s, respectively; each sample is an individual HFL donor with 2 to 8 mice pooled. Expanded NK cells from the same donors were used as positive controls. (B) Cytolytic activity of IL-12 plus IL-15–expanded tonsillar NKp44+ ILC3s and NK cells in the presence of medium alone, mouse IgG1 isotype, anti-TRAIL antibody, CMA (effectors were preincubated for 2 hours) or a combination of the latter, N = 5 except for the last condition in which data were obtained from 3 donors. (C) Correlation between frequency of the above-stated populations and cytotoxicity for tonsillar NKp44+ ILC3 cultures. ns, P > .05; *P < .05; ***P < .001 using paired Student t test in panels A and B or Spearman correlation in panel C. r, Spearman rank correlation coefficient.
Cytotoxicity of IL-12 and IL-15–cultured ILC3s toward the classical NK-cell target K562 is perforin-mediated. ILC3s were expanded for 3 weeks with IL-2 and IL-7 or IL-12 and IL-15 and the cytolytic potential of bulk cultures against K562 targets was assessed after 18-hour stimulation at a 10:1 E:T ratio using a lactate dehydrogenase (LDH) cytotoxicity assay. (A) Cytotoxicity of expanded tonsillar and splenic NKp44+ and NCR− ILC3s. For tonsils, N = 6 and N = 3 for NKp44+ and NCR− ILC3s, respectively. For spleen, N = 3 and N = 6 for NKp44+ and NCR− ILC3s, respectively; each sample is an individual HFL donor with 2 to 8 mice pooled. Expanded NK cells from the same donors were used as positive controls. (B) Cytolytic activity of IL-12 plus IL-15–expanded tonsillar NKp44+ ILC3s and NK cells in the presence of medium alone, mouse IgG1 isotype, anti-TRAIL antibody, CMA (effectors were preincubated for 2 hours) or a combination of the latter, N = 5 except for the last condition in which data were obtained from 3 donors. (C) Correlation between frequency of the above-stated populations and cytotoxicity for tonsillar NKp44+ ILC3 cultures. ns, P > .05; *P < .05; ***P < .001 using paired Student t test in panels A and B or Spearman correlation in panel C. r, Spearman rank correlation coefficient.
Discussion
Our studies demonstrate that human ILC3s give rise to Eomes+T-bet+/−CD94+/− cytotoxic innate lymphocytes that also express NK-cell receptors like CD56, NKG2A, NKG2C, and CD16. In addition, they produce the hallmark cytokines of NK cells, TNFα and to a lesser extent IFNγ, and upregulate cytotoxic molecules, primarily granzymes. They kill target cells less efficiently than classical NK cells and with slower kinetics. This could be due to the heterogeneity of the differentiated cells, containing smaller subsets of truly cytotoxic lymphocytes. However, these seem to kill with perforin/granzymes, FasL, and TRAIL–mediated cytotoxicity, similar to NK cells. Acquisition of cytolytic traits is augmented by stimulation with IL-12 and IL-15, but ILC3s acquire cytotoxicity also in the presence of IL-2 and IL-7. In light of recent findings, it is possible that Eomes+ cells in NCR− ILC3 cultures arise from tissue-resident CD127+CD117+NKp44− ILC precursors.33 However, we demonstrate that human NKp44+ bona fide ILC3s from secondary lymphoid tissues can develop into functional equivalents of NK cells, and this developmental pathway, which demonstrates many similarities to NK-cell differentiation from stage 3 precursors,17,18 might provide cytotoxic protection at mucosal barriers.
Indeed, the development of innate cytotoxic cells from different cellular sources seems to be occurring at barrier sites. In addition to differentiation from innate lymphocytes, it has been demonstrated that upon IL-15 stimulation, intraepithelial CD8+ T cells exert cytotoxic functions independent of the T-cell receptor (TCR) and mainly via the prototypical activating NK-cell receptor NKG2D.34,35 These cells upregulate, along with NKG2C, NKp46, and NKp44, other NK-cell receptors and can be observed in the gut of celiac disease patients. Similarly, in the mouse, skin intraepithelial lymphocytes, especially dendritic epidermal T cells, mediate their function through target recognition via NKG2D.36,37 Signaling through their TCR was attenuated at these sites and seemed to be required for survival, whereas they efficiently secreted IFNγ after stimulation with IL-12 and IL-18, with and without IL-15 addition. TCR downregulation might also have resulted in a proportion of putative ILC1 cells because they were recently found to partially overlap with T-cell phenotypes in mass cytometry11 and carry transcripts for TCR variable regions by single-cell gene expression profiling.12 In addition to the emergence of NK-cell–like populations from adaptive lymphocytes or ILC3s, as described here, inflammation has been shown to drive differentiation of NK cells even in Rag2−/−Il2Rγ−/− mice and thus in the absence of IL-15 signaling.38 Similar to our study, this is induced by IL-12 and despite their immature profile, these unconventional NK cells mediate tumor suppression.
The upregulation of a cytotoxic machinery in cells traditionally seen as noncytotoxic is not exclusive to ILC3s. Adaptive CD4+ Th cells can also upregulate cytotoxicity, especially during chronic viral infections.39-41 As shown for ILC3 differentiation in this study, Eomes expression seems to be required for CD4+ T cells to acquire cytotoxicity42-44 and these cytolytic CD4+ T cells also upregulate CD94 and NKG2A.45,46 However, in contrast to induction of cytotoxicity via IL-12, mainly IL-2 has been implicated in this process.43 Thus, Eomes-dependent cytotoxicity can be induced in both innate and adaptive lymphocyte populations, and type 1–inducing proinflammatory conditions favor its development.
These considerations suggest that an immunologically important effector function, like Eomes-dependent cytotoxicity, can develop in a variety of innate and adaptive lymphocyte populations due to inflammatory conditions, such as, for example, chronic viral infections. According to our data, ILC3s are not exempt from differentiation to cytotoxic NK-cell–like lymphocytes, primarily after stimulation with IL-12 and IL-15. They might even be exceptionally well localized at mucosal barriers to exert cytotoxicity against virus-infected and tumor cells at these sites and could be harnessed during vaccination by the right choice of adjuvant.
The full-text version of this article contains a data supplement.
Acknowledgments
Calculations were performed at the sciCORE (http://scicore.unibas.ch/) scientific computing core facility at the University of Basel.
This work was supported in part by Cancer Research Switzerland (KFS-3234-08-2013 and KFS-4091-02-2017), Worldwide Cancer Research (14-1033), SPARKS (15UOZ01), KFSPMS and KFSPHHLD of the University of Zurich, the Sobek Foundation, the Susy Rückert Foundation and Stiftung für das krebskranke Kind, the Swiss Vaccine Research Institute, the Swiss Multiple Sclerosis Society, and the Swiss National Science Foundation (310030_162560 and CRSII3_160708).
Authorship
Contribution: A.R., P.C., V.L., F.M.L., and I.Q. planned and performed the experiments; R.I. analyzed the RNA-seq data; J.D.L., D.F., and G.F. supervised the study; and A.R., O.C., and C.M. designed the study and wrote the manuscript.
Conflict-of-interest disclosure: The authors declare no competing financial interests.
Correspondence: Christian Münz, Viral Immunobiology, Institute of Experimental Immunology, University of Zürich, Winterthurerstr 190, 8057 Zürich, Switzerland; e-mail: christian.muenz@uzh.ch.

![Figure 1. ILC3s in pediatric tonsils and spleens of huNSG mice. (A) Sorting strategy for isolation of viable (Aqua Live/Dead−) human (huCD45+) ILCs: after exclusion of cells positive for CD3, CD19, CD14, CD16, FcεRIα, CD34, TCRα/β, TCRγ/δ, and CD294, ILC3s were identified as CD127+CD117+ and selected for NKp44+ (red) or NKp44−NKp46− (dark blue, referred to as NCR−). NK cells were sorted as NKp46+CD127−CD94+ cells (yellow). Shown is a representative spleen sample, magnetic-activated cell sorting (MACS)–depleted for CD19, CD14, CD4, and CD8. (B) Pie charts show mean frequency (±SD) of the indicated populations among ILCs of interest, as defined in panel A, within spleen (N = 26 from 20 human fetal liver [HFL] donors with 2 to 15 mice per donor), small intestine (SI) (N = 12 from 9 HFL donors with 4-15 pooled mice), and pediatric tonsils (N = 16). (C) Mean frequency (±SD) of the indicated populations among huCD45+ cells derived from spleen (N = 3, 1-8 mice per HFL donor) and SI (samples as in panel B). FSC-A, forward scatter area; FSC-H, forward scatter height; SSC-A, side scatter area; TCR, T-cell receptor.](https://ash.silverchair-cdn.com/ash/content_public/journal/bloodadvances/1/27/10.1182_bloodadvances.2017008839/3/m_advances008839f1.jpeg?Expires=1769244801&Signature=MpYMy8ex3QDVbAqwYFdcucImOUlSVmFdk5yjLIViFRverw52EtZ-4J9n-JXnCPp2b~vVBOZ-Ziu-SCY4wJgPRuTjFmalWqhUkSViYjYTlJYnkTCUy2I90fWWDqtZnV49v1tSKAMrk8088WD1HtiZ7F68WmI6H-7SkfNParrL9qMRNMcBqMNP7U3IXLr97D-r7Eqgxhz9QbExtUFq8YzsMQmoeABfRzq4pyCzX~wl8Y01XJ5YJN3eFJs4ffZp64Nv2Qf4-DEx1CMHup9LGdZtiMctG7BX5kA1NWbSvVsBSO1lvmCp7bP9Aryn6YvgIl6uo1fDesLh6HM3t1U4HTcpiA__&Key-Pair-Id=APKAIE5G5CRDK6RD3PGA)


![Figure 1. ILC3s in pediatric tonsils and spleens of huNSG mice. (A) Sorting strategy for isolation of viable (Aqua Live/Dead−) human (huCD45+) ILCs: after exclusion of cells positive for CD3, CD19, CD14, CD16, FcεRIα, CD34, TCRα/β, TCRγ/δ, and CD294, ILC3s were identified as CD127+CD117+ and selected for NKp44+ (red) or NKp44−NKp46− (dark blue, referred to as NCR−). NK cells were sorted as NKp46+CD127−CD94+ cells (yellow). Shown is a representative spleen sample, magnetic-activated cell sorting (MACS)–depleted for CD19, CD14, CD4, and CD8. (B) Pie charts show mean frequency (±SD) of the indicated populations among ILCs of interest, as defined in panel A, within spleen (N = 26 from 20 human fetal liver [HFL] donors with 2 to 15 mice per donor), small intestine (SI) (N = 12 from 9 HFL donors with 4-15 pooled mice), and pediatric tonsils (N = 16). (C) Mean frequency (±SD) of the indicated populations among huCD45+ cells derived from spleen (N = 3, 1-8 mice per HFL donor) and SI (samples as in panel B). FSC-A, forward scatter area; FSC-H, forward scatter height; SSC-A, side scatter area; TCR, T-cell receptor.](https://ash.silverchair-cdn.com/ash/content_public/journal/bloodadvances/1/27/10.1182_bloodadvances.2017008839/3/m_advances008839f1.jpeg?Expires=1769305359&Signature=ekt~edXHIZ4oUS2xKzzFkJl-FLGLcA~odsbcSF22ddYxRQ-cUtR4C8zlFeqE0vjH6cGE2nlF6O03PO4oKqpYpgvDBYcwDzq~07cq9GK5ynUsn6KLelS0l5lnYSWsaZ4ixNAwfteIJ27Seh258novZe9mUdmN0awC3wFpcQjg46Vh0CnAnnNEI--JTUV-z7KyCEiEEyZDEiXAIt9SXPeHB277yC4lsa2SHWENR00AZDFLE-I0Svd3UQa7Djk3WAWfFsGaXuVXNrf2~3nyqZOO70xrhZn8QPDCH8n~D~R3xhXwn8crmaLlyZu3v0HpOO74auJPyuWnLLQgWX7vVYTMVQ__&Key-Pair-Id=APKAIE5G5CRDK6RD3PGA)

