Key Points
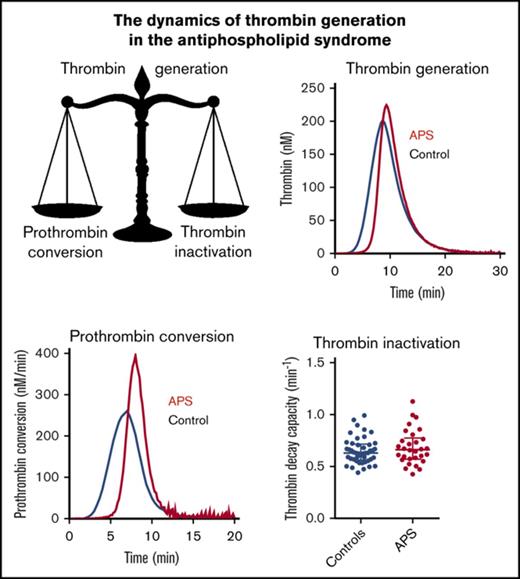
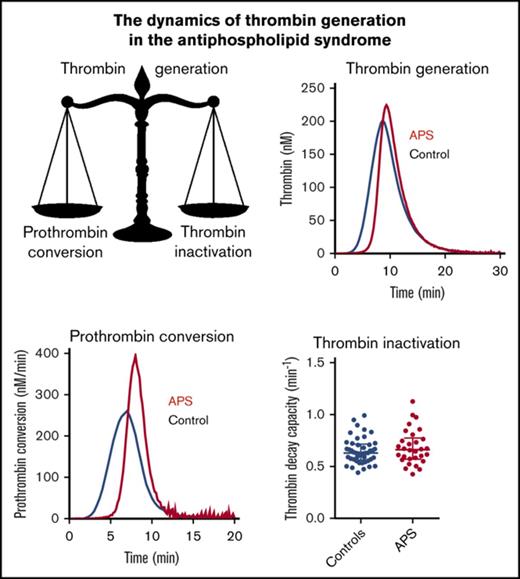
The rate of prothrombin conversion is elevated in APS patients, causing a hemostatic imbalance.
TG and prothrombin conversion are higher in APS patients with prior thrombosis than in patients without thrombosis.
Abstract
Antiphospholipid syndrome (APS) is a condition in which the presence of antibodies against phospholipid-binding proteins is associated with thrombophilia and/or pregnancy morbidity. Although antiphospholipid antibodies have anticoagulant characteristics in vitro, they are associated with thromboembolic complications. Thrombin generation (TG) is a sensitive global test of coagulation, and elevated TG is associated with thrombosis. Increased TG can be caused by increased prothrombin conversion, decreased thrombin inactivation, or a combination of both. In this study, we measured TG in APS patients and healthy controls with and without vitamin K antagonist (VKA) treatment at 1 and 5 pM tissue factor and with thrombomodulin. Prothrombin conversion and thrombin inactivation were determined by thrombin dynamics analysis. The TG peak was increased in nontreated APS patients at 1 pM TF compared with nontreated controls. Prothrombin conversion was significantly increased in nontreated APS patients. In contrast, prothrombin conversion did not differ in controls and patients that were on VKA therapy. Thrombin inactivation was comparable between controls and APS patients in the presence and absence of VKAs. Both TG (peak and ETP) and prothrombin conversion were significantly higher in APS patients with prior thrombosis compared with patients without a history of thrombosis. In this study, we demonstrate that in APS, the hemostatic balance shifts toward a more prothrombotic phenotype due to elevated prothrombin conversion but unchanged thrombin inactivation rates. Within the group of APS patients, increased TG and prothrombin conversion are associated with a history of thrombosis.
Introduction
Antiphospholipid syndrome (APS) is a condition in which the presence of antiphospholipid antibodies is associated with thrombosis and/or pregnancy morbidity.1 Antiphospholipid antibodies are directed against plasma proteins with affinity for anionic phospholipids, with β2-glycoprotein I (β2GPI) as most accepted antigen. Although antiphospholipid antibodies have anticoagulant characteristics in vitro, antiphospholipid antibodies are associated with thromboembolic complications.2-4
Thrombin generation (TG) is a global coagulation test that correlates with both bleeding5-7 and thrombotic8-10 indications. In APS patients, the endogenous thrombin potential (ETP) has been shown to be lower or comparable to healthy subjects,11,12 regardless of the elevated risk of thrombosis in APS. The lag time and time-to-peak have been shown to be prolonged,11,13 which is in line with the distinctive prolongation of clotting times, known as the lupus anticoagulant (LA) effect.
TG can be increased by an elevation of prothrombin conversion, a reduction of thrombin inhibition, or a combination of both.14 Thrombin dynamics analysis is a novel add-on analysis method that uses an algorithm-based approach to study the pro- and anticoagulant processes of TG. Kinetic modeling of thrombin inactivation allows us to split a TG curve into its 2 main underlying processes: prothrombin conversion and thrombin inactivation. In the current study, we measured TG, prothrombin conversion, and thrombin inactivation in APS patients to investigate the balance between pro- and anticoagulant processes and pinpoint mechanistic changes to the pro- and anticoagulant pathways.
Vitamin K antagonist (VKA) therapy is used to reduce the risk of recurrence of thrombosis in APS patients. VKAs reduce the plasma levels of procoagulant factors II, VII, IX, and X and anticoagulant factors protein C and protein S. The activated protein C (APC) pathway is an important inhibitory mechanism of in vivo TG. This mechanism is set into action by binding of thrombin to thrombomodulin (TM). The thrombin-TM complex activates protein C into a potent inactivator of both factor Va (FVa) and FVIIIa and causes the attenuation of TG. The efficiency of the APC system can be investigated by measuring TG in the presence of TM. The sensitivity to the APC system is diminished in APS patients, as patients show a decreased response to both the addition of APC11-13,15,16 and TM.15 However, it remains unclear if this resistance to APC contributes to the elevated risk of thrombosis in APS.
In this study, we quantified thrombin generation, prothrombin conversion and thrombin inactivation (applying thrombin dynamics) in APS patients with and without VKA therapy. We hypothesized that the prothrombotic phenotype associated with APS is caused by differences in the dynamics of TG by comparing the results of APS patients to matched control subjects. Additionally, we investigated the relationship between TG and thrombin dynamics parameters without and with a history of thrombosis.
Methods
Patients and sample handling
Eighty patients with APS were included in the study after approval by the local ethics committee and after obtaining informed consent in accordance with the declaration of Helsinki. All APS patients meet both the clinical criteria (either a history of thrombosis and/or several well-defined gestational complications) and the experimental criteria (LA and/or anticardiolipin antibodies and/or β2GPI antibodies. None of the patients were pregnant at the time of the blood draw, and blood was drawn at least 4 months after a thrombotic event or pregnancy to ensure that these events did not influence the results. More than half of the APS patients (62.5%) were treated with VKAs. Age- and gender-matched healthy control subjects and patients on VKA therapy (other indications than APS) were enrolled in the study after informed consent was obtained. Female subjects taking oral contraceptives were excluded from the control group, and APS patients had no combined estrogen contraception. Blood was collected on 3.2% citrate in a 9:1 ratio for the preparation of platelet poor plasma. Platelet-poor plasma was prepared by centrifuging twice at 2821g for 10 minutes and stored at −80°C until further use.
Materials
The fluorescent substrate, ZGGR-AMC (Z-Gly-Gly-Arg-7-amino-4-methylcoumarin), was purchased at Bachem (Basel, Switzerland) and dissolved in dimethyl sulfoxide. Calibrator (thrombin-α2 macroglobulin [α2M] complex) was prepared as described by Hemker et al.17 Recombinant tissue factor (TF) from Diagnostica Stago was used. Procoagulant phospholipids (PLs), which contained 60% dioleoyl phosphatidylcholine, 20% dioleoyl phosphatidylserine, and 20% dioleoyl phosphatidylethanolamine, were prepared as described elsewhere.18 The chromogenic thrombin substrate (S2238) was synthesized in-house. Unfractionated heparin and bovine serum albumin were purchased at Sigma-Aldrich. Bovine thrombin was purified in-house as described by Church et al19 and bovine antithrombin (AT) according to the protocol of Thaler et al.20 Staphylocoagulase was purified in house as described by Hendrix et al.21 Recombinant human TM was a kind gift of Asahi Kasei Pharma.
Coagulation factor determinations
APS specific laboratory tests
The presence of aPL was defined as positivity for LA and/or anticardiolipin (aCL) and/or β2GPI determined by enzyme-linked immunosorbent assays (ELISAs).24 LA was assessed according to the 3-step guidelines of the Subcommittee on LA of the International Society on Thrombosis and Haemostasis using partial thromboplastin time LA and dilute Russel’s Viper VenomTime reagents.25,26 In all patients, aCLs were tested by ELISA.27 Briefly, for anti-β2GPI antibody detection,28 MaxiSorp microplates (Nunc, Roskilde, Denmark) coated with human β2GPI (Diagnostica Stago, Asnières, France) were used and blocked with 0.1% gelatin in Tris-buffered saline (pH 7.4). Sera were diluted 1:50 in 0.1% gelatin in Tris-buffered saline with 0.1% Tween and used in 50-μL aliquots for the assay. Peroxidase-conjugated goat anti-human immunoglobulin G (IgG) (AHI 1304; Bio Source, Camarillo, CA) and IgM (AHI 1604; Bio Source) was then added and a color was developed using o-phenylenediamine (Sigma, St. Louis, MO) solution containing H2O2. The reaction was stopped by adding 2N H2SO4, and optical density was measured at 492 nm. The cutoff was set at the 99th percentile of the control population values (>100 healthy volunteers). IgG aCL and IgG anti-β2GPI antibody assays were highly correlated (intraclass correlation coefficient = 0.92 [95% confidence interval, 0.87-0.95], P < .0001).
TG
Calibrated automated thrombinography was performed as previously described.17 Briefly, all wells contained 20 µL TF/PL mix (1 or 5 pM TF and 4 μM PL final concentration [f.c.]) or 20 µL calibrator. The 5 pM TF trigger was used to test the function of mainly the extrinsic and common pathway of coagulation, whereas the lower 1 pM TF trigger makes the measurement more sensitive to the intrinsic pathway (eg, coagulations factors FVIII and FIX).29 Eighty microliters of patient plasma was added to each well. TG was initiated by the addition of 20 µL ZGGR-AMC (417 µM f.c.) and CaCl2 (16.7 mM f.c.). Recombinant soluble TM (20 nM f.c., which inhibits the peak height in pooled normal plasma by 50%) was added to test the sensitivity to the APC system. The TG fluorescence data were converted to TG curves, as described elsewhere,30 and used to perform additional computational analysis to extract prothrombin conversion curves.22
Thrombin dynamics
The TG curve is the net result of prothrombin conversion and thrombin inactivation. As a result, the course of prothrombin conversion can be calculated if TG and thrombin inactivation are known, as described in detail below.
Computation of thrombin inactivation
Thrombin inactivation was predicted by the previously described and validated computational model.22,31-33 This model consists of a set of ordinary differential equations, which describe the rate of thrombin inactivation in time based on the plasma AT, α2M, and fibrinogen level and the free thrombin concentration at each point in time (equations 1-3).
The amount of thrombin that is free in solution (Tfree) depends on the amount of thrombin substrate that is present, and rate constants for the inactivation of thrombin by AT (kAT) and α2M (kαM) are dependent on the plasma fibrinogen level, as described in more detail elsewhere.22 The thrombin decay capacity is the pseudo–first-order decay constant for thrombin that combines the overall effect of thrombin inactivation by AT and α2M.
Computation of prothrombin conversion
At any moment during the course of the TG process, the thrombin concentration (ie, the TG curve) is the net result of prothrombin conversion and thrombin inactivation. Therefore, the course of prothrombin conversion (d(P)/dt) can be calculated from the TG curve ([T]t) and the inactivation rate of thrombin at a specific thrombin concentration (d(T-inh)/dt) (equation 4). With the previously described model for thrombin inactivation we can calculate the thrombin inactivation rate at each time point during TG (equation 5), because the thrombin concentration can be obtained from the TG curve at each time point and the plasma levels of AT, α2M, and fibrinogen, which were determined experimentally.
The prothrombin conversion curve is quantified by its area under the curve (AUC), which translates to the total amount of prothrombin converted throughout the TG experiment, and the peak height of the prothrombin conversion curve (PCtot), which is the maximum prothrombin conversion rate (ie, the maximum activity of the prothrombinase complex [PCmax]).
Statistics
Quantitative data are presented as the median with interquartile range. The data distribution was checked with a Shapiro-Wilk test and groups were compared with a 2-sided Student t test or a Mann-Whitney U test accordingly. P < .05 was considered significant. Graphpad Prism (version 5, GraphPad Software) was used to perform analyses.
Results
The study population consisted of 80 APS patients, of whom 50 were on VKA and 30 did not receive anticoagulant therapy (Table 1). Seventy-six age- and sex-matched controls were enrolled in the study (45 healthy control subjects and 31 control subjects on VKAs). In the APS group, 26 patients (33%) were diagnosed with systemic lupus erythematosus according to the American College of Rheumatology criteria, and 54 and 26 patients were classified as primary and secondary APS. LA was present in 78% of APS patients, and anti-β2GPI and anti-cardiolipin antibodies were found in 61% and 84% of the patients, respectively. Thrombosis occurred in 69 APS patients (86%) as arterial, venous, or small vessel thrombosis, and pregnancy complications were reported in 18 female APS patients (30%).
TG
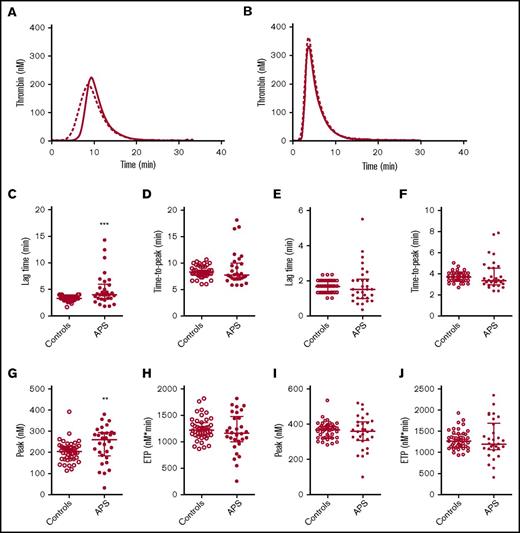
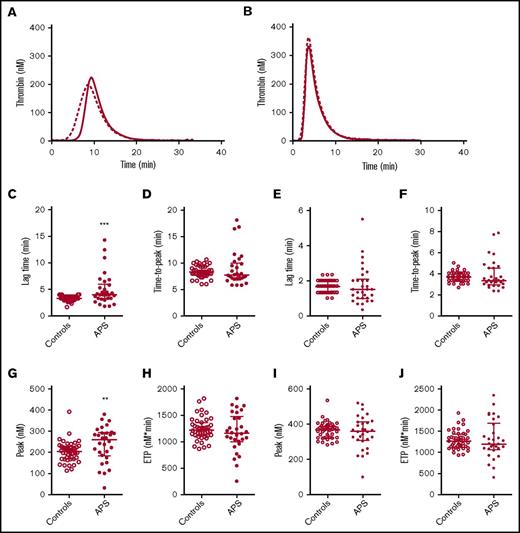
TG was quantified by the lag time, ETP, peak height, and time to peak. Compared with matched controls, we found the lag time to be prolonged in APS patients without VKA therapy and the peak height was increased when TG was measured at 1 pM TF, but not at 5 pM TF (Figure 1). The ETP and time to peak did not differ between APS patients and controls. No significant differences in TG were found between controls and APS patients on VKA therapy (supplemental Figure 1).
TG in APS patients and controls. Average TG curves are shown for healthy controls (dashed line) and APS patients (continuous line) at 1 (A) and 5 (B) pM TF. TG parameters lag time (C,E), time-to-peak (D,F), peak height (G,I), and ETP (H,J) were quantified for 1 and 5 pM TG curves, respectively. ***P < .001, **P < .01 according to a 2-sided Mann-Whitney U test.
TG in APS patients and controls. Average TG curves are shown for healthy controls (dashed line) and APS patients (continuous line) at 1 (A) and 5 (B) pM TF. TG parameters lag time (C,E), time-to-peak (D,F), peak height (G,I), and ETP (H,J) were quantified for 1 and 5 pM TG curves, respectively. ***P < .001, **P < .01 according to a 2-sided Mann-Whitney U test.
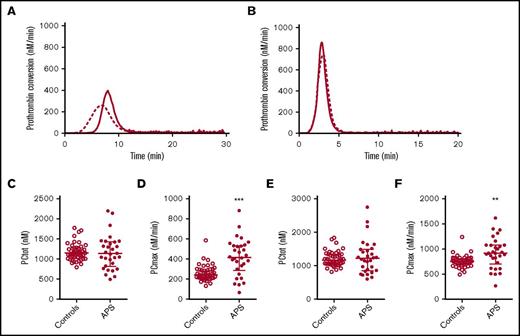
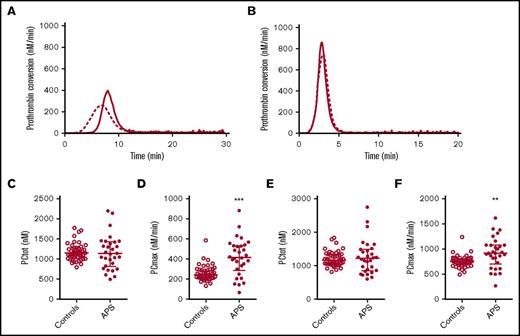
Prothrombin conversion in APS patients and controls. Average prothrombin conversion curves are shown for healthy controls (dashed line) and APS patients (continuous line) at 1 (A) and 5 (B) pM TF. Prothrombin conversion parameters for the total amount of prothrombin converted (PCtot; C,E) and maximum rate of prothrombin conversion (PCmax; D,F) were quantified for 1 and 5 pM TG curves, respectively. ***P < .001, **P < .01 according to a 2-sided Mann-Whitney U test.
Prothrombin conversion in APS patients and controls. Average prothrombin conversion curves are shown for healthy controls (dashed line) and APS patients (continuous line) at 1 (A) and 5 (B) pM TF. Prothrombin conversion parameters for the total amount of prothrombin converted (PCtot; C,E) and maximum rate of prothrombin conversion (PCmax; D,F) were quantified for 1 and 5 pM TG curves, respectively. ***P < .001, **P < .01 according to a 2-sided Mann-Whitney U test.
Prothrombin conversion
Thrombin dynamics analysis was applied to study prothrombin conversion and thrombin inactivation in APS patients to further assess differences in their coagulation status. Figure 2 shows the average prothrombin conversion curves of healthy controls and APS patients without VKA therapy. Prothrombin conversion curves were quantified by the total amount of prothrombin converted (PCtot; AUC) and the maximum rate of prothrombin conversion (PCmax; peak height). The amount of converted prothrombin did not differ between healthy controls and nontreated APS patients at 1 or 5 pM TF, and VKA therapy reduced the amount of converted prothrombin to a similar extent in patients and controls (supplemental Figure 2). However, compared with healthy controls the maximum rate of prothrombin conversion was significantly increased in nontreated APS patients at both 1 and 5 pM TF. In VKA-treated APS patients we only observed an increased prothrombin conversion when TG was triggered with 5 pM TF. Additionally, the plasma levels of prothrombin were increased in both the anticoagulated (+265%) as the untreated APS patients (+36%) compared with their matched controls.
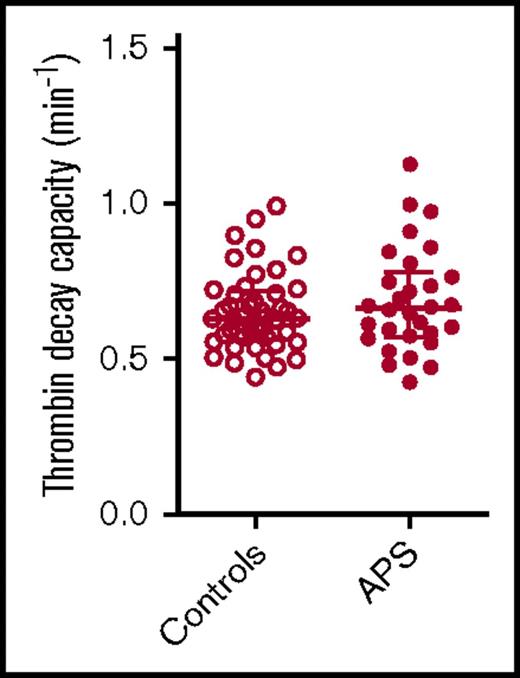
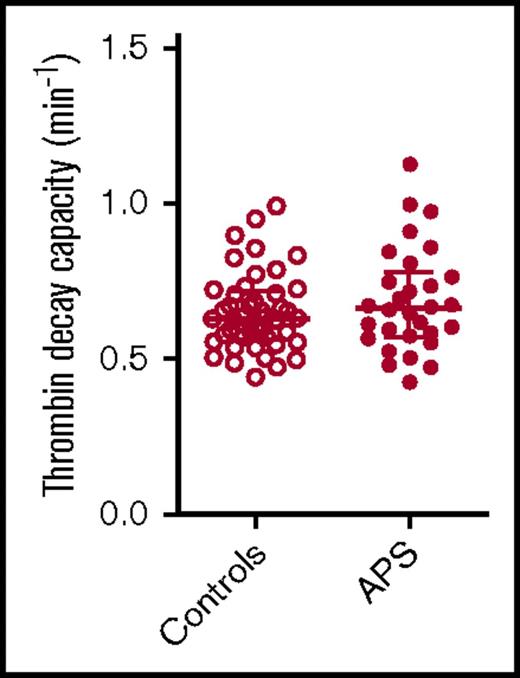
Thrombin decay capacity in APS patients and control subjects. Thrombin decay capacity was assessed in healthy control subjects and APS patients without VKA therapy. No significant differences were detected between groups using a 2-sided Mann-Whitney U test.
Thrombin decay capacity in APS patients and control subjects. Thrombin decay capacity was assessed in healthy control subjects and APS patients without VKA therapy. No significant differences were detected between groups using a 2-sided Mann-Whitney U test.
Thrombin inactivation
The thrombin decay capacity enables the quantification of the ability of a plasma sample to inactivate free thrombin by plasmatic thrombin inhibitors, such as AT and α2M. The thrombin decay capacity did not differ between controls and APS patients (Figure 3), independent of VKA treatment (data not shown). This is in line with our finding that the plasma levels of the main determinants of thrombin inactivation (AT [2.20 ± 0.49 μM in control subjects vs 2.33 ± 0.57 μM in APS patients], α2M [3.38 ± 0.68 μM vs 3.52 ± 1.08 μM], and fibrinogen [3.24 ± 0.65 g/L vs 3.10 ± 0.69 g/L]) did not differ significantly between APS patients and control subjects.
Sensitivity to the APC system
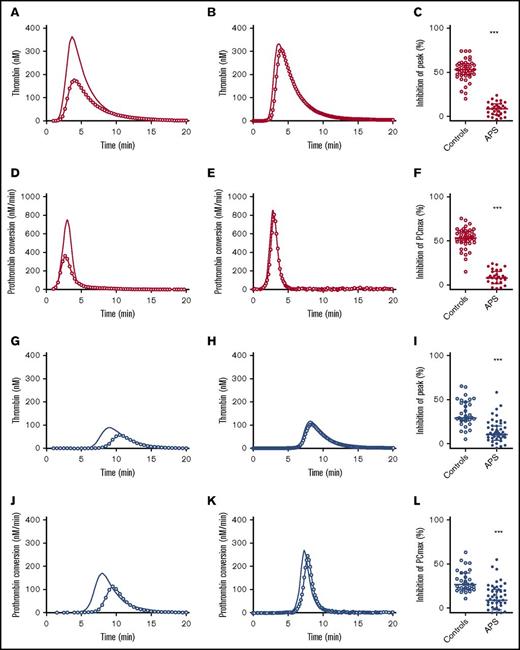
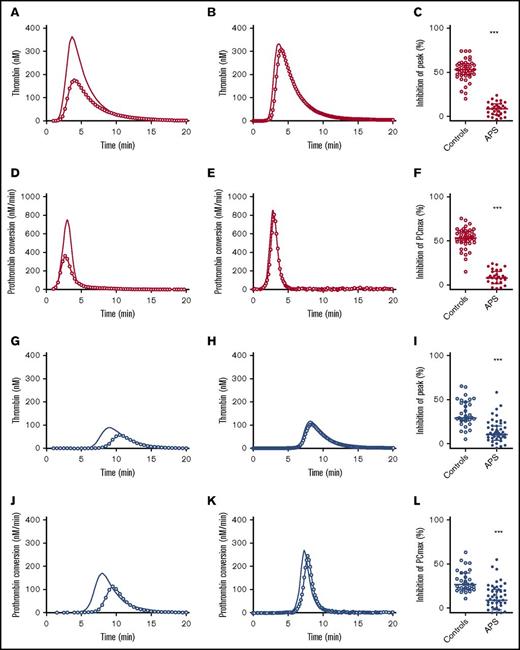
The APC pathway is an important anticoagulant mechanism, which is in vivo triggered by vessel wall bound TM that together with thrombin activates protein C, which in turn inhibits procoagulant FVa and FVIIIa. The APC system in APS patients was assessed by adding 20 nM TM to the TG assay in addition to 5 pM TF. Figure 4 shows the inhibition of TG and prothrombin conversion by TM in controls subjects and patients. The effect of TM was quantified as the percentage inhibition of the TG peak height. Healthy controls showed a 50% inhibition of peak height upon TM addition, whereas in APS patients without anticoagulants, an average inhibition of only 10% was reached (P < .001). In VKA-treated control patients, TM caused an inhibition of the peak height of ∼35%, in contrast to only a 15% reduction in APS patients on VKA treatment (P < .001). Additionally, TM caused a reduction of PCmax of 52% in healthy controls and a 30% reduction in control subjects on VKA treatment. In contrast, APS patients with or without VKA therapy showed less inhibition of PCmax by TM (−10% compared with the condition without added TM; P < .001).
Thrombomodulin sensitivity of TG and thrombin dynamics in healthy subjects and APS patients with (blue) or without VKA treatment (red). (A-C) The inhibition of TG (continuous line) by 20 nM TM (line with circle symbols) was measured in healthy controls (A) and APS patients without VKAs (B). The effect of TM was quantified as the percentage inhibition of TG peak height (C). (D-F) The inhibition of prothrombin conversion (continuous line) by 20 nM TM (line with circle symbols) was measured in healthy controls (D) and APS patients without VKAs (E). The effect of TM was quantified as the percentage inhibition of PCmax (F). (G-I) The inhibition of TG (continuous line) by 20 nM TM (line with circle symbols) was measured in controls on VKA (G) and APS patients on VKAs (H). The effect of TM was quantified as the percentage inhibition of TG peak height (I). (J-L) The inhibition of prothrombin conversion (continuous line) by 20 nM TM (line with circle symbols) was measured in controls on VKA (J) and APS patients on VKAs (K). The effect of TM was quantified as the percentage inhibition of PCmax (L). ***P < .001 compared with the control group using a 2-sided Mann-Whitney U test.
Thrombomodulin sensitivity of TG and thrombin dynamics in healthy subjects and APS patients with (blue) or without VKA treatment (red). (A-C) The inhibition of TG (continuous line) by 20 nM TM (line with circle symbols) was measured in healthy controls (A) and APS patients without VKAs (B). The effect of TM was quantified as the percentage inhibition of TG peak height (C). (D-F) The inhibition of prothrombin conversion (continuous line) by 20 nM TM (line with circle symbols) was measured in healthy controls (D) and APS patients without VKAs (E). The effect of TM was quantified as the percentage inhibition of PCmax (F). (G-I) The inhibition of TG (continuous line) by 20 nM TM (line with circle symbols) was measured in controls on VKA (G) and APS patients on VKAs (H). The effect of TM was quantified as the percentage inhibition of TG peak height (I). (J-L) The inhibition of prothrombin conversion (continuous line) by 20 nM TM (line with circle symbols) was measured in controls on VKA (J) and APS patients on VKAs (K). The effect of TM was quantified as the percentage inhibition of PCmax (L). ***P < .001 compared with the control group using a 2-sided Mann-Whitney U test.
APS patients with and without a history of thrombosis
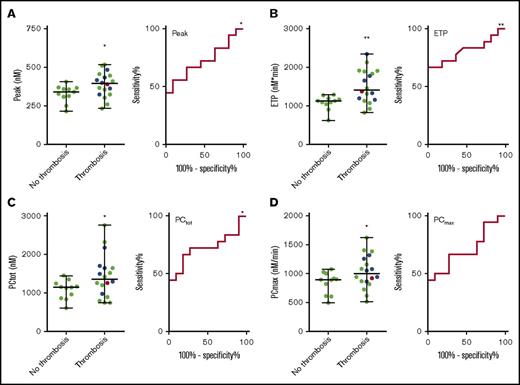
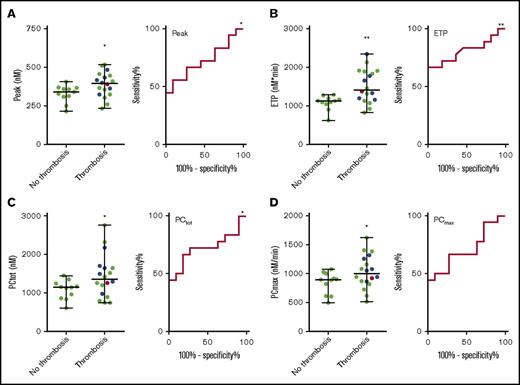
And elevated risk of thrombosis is generally associated with increased TG. Therefore, we split the APS patient group in patients with and without a history of thrombosis (arterial, venous, or small vessel thrombosis) and compared TG and prothrombin conversion parameters (Table 2). The ETP was significantly higher in patients with prior thrombosis, both at 1 and 5 pM TF. At 5 pM TF, the TG peak height was significantly higher in the group with prior thrombosis (Figure 5), and patients without prior thrombosis were less resistant to the inhibitory actions of TM (11% inhibition by TM) than patients with a history of thrombosis (6% inhibition by TM). Prothrombin conversion was significantly elevated in APS patients with prior thrombosis at 5 pM TF; both the total amount of prothrombin conversion and the maximum rate prothrombin conversion were higher (respectively 18% and 12%). Prothrombin conversion seemed to be less sensitive to the actions of TM in the thrombosis group (6.5% vs 10.2% inhibition of the maximum prothrombin conversion rate), but this was not statistically significant (Table 2). We did not find significant differences in TG or prothrombin conversion between patients with prior venous thrombosis and arterial thrombosis. Receiver-operating characteristic (ROC) analysis (Figure 5) shows that peak (AUC = 0.72, P = .048), ETP (AUC = 0.72, P = .048), and PCtot (AUC = 0.72, P = .048) can discriminate between patients with and without thrombosis.
TG and thrombin dynamics parameters measured at 5 pM TF in APS patients with and without prior thrombosis. TG peak height (A) and ETP (B) and total prothrombin conversion (C) and maximum rate of prothrombin conversion (D) were significantly higher in APS patients with prior thrombosis than in patients without a history of thrombosis. There was no difference between a history of venous thrombosis (green dots), arterial thrombosis (blue dots), or a combination of both (red dot). ROC curves were plotted for each of the variables. *P < .05 and **P < .01 compared with the control group using a 2-sided Mann-Whitney U test.
TG and thrombin dynamics parameters measured at 5 pM TF in APS patients with and without prior thrombosis. TG peak height (A) and ETP (B) and total prothrombin conversion (C) and maximum rate of prothrombin conversion (D) were significantly higher in APS patients with prior thrombosis than in patients without a history of thrombosis. There was no difference between a history of venous thrombosis (green dots), arterial thrombosis (blue dots), or a combination of both (red dot). ROC curves were plotted for each of the variables. *P < .05 and **P < .01 compared with the control group using a 2-sided Mann-Whitney U test.
Discussion
APS is associated with thrombophilia in vivo, in contrast to in vitro coagulation assays, which show an artificial anticoagulant effect known as LA.1,2 An increased TG assay is associated with an increased risk of thrombosis, and add-on thrombin dynamics analysis can pinpoint mechanistic differences to either the pro- or anticoagulant pathway. In general, elevated TG can be explained by an elevated prothrombin conversion, an attenuation of thrombin inactivation, or a combination of both.
In our study we show that prothrombin is converted to active thrombin at a significantly higher rate in APS patients than in healthy subjects. The prothrombin conversion rate quantifies the activity of the prothrombinase complex. Although prothrombin conversion is delayed in APS patients (increased lag time) and comparable amounts of prothrombin are converted (PCtot), prothrombin is converted faster (PCmax). This causes a faster accumulation of thrombin, a higher thrombin peak, and a subsequent increase of TG. On the anticoagulant side, thrombin inactivation is similar in APS patients and controls. The combination of faster prothrombin conversion and normal thrombin inactivation causes an accumulation of thrombin in the propagation phase of TG. This is reflected in a higher peak height and causes the balance of TG to shift toward hypercoagulability.
TG itself shows a marked prolongation of the lag time, which is in line with the typical prolongation of the clotting time in APS patients positive for LA. It has been previously shown that the addition of isolated antiphospholipid antibodies prolongs the TG lag time and that the lag time is increased in lupus-anticoagulant–positive APS patients.15,34,35 The TG peak height was elevated in APS patients without anticoagulant treatment when measured at 1 pM TF, but not 5 pM TF. TG is known to be more sensitive when lower TF concentrations are used, especially in the case of differences in the intrinsic pathway of coagulation (eg, in hemophilia A).29 It has been previously reported that at higher TF concentration, the TG peak height and lag time are sensitive to the anticoagulant effect of antiphospholipid antibodies, whereas the ETP is not inhibited in all patients.13 Moreover, Zuily et al previously showed a comparable ETP in platelet-rich plasma in APS patients and controls.12
Nevertheless, elevation of TG is known to be associated with an increased thrombotic risk in other diseases.36,37 Therefore, we divided the APS patients into 2 groups: patients without prior thrombosis and patients with prior arterial, venous, or small vessel thrombosis.37 In the group of APS, peak height and ETP were significantly higher in patients with prior thrombosis. Also, the total amount of prothrombin conversion and the maximum rate of prothrombin conversion were significantly elevated in the prior thrombosis group, indicating that elevation of prothrombin conversion is a prothrombotic mechanism in APS. However, these results and the true predictive power of the PCmax value should be confirmed in a prospective study.
APS patients are known to be less sensitive to the anticoagulant actions of APC,15 and APC resistance has been shown to be indicative of the of thrombosis in APS.38 Antiphospholipid antibodies cause a dose-dependent increase of APC resistance in normal plasma,39 and the removal of anti-cardiolipin/anti-β2GPI antibodies from SLE patient plasma reduced the APC resistance in these samples.40 Protein C and protein S levels have been shown to be reduced in APS.41 Moreover, it has been reported that especially anti-β2GPI-dependent LA activity is associated with increased APC resistance.42 In this study, we determined the sensitivity of the APC system indirectly via the addition of thrombomodulin, which is the in vivo vessel wall–derived activator of protein C. Although acquired APC resistance was reported to be more pronounced in platelet-rich plasma than in platelet-poor plasma,13 we did observe a significant resistance to TM in APS patients. Moreover, TM resistance was significantly more pronounced in patients with prior thrombosis than in patients without. Thus, in addition to the previously reported resistance to APC,11 APS patients are resistant to the actions of TM to a similar extent.
More than half of the APS patients in this cohort were on VKA treatment to prevent thrombotic events. It has been previously proposed that the TG test may be a more sensitive tool to investigate the intensity of coagulation compared with the international normalized ratio determination and that TG could be used as an indicator of ongoing prothrombotic states in APS patients on VKAs.43 In this study, we examined the effect of VKA therapy in APS in more detail by investigating prothrombin conversion and thrombin inactivation separately. We show that VKA treatment removes the prolongation of the lag time and the elevation of peak height observed in APS patients when TG was triggered with a low TF trigger concentration. Also, the difference in maximum prothrombin conversion rate between controls and APS patients is abolished, suggesting that TG can be used to monitor anticoagulant treatment in APS patients. VKA treatment itself also influences the sensitivity of TG to the APC pathway.
VKAs not only reduce plasma levels of procoagulant factors (FII, FVII, FIX, and FX) but also decrease the levels of the anticoagulant factors protein C and protein S, the key enzyme and cofactor of the APC pathway, respectively. In line with this, we found that VKA therapy does not restore TM sensitivity in APS patients when they are treated with VKAs. In contrast, VKA treatment itself causes significant TM resistance in the control group (35% inhibition of TG by TM compared with 50% in healthy subjects), and the resistance to TM was even larger in APS patients on VKA (only 15% inhibition of TG by TM on average). Therefore, even though VKA treatment abolishes differences in TG and prothrombin conversion between APS and control VKA patients, the anticoagulant action of TM could not be restored by VKA therapy.
In conclusion, we show that prothrombin conversion is accelerated in APS patients, which contributes to an increased thrombotic risk. In addition to this intensification of the procoagulant pathway, the inhibitory action of the APC system is greatly diminished in APS patients, suggesting an even larger predisposition to thrombosis. Moreover, within the group of APS patients, the elevation of ETP and prothrombin conversion are associated with thrombosis, and although there was overlap between the data of the 2 groups, ROC analysis revealed a significant discrimination between patients with and without prior thrombosis.
Presented in abstract form at the 58th annual meeting of the American Society of Hematology, San Diego, CA, 5 December 2016.
The full-text version of this article contains a data supplement.
Authorship
Contribution: R.M.W.K. and B.d.L. designed the study, analyzed and interpreted the data, and drafted the manuscript; S.Z. and D.W. supervised the collection of patient samples, interpreted the data, and critically revised the manuscript; H.K collected control samples and revised the manuscript; T.C.P. and S.B. performed part of the experimental work and analysis and revised the manuscript; V.R. collected patient samples and revised the manuscript; and H.C.H and P.G.d.G. interpreted the data and revised the manuscript.
Conflict-of-interest disclosure: The authors declare no competing financial interests.
Correspondence: Romy M. W. Kremers, Cardiovascular Research Institute Maastricht, Maastricht University, Koningin Emmaplein 7, 6217 KD Maastricht, The Netherlands; e-mail: r.kremers@thrombin.com.

