Key Points
Identification of molecular signatures in CMV-specific T cells from HSCT recipients with stable vs unstable immune reconstitution.
Inhibiting epigenetic regulators, like JARID2 or HDAC6, may be a promising strategy for modifying immune reconstitution in HSCT recipients.
Abstract
Immune reconstitution following hematopoietic stem cell transplantation (HSCT) is critical in preventing harmful sequelae in recipients with cytomegalovirus (CMV) infection. To understand the molecular mechanisms underlying immune reconstitution kinetics, we profiled the transcriptome-chromatin accessibility landscape of CMV-specific CD8+ T cells from HCST recipients with different immune reconstitution efficiencies. CMV-specific T cells from HSCT recipients with stable antiviral immunity expressed higher levels of interferon/defense response and cell cycle genes in an interconnected network involving PI3KCG, STAT5B, NFAT, RBPJ, and lower HDAC6, increasing chromatin accessibility at the enhancer regions of immune and T-cell receptor signaling pathway genes. By contrast, the transcriptional and epigenomic signatures of CMV-specific T cells from HSCT recipients with unstable immune reconstitution showed commonalities with T-cell responses in other nonresolving chronic infections. These signatures included higher levels of EGR and KLF factors that, along with lower JARID2 expression, maintained higher accessibility at promoter and CpG-rich regions of genes associated with apoptosis. Furthermore, epigenetic targeting via inhibition of HDAC6 or JARID2 enhanced the transcription of genes associated with differential responses, suggesting that drugs targeting epigenomic modifiers may have therapeutic potential for enhancing immune reconstitution in HSCT recipients. Taken together, these analyses demonstrate that transcription factors and chromatin modulators create different chromatin accessibility landscapes in T cells of HSCT recipients that not only affect immediate gene expression but also differentially prime cells for responses to additional signals. Epigenetic therapy may be a promising strategy to promote immune reconstitution in HSCT recipients.
Introduction
Allogeneic hematopoietic stem cell transplantation (HSCT) is a curative therapy for several hematological malignancies. However, HSCT patients can experience infectious complications, including human cytomegalovirus (CMV) infection, and CMV-infected recipients receiving a transplant from CMV-naive donors are at greatest risk. These risks are exacerbated by poor immune reconstitution following HSCT, which is influenced by the type and degree of immunosuppression used to prevent graft-versus-host disease (GVHD), the stem cell source, degree of HLA matching, and GVHD itself.1-3 Although antiviral agents (predominantly ganciclovir) have significantly reduced CMV-related diseases in HSCT recipients, the long-term control of CMV reactivation requires the stable induction of long-lived, CMV-specific T-cell immunity, which, if not established, increases the risks of viremia and associated end-organ damage.3
Stable immunological memory to CMV is characterized by the peripheral maintenance of high-frequency, long-lived effector memory CD8+ T cells. This population is phenotypically distinct from conventional, “exhausted” memory lymphocytes with high granzyme B (GZMB), T-bet (TBX21), ZNF683, CX3CR1, KLRG1, and CD57 expression and low CD28, CD27, CCR7, and interleukin 7 receptor expression.4 CMV-specific T cells rapidly express cytokines, including interferon γ (IFN-γ), following antigen exposure, are immediately cytolytic, and retain the capacity to proliferate in response to antigen.4
Recent studies, primarily in mice, show that efficient immunological memory induction is associated with epigenetic remodelling.5,6 Indeed, histone modification, DNA methylation, and chromatin accessibility changes play important roles in not only T-cell gene expression but also the ability of T cells to induce genes in response to extracellular signals.7,8 Enhanced memory T-cell responses to activation have been linked to increased chromatin accessibility, especially at enhancer regions.9,10 By contrast, exhausted T cells have increased accessibility at a PDCD1 (PD-1) enhancer.11
Here, we used integrated epigenome-transcriptome analyses to delineate the molecular mechanisms dictating differential immune reconstitution kinetics in HSCT recipients. Using combined RNA sequencing (RNA-seq) and formaldehyde-assisted isolation of regulatory elements sequencing (FAIRE-seq), we show that chromatin accessibility differences are regulated by a combination of transcription factors and chromatin modulators. Expression of transcription factors, including STAT, RBPJ, and NFAT, in CMV-specific T cells from HSCT recipients with stable immune reconstitution increased accessibility at immune gene enhancers, and JARID2 decreased accessibility at CpG-rich regions of apoptosis-related genes. By contrast, zinc-finger–binding proteins, including KLF and EGR, increased accessibility, whereas HDAC6 helped to reduce accessibility in patients with unstable immune reconstitution. More importantly, HDAC6 or JARID2 inhibition enhanced the expression of a cohort of genes, raising the possibility that drugs targeting epigenomic modifiers can be exploited therapeutically to enhance immune reconstitution in HSCT recipients.
Methods
Patients, procedures, and biological samples
CMV-seropositive healthy donor and HSCT recipients were recruited according to the National Statement on Ethical Conduct in Human Research in accordance with the National Health and Medical Research Council (Australia) Act.2,12 The Human Ethics Committees of the QIMR Berghofer Medical Research Institute and Royal Brisbane and Women’s Hospital approved the study protocol. This study was conducted in accordance with the Declaration of Helsinki. HSCT patients were grouped into (1) immune-reactive (IR) HSCT recipients who acquired stable anti-CMV T-cell immunity as indicated by QuantiFERON-CMV reactivity (≥0.1 IU/mL) and no evidence of viral reactivation and (2) non–immune-reactive (NIR) HSCT recipients who failed to acquire stable anti-CMV T-cell immunity as indicated by a lack of QuantiFERON-CMV reactivity (<0.1 IU/mL) and with symptomatic or asymptomatic single or multiple viral reactivations.2,12 The QuantiFERON-CMV assay (QIAGEN, Hilden, Germany) for CMV-specific IFN-γ secretion in whole blood and CMV DNA quantification were performed as previously described.2 This patient cohort and their treatment have been described previously.2,12 HSCTs were granulocyte colony-stimulating factor–mobilized peripheral blood stem cell grafts without in vivo T-cell depletion. For details, see supplemental Methods and supplemental Table 1.
JARID2 and HDAC6 inhibition studies were performed on CD8+ T cells isolated from 40 mL blood from healthy donors as described in supplemental Methods.
Flow cytometry
To detect or isolate CMV-specific or naive T cells, peripheral blood mononuclear cells were incubated with allophycocyanin- or phycoerythrin-conjugated major histocompatibility complex (MHC) class I multimers specific for the HLA A*01:01-restricted epitope VTEHDTLLY, HLA A*02:01-restricted epitope NLVPMVATV, HLA B*07:02-restricted epitopes TPRVTGGGAM and RPHERNGFTVL, or HLA B*08:01-restricted epitope ELKRKMIYM (Immudex, Copenhagen, Denmark) and subjected to secondary labeling for flow cytometry as detailed in supplemental Methods.
Immunofluorescence microscopy
Immunofluorescence microscopy was performed on cytospins prepared from fluorescence-activated cell-sorted, CMV-specific T cells probed with antibodies as detailed in supplemental Methods. Total cytoplasmic (PI3KGC) or nuclear (all others) fluorescence intensity was measured (ImageJ; National Institutes of Health, Bethesda, MD) in a minimum of 20 randomly selected cells.
Gene expression analysis
Gene expression was measured by single-end 75-bp sequencing on a NextSeq500 at the Ramaciotti Centre for Genomics, University of New South Wales and as detailed in supplemental Methods. Other gene expression data were obtained from the Gene Expression Omnibus (accession numbers GSE23321,13 GSE12589,14 and GSE7275215 ) with gene set enrichment analysis16 (Signal2Noise, weighted) used to convert the normalized values to rank metrics and calculate normalized enrichment scores for our gene sets.
Global chromatin accessibility
FAIRE was carried out as described previously17 and in supplemental Methods. Samples from 4 IR (p01, p8, p15, and p37) and 4 NIR (p04, p14, p25, and p47) recipients were separately pooled.
Bioinformatics and statistical analysis
Full details of the bioinformatics analyses can be found in supplemental Methods. The Mann-Whitney nonparametric test (GraphPad Prism, San Diego, CA) was used to determine significant differences between immunofluorescence datasets. Two-tailed unpaired Student t tests were used to determine significance for quantitative reverse transcription polymerase chain reaction. Two-sided Fisher’s exact test with continuity correction (R) was used to determine the significance of the different gene expression sets having accessible regions within a given distance.
Data availability
FAIRE-seq data have been deposited in the Gene Expression Omnibus (accession number GSE104750). All other data are available from the authors.
Results
Differential gene expression in CMV-specific T cells from HSCT recipients with stable or unstable immune reconstitution
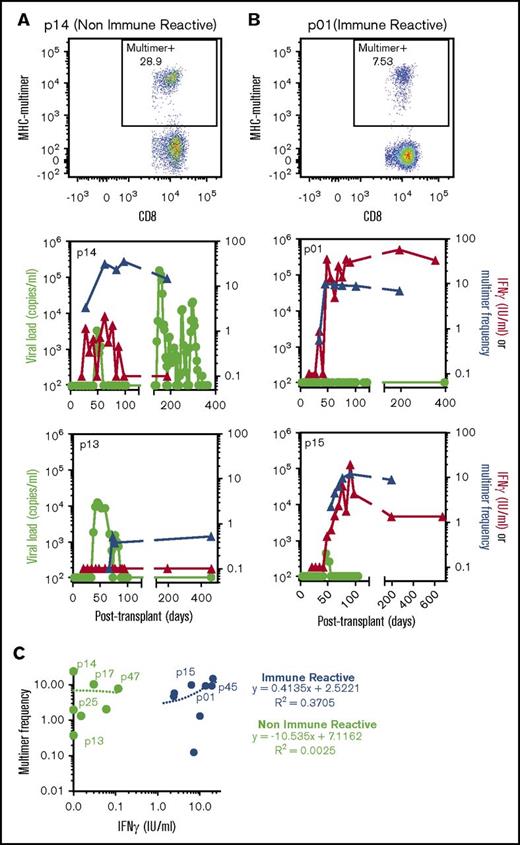
We previously reported the longitudinal measurement of CMV-specific T-cell immune reconstitution by the QuantiFERON-CMV assay in HSCT recipients.2 We noted a significant association between CMV reactivation and a failure to establish stable CMV immunity, characterized by periodic or long-term lack of IFN-γ expression by CMV-specific T cells (NIR). By contrast, patients who showed stable immune reconstitution with consistent IFN-γ expression by CMV-specific T cells had a reduced incidence of viral reactivation (IR). To determine the presence of CMV-specific T cells in these patients, we performed longitudinal CMV-specific MHC-peptide multimer analysis. Representative flow cytometric MHC-multimer analyses and longitudinal MHC-peptide multimer frequencies overlaid with IFN-γ expression by CMV-specific T cells and CMV viral loads are shown in Figure 1A (NIR HSCT recipients) and Figure 1B (IR HSCT recipients). These analyses showed that despite a lack of detectable IFN-γ production by CMV-specific T cells from NIR HSCT recipients, CMV-specific MHC-peptide multimer-positive cells were consistently detected in these patients (Figure 1C). There was concordance (Pearson correlation, 0.61) between MHC multimer frequency and QuantiFERON reactivity in IR HSCT recipients, but not NIR HSCT recipients (Figure 1C).
CMV-specific T-cell immune reconstitution and viral reactivation in HSCT patients. Longitudinal blood samples from HSCT recipients were monitored for viral reactivation and assessed for CMV-specific T-cell immunity using QuantiFERON and HLA-matched MHC-multimer analysis. (A-B) Representative MHC-multimer analyses from a NIR patient (p14) (A) and IR patient (p01) (B) are shown. Longitudinal analysis of viral load, MHC-multimer frequency, and QuantiFERON response in 2 NIR patients (p15 and p13) (A) and 2 IR patients (p01 and p15) (B) are shown. (C) Comparative analysis of the QuantiFERON IFN response and MHC-multimer frequency in IR (blue) and NIR (green) patients at 10 to 14 weeks after transplant. Linear regression lines and coefficient of determination (R2) are shown, and patients used for RNA-seq are annotated.
CMV-specific T-cell immune reconstitution and viral reactivation in HSCT patients. Longitudinal blood samples from HSCT recipients were monitored for viral reactivation and assessed for CMV-specific T-cell immunity using QuantiFERON and HLA-matched MHC-multimer analysis. (A-B) Representative MHC-multimer analyses from a NIR patient (p14) (A) and IR patient (p01) (B) are shown. Longitudinal analysis of viral load, MHC-multimer frequency, and QuantiFERON response in 2 NIR patients (p15 and p13) (A) and 2 IR patients (p01 and p15) (B) are shown. (C) Comparative analysis of the QuantiFERON IFN response and MHC-multimer frequency in IR (blue) and NIR (green) patients at 10 to 14 weeks after transplant. Linear regression lines and coefficient of determination (R2) are shown, and patients used for RNA-seq are annotated.
We next used RNA-seq to characterize the transcriptomes of CMV-specific CD8+ T cells enriched by MHC-peptide multimers from 8 IR and NIR HSCT recipients 10 to 14 weeks after transplant (supplemental Table 1). There were 2 main transcriptomic groups (supplemental Figures 1A and 2A): (1) NIR HSCT recipients with unstable IFN-γ expression (<0.2 IU/mL), and (2) IR HSCT recipients with high/stable IFN-γ expression (>0.2 IU/mL). Using gene set enrichment analysis and identification of differentially expressed gene signatures, we found that CMV-specific T cells from IR HSCT recipients were significantly (q ≤ 0.2) enriched for IFN response, mitotic, and viral defense pathways (Figure 2B; supplemental Figure 1B). By contrast, virus-specific T cells from NIR HSCT recipients were enriched for stress, hypoxia, extracellular signaling, apoptotic pathways, inflammatory response, and phagocytosis (Figure 2B; supplemental Figure 1B). Furthermore, CMV-specific T cells from NIR HSCT recipients showed enrichment for an anergic T-cell signature18 (supplemental Figure 1B), with increased expression of NR4A2/3, GADD45B, TNFSF9, ADORA2A, and MARCH2.
Identification and characterization of gene signatures associated with reactive and nonreactive CMV+ lymphocytes. (A) Similarities between the transcriptome profiles of CMV-specific memory CD8+ lymphocytes from HSCT recipients were assessed using PCA, with NIR recipients in green and IR recipients in blue. (B) Enrichment of functional gene sets at either ends of the gene expression spectrum from more in NIR to more in IR T cells. (C) Gene expression differences in T cells from IR and NIR recipients, with significantly (false discovery rate [FDR] <0.2) different genes colored blue (IR) or green (NIR). (D-F) Expression of the IR (blue) and NIR (green) signature genes in (D) T cells from chronic HCV vs resolved HCV patients, (E) CD8 memory subsets (stem cell memory [SCM], central memory [CM], and effector memory [EM]) and (F) different stages of CMV infection. Expression assessed by rank metric (weighted signal to noise) with median values shown in red. Normalized enrichment score shown. *P < .05. Values in panel C incorporate zero-centered normal priors, and thus, shrinkage was greater for the log2-fold change estimates from genes with low counts, and high dispersion and points are sized according to their P value. ATP, adenosine triphosphate; PID, Pathway Interaction Database; TNFA, tumor necrosis factor alpha.
Identification and characterization of gene signatures associated with reactive and nonreactive CMV+ lymphocytes. (A) Similarities between the transcriptome profiles of CMV-specific memory CD8+ lymphocytes from HSCT recipients were assessed using PCA, with NIR recipients in green and IR recipients in blue. (B) Enrichment of functional gene sets at either ends of the gene expression spectrum from more in NIR to more in IR T cells. (C) Gene expression differences in T cells from IR and NIR recipients, with significantly (false discovery rate [FDR] <0.2) different genes colored blue (IR) or green (NIR). (D-F) Expression of the IR (blue) and NIR (green) signature genes in (D) T cells from chronic HCV vs resolved HCV patients, (E) CD8 memory subsets (stem cell memory [SCM], central memory [CM], and effector memory [EM]) and (F) different stages of CMV infection. Expression assessed by rank metric (weighted signal to noise) with median values shown in red. Normalized enrichment score shown. *P < .05. Values in panel C incorporate zero-centered normal priors, and thus, shrinkage was greater for the log2-fold change estimates from genes with low counts, and high dispersion and points are sized according to their P value. ATP, adenosine triphosphate; PID, Pathway Interaction Database; TNFA, tumor necrosis factor alpha.
We identified 329 and 463 significantly (false discovery rate <0.2) differentially expressed genes in CMV-specific T cells from IR (supplemental Table 2) and NIR HSCT recipients (supplemental Table 3; Figure 2C; supplemental Figure 1C), respectively. Interestingly, the gene signature from CMV-specific T cells from NIR HSCT recipients was significantly enriched in CD8+ T cells from patients with chronic hepatitis C virus (HCV) infection, whereas the gene signature from CMV-specific T cells from IR HSCT recipients was enriched in those from HCV resolvers (GSE72752)15 (Figure 2D). This effect was independent of the exhaustion-related CD39 status of the cells (Figure 2D), and CD39 was not differentially expressed in T cells from IR and NIR HSCT recipients. Expression of NIR signature genes such as FKBP5 and CD72 (supplemental Table 3) was higher in chronic HCV patients, suggesting that unstable immune reconstitution in HSCT recipients and “exhaustion” in chronic HCV may share transcriptional mechanisms. Conversely, overexpression of IR signature genes such as ICOS and JARID2 in HCV resolvers (supplemental Table 2) could play a role in preventing and resolving infections.
To further investigate whether maturation of CMV-specific T cells from NIR HSCT recipients was defective, we examined signature gene set expression in naive and CD8+ memory T-cell subsets (Figure 2E-F). Signature genes of CMV-specific T cells from IR HSCT recipients such as CXCR3, EPHA4, IL2RB, YARS, and NFATC2 showed higher expression in stem cell memory, central memory, and effector memory cells (GSE23321)13 and memory T cells during peak CMV infection in renal transplant recipients (GSE12589)14 (Figure 2E-F; supplemental Table 2). Although some NIR signature genes (TSPYL2, TSC22D3, IL6R, and CD55) were downregulated during peak CMV-specific T-cell responses, expression was generally not higher in naive than memory cells (Figure 2E-F; supplemental Figure 1C; supplemental Table 3).
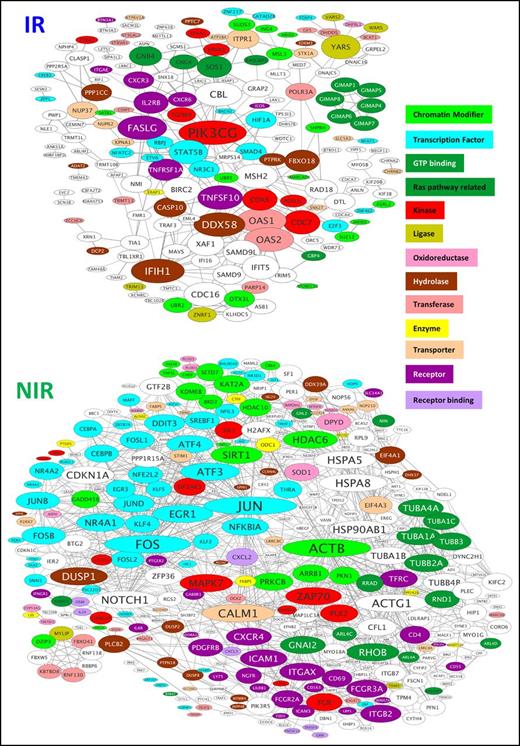
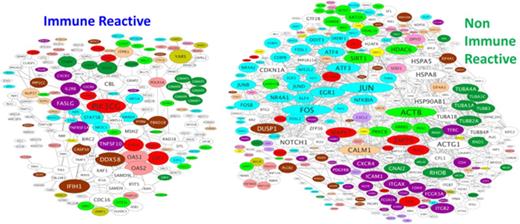
To help identify major transcriptional regulators of the gene signatures, the STRING database was examined for known and predicted connections between the encoded proteins (Figure 3). CMV-specific T-cell gene signatures from IR and NIR HSCT recipients showed significantly higher interactions than expected by chance (P = 5.5e-06 and P = 0 for IR and NIR, respectively). The kinase PIK3CG was the most highly connected node in CMV-specific T cells from IR HSCT recipients, with connections to receptors (TNFRSF1A, ICOS, TNFSF10), kinases (CDK6), and transcription factors (RBPJ). Many differentially expressed genes, especially in T cells from NIR HSCT recipients, were transcription factors or chromatin modifiers (Figure 3). The IR HSCT recipient gene signature included transcription factors (GFI1, BACH2, RBPJ, NFATC2, STAT5B, NR3C1, and FOXP4) and chromatin modifiers (JARID2, SUZ12, KDM7A, ING4, ARID2, and SATB1) (Figure 3; supplemental Figure 2E-F). By contrast, CMV-specific T cells from NIR HSCT recipients had higher expression of members of the JUN, FOS, ATF, MAF, NR4A, KLF, and EGR transcription factor families and KDM6B, several histone deacetylases (HDACs), and SIRT. CMV-specific T cells in HSCT recipients with unstable immunity have transcriptional profiles with some similarities to anergic cells (supplemental Figure 1B) with no evidence that they were more similar to naive than memory cells.
Protein–protein interactions between products of the genes differentially expressed in CMV-specific T cells from IR and NIR recipients. The STRING database was used to identify known and predicted interactions between the products of the genes characterizing reactive and nonreactive CMV-specific T cells. Proteins are sized according to their number of connections and colored according to function. Only connected proteins are shown. GTP, guanosine triphosphate.
Protein–protein interactions between products of the genes differentially expressed in CMV-specific T cells from IR and NIR recipients. The STRING database was used to identify known and predicted interactions between the products of the genes characterizing reactive and nonreactive CMV-specific T cells. Proteins are sized according to their number of connections and colored according to function. Only connected proteins are shown. GTP, guanosine triphosphate.
Differential chromatin accessibility profiles characterize stable or unstable CMV-specific immune reconstitution
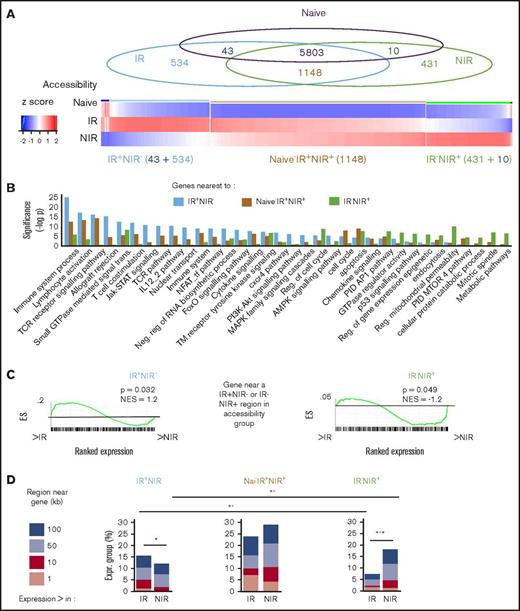
To explore the epigenome’s role in influencing T-cell transcriptomes, we next profiled and compared chromatin accessibility in CMV-specific T cells from IR or NIR HSCT recipients with naive (CD45RA+CCR7+) CD8+ T cells from a healthy donor. Overall, chromatin accessibility patterns in CMV-specific T cells from IR and NIR HSCT recipients were more similar to each other than to naive cells (supplemental Figure 2A). 577 and 441 regions were unique to CMV-specific T cells from IR and NIR HSCT recipients, respectively (supplemental Tables 4 and 5; Figure 4A). Only a minority (43 in IR HSCT and 10 in NIR HSCT recipients) had accessibility in naive cells (Figure 4A; supplemental Figure 2B), with most gaining accessibility upon differentiation. Of the 6951 accessible regions in T cells from both IR and NIR HSCT recipients, 1148 (supplemental Table 6) had increased accessibility compared with naive cells, whereas 5803 were accessible in naive, IR, and NIR cells.
Identification and characterization of chromatin accessibility in reactive and nonreactive CMV-specific T cells. (A) Overlap between regions accessible in CMV-specific T cells from NIR and IR recipients and naive CD8 T cells gave rise to 3 main chromatin accessibility groups: IR+NIR−, naive−IR+NIR+, and IR−NIR+. (B-C) The genes nearest to the regions were characterized by enrichment of signaling pathways (B) and their expression in IR and NIR cells (C). Gene set enrichment analysis plots show cumulative enrichment scores (ESs) across genes ranked by expression in IR to NIR, with lines indicating the presence in the ranking of a gene near a IR+NIR− or IR−NIR region. Normalized enrichment scores are indicated. (D) The proportion of genes with differential expression that have an accessible region within 1 to 100 kb of their transcriptional start site. *P < .05 in size range of matching color. (E) Characterization of the regions and the region subset that occur within 50 kb of a differentially expressed gene by their genomic annotation and chromatin state. Chromatin states from CD8+ naive (outer circle) and memory (inner circle) lymphocytes. Chromatin states: enhancer (Enh), repressive (Repr), permissive (Perm), transcription (Tx), quiescent (Quies), active (Act), or weak (Wk). (F) The proportion of the regions bound by different DNA-binding proteins in various tissues from publically available ChIP-seq data and DNA-binding motif enrichment. Enrichment reported as clover enrichment score and assessed against regions with matching GC content. Enrichment values colored by rank (given in brackets); motifs are significant (P < .05) unless marked nonsignificant (ns). LINE, long interspersed element; LTR, long terminal repeat; SINE, short interspersed element; TCR, T-cell receptor; TTS, transcription termination site; UTR, untranslated region.
Identification and characterization of chromatin accessibility in reactive and nonreactive CMV-specific T cells. (A) Overlap between regions accessible in CMV-specific T cells from NIR and IR recipients and naive CD8 T cells gave rise to 3 main chromatin accessibility groups: IR+NIR−, naive−IR+NIR+, and IR−NIR+. (B-C) The genes nearest to the regions were characterized by enrichment of signaling pathways (B) and their expression in IR and NIR cells (C). Gene set enrichment analysis plots show cumulative enrichment scores (ESs) across genes ranked by expression in IR to NIR, with lines indicating the presence in the ranking of a gene near a IR+NIR− or IR−NIR region. Normalized enrichment scores are indicated. (D) The proportion of genes with differential expression that have an accessible region within 1 to 100 kb of their transcriptional start site. *P < .05 in size range of matching color. (E) Characterization of the regions and the region subset that occur within 50 kb of a differentially expressed gene by their genomic annotation and chromatin state. Chromatin states from CD8+ naive (outer circle) and memory (inner circle) lymphocytes. Chromatin states: enhancer (Enh), repressive (Repr), permissive (Perm), transcription (Tx), quiescent (Quies), active (Act), or weak (Wk). (F) The proportion of the regions bound by different DNA-binding proteins in various tissues from publically available ChIP-seq data and DNA-binding motif enrichment. Enrichment reported as clover enrichment score and assessed against regions with matching GC content. Enrichment values colored by rank (given in brackets); motifs are significant (P < .05) unless marked nonsignificant (ns). LINE, long interspersed element; LTR, long terminal repeat; SINE, short interspersed element; TCR, T-cell receptor; TTS, transcription termination site; UTR, untranslated region.
We next examined the properties of the genes nearest to differentially accessible regions. Genes near regions identified only in CMV-specific T cells from IR HSCT recipients were enriched for T-cell receptor signaling and other immune pathways, including Jak-STAT, FoxO, and phosphatidylinositol 3-kinase (PI3K) (Figure 4B). By contrast, genes near regions identified only in CMV-specific T cells from NIR HSCT recipients were involved in metabolic pathways, p53, and regulation of mitochondrial permeability (Figure 4B). Genes near regions identified only in IR HSCT recipients had significantly (P = .032) enriched expression in IR cells. Similarly, significantly more (P = .049) genes near regions identified only in NIR HSCT recipients had higher expression in NIR HSCT recipients (Figure 4C). Regulatory regions do not always act on the nearest gene and sometimes act on distant or multiple genes.19 Therefore, we examined the relationship between accessibility and expression by determining how many of the genes with differential expression were within a certain distance of the region sets. Significantly more genes with higher expression in IR cells were near (50 or 100 kb) a region with accessibility only in IR, whereas the converse was true for genes with higher expression in NIR cells (Figure 4D; supplemental Figure 2C).
Regions accessible uniquely in IR HSCT recipients were predominantly in intronic and intergenic regions with chromatin enhancer marks (ie, H3K4me1 and H3K27ac) in CD8+ naive and memory T cells20 (Figure 4F). By contrast, a large proportion of the regions accessible only in NIR HSCT recipients were in the promoter, 5′ untranslated region and CpG islands and had the permissive H3K4me3 mark in both naive and memory T cells (Figure 4F). The presence of chromatin marks in the majority of accessible regions verifies their regulatory potential and also supports a model in which accessibility increases occur in areas “premarked” in development by chromatin modifications.
Role of transcription factors and chromatin modifiers in regulating accessibility in reactive and nonreactive T cells
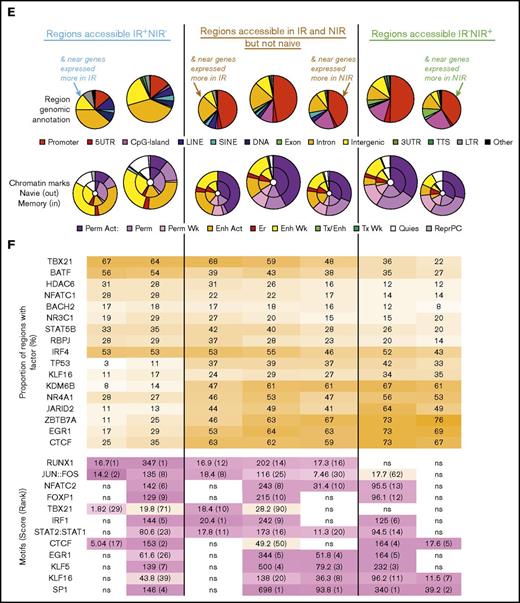
To identify which transcription factors and chromatin modifiers may regulate accessibility, we examined the unique regions from CMV-specific T cells from IR and NIR HSCT recipients for (1) transcription factor/modifier–binding sites from available ChIP-seq studies in CISTROME21 and (2) overrepresented DNA-binding motifs compared with sequences with matching GC content. Regions identified only in CMV-specific T cells from IR HSCT recipients showed binding of transcriptional regulators important for the efficient memory T-cell functional maturation, including TBX21, STAT5B, HDAC6, RBPJ, and NR3C1 (Figure 4F; supplemental Figure 2D-E). Some regions, such as those near PI3KCG or CXCR3, could bind many of these factors, whereas other regions could bind either RBPJ and NFATC1, TBX21 and STAT5, or HDAC6 (supplemental Figure 2D). Comparisons of all uniquely accessible IR regions with the subset near differentially expressed genes suggested that factors such as NR3C1 may be more associated with regions that prime genes for expression (Figure 4F; supplemental Figure 2F). Regions in T cells from IR HSCT recipients were enriched for RUNX, AP1, NFAT, IRF, and STAT motifs, and limiting the regions to those near genes with differential expression highlighted roles for the RUNX and AP1 motifs (Figure 4F; supplemental Figure 2G). By contrast, the regions uniquely identified in CMV-specific T cells from NIR HSCT recipients could bind factors such as JARID2, TP53, and zinc-finger proteins, including KLF16, EGR1, CTCF, and ZBTB7A overrepresented for zinc-finger motifs (Figure 4F; supplemental Figure 2D-E). Although zinc-finger proteins, including KLF16, EGR1, and ZBTB7A, could bind many of the regions near differentially expressed genes, TP53 could potentially bind more regions associated with primed genes (Figure 4F; supplemental Figure 2F-G).
Interestingly, regions accessible in CMV-specific cells from both IR and NIR recipients, but not naive cells, had different properties depending on whether they occurred nearer to genes expressed in IR or NIR cells (Figure 4F; supplemental Figure 2H). These similar properties to those of the uniquely accessible regions support a role for factors such as TBX21 and KLF in not only opening chromatin but also regulating transcription from accessible DNA. NFAT activity is associated with lymphocyte anergy and exhaustion,22 but our results suggest it is not responsible for the unstable reconstitution phenotype. Confirming the in silico predictions, nuclear NFATC1 levels were higher in IR cells, whereas KLF16 levels were higher in NIR cells (supplemental Figure 2I).
Chromatin modifiers influence the transcriptome of reactive and nonreactive lymphocytes
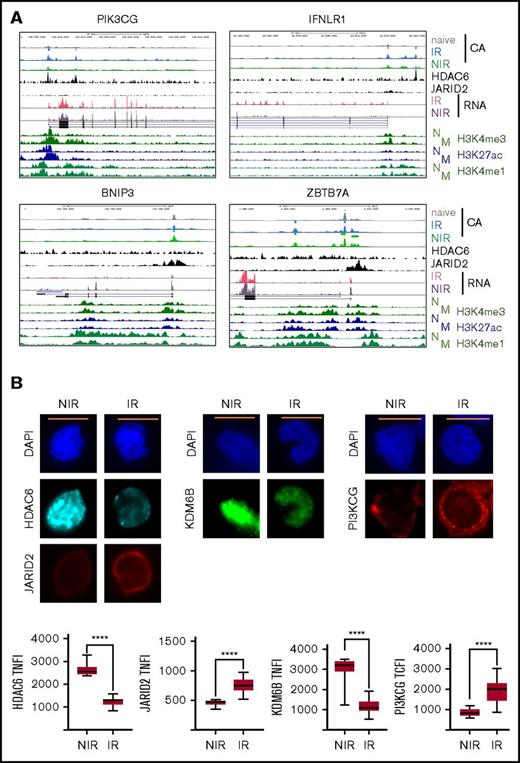
Interestingly, the potentially repressive factors JARID2, SUZ12, and MECP2 (Figure 4F; supplemental Figure 2D) could bind many of the regions in CMV-specific T cells from NIR HSCT recipients and, of note, JARID2 and SUZ12 were more highly expressed in IR cells (Figure 3; supplemental Table 2). JARID2 has no intrinsic histone methylase activity but can alter that of cobinding proteins and commonly acts as a repressor.23 Similarly, the type II histone deacetylase HDAC6 could bind more regions accessible in cells from IR HSCT recipients (Figure 4F; supplemental Figure 2D) and was more highly expressed in NIR cells (Figure 3; supplemental Table 3). Examination of HDAC6 binding in activated T lymphocytes24 at IR-unique accessible regions near IR set genes such as PIK3CG and IFNLR1 revealed “narrow” binding at promoter (eg, PIK3CG), upstream (IFNLR1), and intronic (PIK3CG) enhancers (Figure 5A). Some regions (eg, near PIK3CG) also showed increased H3K27ac in memory compared with naive CD8+ lymphocytes.20 By contrast, JARID2 binding in iPSCs25 was broader and tended to flank the NIR uniquely accessible regions such as those near BNIP3 and ZBTB7A, similar to modified histones. HDAC6 has cytoplasmic and nuclear roles,26 and nuclear HDAC6 was higher in NIR cells (Figure 5B), along with the H3K4me3 histone demethylase KDM6B, which also showed increased gene expression in NIR cells. Nuclear JARID2 was also higher in cells from IR recipients (Figure 5B).
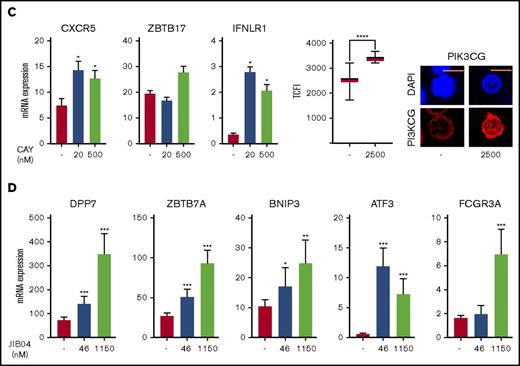
Regulation of gene expression in IR and NIR lymphocytes by chromatin modulators. (A) Chromatin accessibility (CA; FAIRE-seq), mRNA levels (RNA-seq), and HDAC6, JARID2, and histone modifications (publicly available ChIP-seq) near PIK3CG, IFNLR1, BNIP3, and ZBTB7A. Histone modifications are for naive (N) and memory (M) CD8+ lymphocytes (REMC/Broad donor 100). HDAC6 binding in activated T lymphocytes and JARID2 binding in iPSCs. (B) Levels and location of HDAC6, JARID2, KDM6B, and PI3KCG proteins in IR and NIR cells. (C) The effect of pretreatment with the HDAC6 inhibitor CAY1063 on gene expression levels and PIK3CG protein expression in CD8+ lymphocytes following 2-hour phorbol 12-myristate 13-acetate/ionomycin stimulation. (D) The effect of pretreatment of unstimulated CD8+ lymphocytes with the JARID inhibitor JIB04 on gene expression levels. (B-C) Total nuclear fluorescence intensity (TNFI) or total cytoplasmic fluorescence intensity (TCFI) was measured in a minimum of n = 20 cells for 2 different donors. DAPI (4′,6-diamidino-2-phenylindole) shows the nucleus. ****P < .0001. Scale bar represents 5 μm. (C-D) Expression values normalized to PPIA. Error bars show standard error of the mean of triplicate polymerase chain reactions from 1 donor and are representative of 2 different donors. ***P < .001, **P < .01, and *P < .05 compared with control.
Regulation of gene expression in IR and NIR lymphocytes by chromatin modulators. (A) Chromatin accessibility (CA; FAIRE-seq), mRNA levels (RNA-seq), and HDAC6, JARID2, and histone modifications (publicly available ChIP-seq) near PIK3CG, IFNLR1, BNIP3, and ZBTB7A. Histone modifications are for naive (N) and memory (M) CD8+ lymphocytes (REMC/Broad donor 100). HDAC6 binding in activated T lymphocytes and JARID2 binding in iPSCs. (B) Levels and location of HDAC6, JARID2, KDM6B, and PI3KCG proteins in IR and NIR cells. (C) The effect of pretreatment with the HDAC6 inhibitor CAY1063 on gene expression levels and PIK3CG protein expression in CD8+ lymphocytes following 2-hour phorbol 12-myristate 13-acetate/ionomycin stimulation. (D) The effect of pretreatment of unstimulated CD8+ lymphocytes with the JARID inhibitor JIB04 on gene expression levels. (B-C) Total nuclear fluorescence intensity (TNFI) or total cytoplasmic fluorescence intensity (TCFI) was measured in a minimum of n = 20 cells for 2 different donors. DAPI (4′,6-diamidino-2-phenylindole) shows the nucleus. ****P < .0001. Scale bar represents 5 μm. (C-D) Expression values normalized to PPIA. Error bars show standard error of the mean of triplicate polymerase chain reactions from 1 donor and are representative of 2 different donors. ***P < .001, **P < .01, and *P < .05 compared with control.
To help determine whether the higher HDAC6 levels in NIR cells limited specific gene expression, healthy donor CD8+ lymphocytes were pretreated with the HDAC6 inhibitor CAY106327 before 2-hour activation with phorbol 12-myristate 13-acetate/ionomycin and examination of the expression of potential targets with IR uniquely accessible regions that had HDAC6 binding detected in activated T cells.24 HDAC6 inhibition upregulated expression of CXCR5 (P < .05), IFNLR1 (P < .05), and ZBTB17 and protein expression of PIK3CG (P < .05) (Figure 5C). Of note, IFNLR1 and PIK3CG were more highly expressed in cells from IR recipients (Figure 3; supplemental Table 2). We next used JIB04, a JARID inhibitor,24 on nonstimulated CD8+ cells to see whether JARID2 plays a role in repressing JARID2-binding targets and the NR-associated gene ATF323 in induced pluripotent stem cells (iPSCs). JIB04 treatment significantly upregulated DPP7, ZBTB7A, BNIP3, ATF3, and FCGR3A expression (Figure 5D). Of these, ATF3, ZBTB7A, and FCGR3A were significantly (P < .05) more expressed in NIR recipient cells (Figure 3; supplemental Table 3).
These data suggest that higher HDAC6 expression in NIR cells decreases histone acetylation and subsequently DNA accessibility at particular regions (primarily enhancers). This depends on other factors such as STAT, NFAT, and RBPJ family activation, either leading to target gene expression (such as PIK3CG) or contributing to expression upon receipt of additional signals such as those from the T-cell receptor, cytokines, or costimulatory receptors (supplemental Figure 3). Furthermore, higher JARID2 expression in IR cells could help to maintain reduced chromatin accessibility (potentially through higher H3K27me3) at the promoters and CpG-rich areas of target genes, resulting in their higher expression in NIR cells (supplemental Figure 3).
Discussion
CMV infection remains a significant complication following HSCT. While antiviral treatments have successfully reduced the risk of CMV reactivation, acquired antiviral resistance or drug intolerance can cause severe CMV-associated complications. These complications are associated with the efficiency of immune reconstitution following HSCT, a failure of which compromises control of CMV infection, increases viral titres, and results in CMV-associated pathology. We previously reported2 that poor CMV control is associated with an unstable, nonreactive CMV-specific T-cell response characterized by impaired IFN-γ generation. Here, we reveal distinct gene expression and chromatin states in reactive and nonreactive T cells, defining a gene expression signature in nonreactive cells that overlaps with previous observations in other chronic viral infections and anergy and potential changes in the function of key epigenetic modifiers that are likely to be critical for the stable functional maturation of CMV-specific T cells.
CMV-specific T cells in asymptomatic healthy individuals have long been defined by a terminally differentiated phenotype; however, unlike exhausted populations, they maintain a lifelong capacity to control infection without overt viremia. Although both the reactive and nonreactive CMV-specific T-cell populations studied here showed clear evidence of a CMV-associated gene expression signature, there was evidence of changes in the NIR populations that may underpin their inefficient infection control. Although there was no definitive evidence of an exhausted or hyporesponsive signature in CMV-specific T cells from NIR patients, there was evidence of increased expression of inhibitory genes such as PDCD1 and LILRB1. The nonreactive cells shared similarities with T cells from nonresolving HCV patients, including PDCD1, NR4A, and EGR1 expression. However, they differed from the classical exhaustion signature in that there was no NFAT activation in the absence of AP1. Unlike other chronic or persistent infections such as HCV, CMV infection in HSCT patients is usually controlled by rapid ganciclovir administration. Although speculative, it is possible that the unique gene CMV-specific T-cell signatures from unstable nonreactive patients may be indicative of an early hyporesponsive state. Given the nature of T-cell–replete HCST, nearly all of the cells profiled originate from the donor.2,12 However, it remains to be determined whether the nonresponsive phenotype is intrinsic to donor cells or a response to the host (immune) environment.
A key difference in the gene signatures of IR and NIR CMV-specific cells was differential expression of PI3KCG, which encodes the PI3Kγ p110 subunit. PI3Ks activate Akt and Tor, suppress FOXO signaling, and play important roles in CD8 memory differentiation.28 PI3KCG, the most connected node in the STRING network, is primarily activated by chemokine receptor signaling through G-protein–coupled receptors and Ras-mediated signaling,29 recruits T cells to sites of vaccinia virus infection,30 and induces CXCR3 expression through T-bet.31 PI3K is also required for interleukin-12 signaling in T cells and is important in regulating the T-box transcriptional regulators T-bet and eomesodermin. Open regions near genes differentially expressed in reactive CMV-specific T cells were enriched for T-box motifs and STAT family members, which also play important roles in cytokine-mediated signaling. These differences, along with the strong AP1 signature in IR regions in the absence of higher expression of most AP1 family members, suggest that CMV-specific T cells from reactive patients had stronger initial activation and/or costimulatory signals than those in nonreactive cells. Changes to chromatin accessibility upon activation can be maintained in the absence of continued activation of factors such as AP1.9,10
Recent data suggest that treatment with epigenetic modifiers, including HDAC inhibitors, can restore exhausted T-cell function and improve viral control in virally infected animals.32 We were therefore interested in whether the differences in reactive and nonreactive T cells were modifiable, focusing on 2 epigenetic modifiers discordantly expressed in reactive and nonreactive cells, HDAC6 and JARID2. HDAC6 is a class IIb histone deacetylase with many nonhistone targets and important cytoplasmic roles that binds DNA in activated lymphocytes.33 Its increased nuclear expression in CMV-specific T cells from patients with unstable immunity suggests that it may play an important role in regulating the epigenome of these T cells. Although we could not perform these experiments directly in nonreactive CMV-specific T cells because of insufficient cell numbers, HDAC6 inhibition upregulated the expression of several genes in activated lymphocytes. Importantly, this included PIK3CG, indicating that regulating HDAC6 could improve the epigenetic programming of these cells. Although not explored here, recent observations have suggested that HDAC6 may play a role in regulating PD1.34 The HDAC inhibitor vorinostat modified GVHD in clinical trials.35 Conversely, inhibition of JARID2, a Polycomb repressive complex 2 (PRC2) accessory protein that targets PRC2 to CpG-rich DNA and nucleosomes through its zinc finger and AT-rich interaction domains, respectively, increased the expression of genes more highly expressed in nonreactive cells. Gene expression of the PRC2 core protein SUZ12 was also increased in reactive cells, suggesting a gene repressive role for JARID2 and PRC2 in maturating reactive CMV-specific T cells. Here, we used short-term stimulation to monitor direct events. Future experiments with chronic stimulation in in vivo and ex vivo model systems will allow comparative analyses of direct and secondary effects during short- and long-term stimulation.
Although the complex nature of the cellular environment in transplant patients makes it likely that the transcriptome and accessibility profiles of CMV-specific T cells are more heterogeneous, our observations provide clear evidence of differences in the epigenomes of T cells with different functional capacities. With advances in techniques utilizing smaller cell numbers, future experiments on inhibitor-treated donor and HSCT recipient cells will help elucidate the nature of the NIR “defect” and its potential for reversal. Our observations provide a platform for the development of new therapeutic options by targeting novel T-cell pathways. Overall, our findings highlight that epigenetic-directed therapy may be a promising management strategy for viral infections in HSCT recipients.
The data reported in this article have been deposited in the Gene Expression Omnibus database (accession number GSE104750).
The full-text version of this article contains a data supplement.
Acknowledgments
The authors thank Sau Kuen Lee for sorting the cells for FAIRE-seq.
This research was supported by the National Health and Medical Research Council (NHMRC) (grant GNT1105747). W.J.T. was supported by a WJ Weeden Research Scholarship. R.K. and G.R.H. are supported by NHMRC research fellowships. S.-K.T. was supported by an NHMRC early career fellowship.
Authorship
Contribution: K.H., C.S., R.K., and S.R. wrote the manuscript; R.K., S.R., and C.S. conceived the concept; K.H. carried out all the bioinformatic analysis; C.S., A.P., and V.D. performed various immunological experiments; W.J.T. generated FAIRE-seq libraries and performed primary T-cell and epigenetic drug experiments with F.W.; G.R.H. and S.-K.T. were responsible for recruitment and clinical management of the patients enrolled in this study; S.-K.T. also performed immune monitoring analysis of HSCT recipients; and R.M. performed all microscopy experiments.
Conflict-of-interest disclosure: The authors declare no competing financial interests.
Correspondence: Sudha Rao, Faculty of Education, Science, Technology & Mathematics, Building 3, Allwoona St, Bruce, University of Canberra, Canberra, ACT 2617, Australia; e-mail: sudha.rao@canberra.edu.au; and Rajiv Khanna, Department of Immunology, QIMR Berghofer Medical Research Institute, Brisbane, QLD 4006, Australia; e-mail: rajiv.khanna@qimr.edu.au.
References
Author notes
K.H. and C.S. contributed equally to this study.

![Figure 2. Identification and characterization of gene signatures associated with reactive and nonreactive CMV+ lymphocytes. (A) Similarities between the transcriptome profiles of CMV-specific memory CD8+ lymphocytes from HSCT recipients were assessed using PCA, with NIR recipients in green and IR recipients in blue. (B) Enrichment of functional gene sets at either ends of the gene expression spectrum from more in NIR to more in IR T cells. (C) Gene expression differences in T cells from IR and NIR recipients, with significantly (false discovery rate [FDR] <0.2) different genes colored blue (IR) or green (NIR). (D-F) Expression of the IR (blue) and NIR (green) signature genes in (D) T cells from chronic HCV vs resolved HCV patients, (E) CD8 memory subsets (stem cell memory [SCM], central memory [CM], and effector memory [EM]) and (F) different stages of CMV infection. Expression assessed by rank metric (weighted signal to noise) with median values shown in red. Normalized enrichment score shown. *P < .05. Values in panel C incorporate zero-centered normal priors, and thus, shrinkage was greater for the log2-fold change estimates from genes with low counts, and high dispersion and points are sized according to their P value. ATP, adenosine triphosphate; PID, Pathway Interaction Database; TNFA, tumor necrosis factor alpha.](https://ash.silverchair-cdn.com/ash/content_public/journal/bloodadvances/2/6/10.1182_bloodadvances.2018015909/4/m_advances015909f2.jpeg?Expires=1763472408&Signature=V9PqJ6DEOl6pZu3rWiFI~3byqDfT~98xdQ7D01kJKEynuKGxj1SnvbCHEXG2WGZt47tx3JenLQDvvQ83JglusUKkBROBv-P5iQQt14iPfJ0QYGw0AHZiadFJZtv1v73FPJJwpuEIpi0Etd5rTomBQRLSUQaKW-Q3TxgOfzB~BhM0KObcofzbraRhaT~k4j0GA1gY-lMdGZJ~3fGa-JNE0TpnIX99GgdpGEJuU9iJRl9XxsMnzD2uIHeMTiGkd0DMut4ERZNyOAVwN8Cx3PeovsWmX8RGrVpIFDeNhBU6304Ehvmm7sv2jK4TH2RsALqTqbghwWEwqxqwIAKCf0CzDg__&Key-Pair-Id=APKAIE5G5CRDK6RD3PGA)
