Key Points
Clot initiation and strength are altered in AD patient plasma and transgenic AD mouse model.
Clotting abnormalities are correlated with the cognitive state of AD patients.
Abstract
Alzheimer disease (AD) is a neurodegenerative disorder characterized by extracellular β-amyloid (Aβ) deposition. Although peripheral inflammation and cerebrovascular pathology are reported in AD, there is a lack of plasma biomarkers in this field. Because the contact system is triggered in patient plasma, we hypothesized that the hemostasis profile could be a novel biomarker in AD. Here, we assessed the clotting profile in plasma from AD patients and age-matched controls. Utilizing clinically relevant assays, thromboelastography and activated partial thromboplastin time, we found impaired clot initiation and formation rate in AD patient plasma. These coagulation end points correlated with cerebrospinal fluid neurofilament-light levels and cognition and were more profound in younger AD patients. Ex vivo intrinsic clotting of plasma from AD mice expressing human amyloid precursor protein (APP) was also delayed in an age-dependent manner, suggesting that this phenotype is related to APP, the parent protein of Aβ. Further analysis of coagulation factors in human plasma indicated that endogenous inhibitor(s) of factors XII and XI in AD plasma contribute to this delayed clotting. Together, these data suggest that delayed clotting in young AD patients is a novel biomarker and that therapies aimed to correct this phenotype might be beneficial in this patient population. Follow-up studies in additional AD patient cohorts are warranted to further evaluate these findings.
Introduction
Alzheimer disease (AD) is a neurodegenerative disorder associated with dementia in the aging population. Pathological hallmarks of AD include extracellular β-amyloid (Aβ) plaques, intracellular tau tangles, and neuronal loss.1 A large proportion of AD patients has cerebrovascular abnormalities, such as deposition of Aβ at the vessel wall known as cerebral amyloid angiopathy (CAA), microvascular degeneration, and vessel lumen narrowing.2-4 Examination of AD autopsy samples showed that concurrent vascular disease strongly correlates with cognitive dysfunction.5 Furthermore, alterations in cerebral blood flow, as measured by arterial spin labeling magnetic resonance imaging, occur prior to Aβ accumulation and tau deposition in late-onset AD patients in the Alzheimer’s Disease Neuroimaging Initiative cohort, suggesting that cerebrovascular and hemostatic systems may play a role in the etiology of the disease.6
Coagulation abnormalities have also been reported in AD patients. A study utilizing transcranial Doppler measurements showed that 40% of AD patients formed spontaneous cerebral emboli within a 1-hour time frame compared with 15% of age-matched controls. Interestingly, AD patients who were positive for cerebral emboli showed a more rapid rate of cognitive decline over the 6 months following transcranial Doppler measurements.7 Although, paradoxically, 20% to 30% of AD patients suffer from an increased incidence of cerebral microbleeds.8-9 These hemorrhages may be secondary to vessel damage after ischemia. These findings strengthen the idea that there is a mechanistic link between vascular/hemostatic abnormalities and AD.
Several studies indicate that the intrinsic/contact activation pathway is dysregulated in AD patients and AD animal models.10-14 The interaction of Aβ42 with the coagulation protein fibrinogen leads to the formation of tissue plasminogen activator (tPA)-resistant clots when clotting is initiated directly via thrombin.15-18 Furthermore, Aβ42 activates factor XII (FXII) in wild-type (WT) mouse plasma,12 and transgenic AD mice depleted of FXII show reduced fibrin(ogen) deposition.14 The contact pathway initiates prothrombotic (via FXI) and proinflammatory (via plasma kallikrein and high molecular weight kininogen) pathways19-20 and, thus, may play a role in the vascular and inflammatory aspects of AD pathology.14
These findings led us to hypothesize that monitoring the intrinsic pathway via clinical-based assay systems could provide a useful physiological biomarker in AD patients. In this study, we used 2 independent techniques to analyze AD patient plasma and nondemented (ND) age-matched control plasma: thromboelastography (TEG), which measures the viscoelastic property of the clot as it is formed and degraded,21 and activated partial thromboplastin time (aPTT), which measures the absorbance of light in a microtiter plate to assess the clotting profile.22-23 Both methods revealed that clot initiation and the rate of clot formation were abnormal in AD plasma compared with ND plasma. Similar results were also observed with plasma from a transgenic AD mouse model. These data indicate that AD patients have attenuated clotting of the intrinsic pathway and suggest the possibility of novel therapies targeted to this system.
Material and methods
Human plasma and CSF
Plasma from AD patients and ND controls was purchased from a commercial biobank vendor (PrecisionMed Inc., San Diego, CA). Plasma was thawed at 37°C for 3 minutes before performing coagulation assays. None of the donors used for this study were taking anticoagulants. ND controls had a mini–mental state examination (MMSE) score >29, and those of AD patients were <26. Coagulation factor–deficient plasmas were purchased from George King Biomedical, Inc. Normal pooled plasma (NPP) isolated from blood collected in EDTA was obtained from Innovative Research.
Mouse plasma samples
Plasma was collected from Tg679924 mice and their WT littermates at ages 5 months (males and females) and at ages 9, 14, and 18 months (females) (n = 7-12). Blood was drawn into polypropylene tubes (Thermo Fisher Scientific) containing a one-tenth volume of sodium citrate (105 mM). Plasma was prepared by centrifuging blood at 1500g for 15 minutes. The top layer was transferred into a new tube, and this preparation was centrifuged again at 1500g for 15 minutes at room temperature. Plasma was stored at −80°C.
TEG analysis
Analysis was performed on TEG 5000 Hemostasis analyzers (Haemonetics, Braintree, MA) using TEG software (Version 4.0), according to the manufacturer’s instructions, following calibration with LEVEL I and LEVEL II CONTROL (Haemonetics). EDTA-plasma from AD patients or age-matched ND subjects was dosed with tPA (Genentech, San Francisco, CA) and diluted in 20 mM HEPES [4-(2-hydroxyethyl)-1-piperazineethanesulfonic acid], 150 mM sodium chloride, pH 7.4, to a final concentration of 3.5 nM. tPA-dosed plasma (700 μL) was added to a vial containing 40 μL of kaolin (Haemonetics, concentration proprietary) and gently mixed. Part of this mixture (340 μL) was added to a TEG cup containing 20 μL of 0.2 M CaCl2 (Haemonetics). Reactions were immediately commenced upon addition of plasma to the TEG cup and run for a minimum of 60 minutes at 37°C, until maximum amplitude (MA) was achieved. All human plasma samples were run in duplicate. The speed and strength of clot formation are conveyed by a series of TEG parameters: (1) clotting time or reaction time, the time required for clotting to reach an amplitude of 2 mm; (2) clot formation time or clot firmness, the time required for the reaction to reach an amplitude of 20 mm; (3) alpha angle, the angle measured between clotting time/reaction time and clot formation time/clot firmness values and a measure of clot strength related to thrombin burst and amplification; and (4) MA, also a measure of clot strength. Blood-clotting parameter values were exported and analyzed in Microsoft Excel (Version 2010).
aPTT test in human and mouse plasma
Plasma was thawed at 37°C for 3 minutes, and 10 µL of plasma was diluted in 10 µL of 20 mM HEPES, 140 mM NaCl, pH 7.4, in a 384-well microtiter plate. The intrinsic pathway was initiated by adding 20 µL of aPTT reagent solution (APTT-XL; Pacific Hemostasis), an ellagic acid–based aPTT activator. Clot formation was initiated by adding 20 µL of 25 mM CaCl2 solution (after 3 minutes of incubation of plasma at 37°C with activator). The plate was shaken for 3 seconds inside the microtiter plate reader (SpectraMax Plus 384; Molecular Devices), and absorbance readings were recorded every 5 seconds at 350 nm. The clotting start time and initial clotting rate were determined using SoftMax Pro 6.1 software (Molecular Devices). The clotting start time was defined as the beginning of the log phase of the sigmoidal clot formation absorbance curve (time point on the absorbance vs time curve from where the detectable linear increase in absorbance begins). The initial rate of clot formation was calculated as the rate of increase in absorbance at 350 nm using the time points of clot formation in the linear portion (1 minute from clotting start time) of the absorbance curve vs time curve.
aPTT assays of AD and WT littermate mouse plasmas were performed in 96- or 384-well microtiter plates at room temperature. For the 96-well plate assays, 30 µL of plasma was half-diluted in 20 mM HEPES. Then, 30 µL of ellagic acid–based aPTT activator solution was added. Immediately after addition of activator solution, 30 µL of CaCl2 (6.25 mM) was added to each well to initiate clot formation. The plate was shaken for 3 seconds inside the plate reader and then absorbance was recorded every 6 seconds at 405 nm. For 384-well assays, 10 µL of plasma was half-diluted in buffer, and the intrinsic pathway was initiated by 20 µL of aPTT activator, followed by 20 µL of CaCl2 (6.25 mM). The plate was shaken for 3 seconds, and absorbance readings were recorded every 5 seconds at 350 nm. The clotting start time was calculated as described above.
Plasma-mixing experiments
NPP was mixed 1:1 with ND or AD plasma samples, and aPTT was performed. As a control, NPP was run alone. Commercially available coagulation factor–deficient plasmas were mixed with ND and AD plasma samples before performing aPTT assays, as described above for human plasma. Plasma deficient in FIX, FX, FXI, or FXII (George King Biomedical, Inc.) was diluted by one tenth with ND or AD plasma (9 µL of factor-deficient plasma/1 µL of ND or AD plasma). A 10-µL sample of factor-deficient plasma was used as a control. All experiments were performed in duplicate.
Detailed statistical and independent analytical methods can be found in supplementary Methods.
Results
Clot initiation and strength are altered in AD patient plasma, as assessed by TEG and aPTT
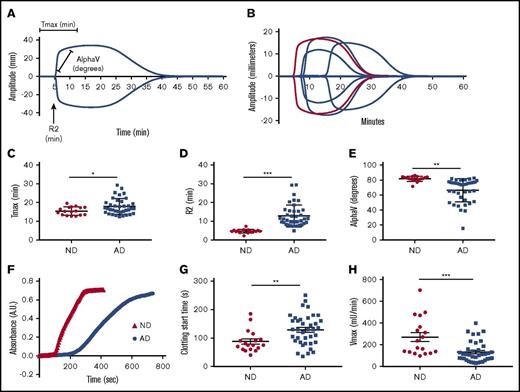
We used 2 assays to assess the intrinsic pathway clotting profiles of plasma from ND controls and AD patients (Table 1). TEG was used to assess clotting via kaolin (Figure 1A-B). The time to achieve maximum clot strength (Tmax) (Figure 1C) and the clot initiation time (R2) (Figure 1D) were significantly delayed in AD plasma samples compared with age-matched ND controls. Alpha, the rate at which the clot forms, was significantly decreased in AD plasma samples (Figure 1E). All TEG end points generated are reported in Table 2 and supplemental Table 1. Data are graphed as mean with SD. Because citrated plasma is typically used for coagulation studies, we collected plasma from healthy individuals in EDTA or citrate and ran plasma side-by-side on the TEG (supplemental Figure 1A). Our results show that the clotting profiles are very similar for the 2 anticoagulants.
Intrinsic clotting profile is altered in AD patient plasma. Intrinsic clotting in ND and AD plasma was assessed by TEG and microtiter plate–based aPTT. (A) TEG trace from normal plasma indicates the origin of the graphed metrics. (B) Representative TEG traces from ND and AD plasma (red = 1 ND donor, blue = 3 AD donors). (C) Tmax. (D) R2. (E) Rate of clot formation (alpha). (F) Representative spectra of ND and AD plasma in the aPTT assay. (G) Clotting start time. (H) Clotting rate (Vmax) in ND and AD plasma assessed in the aPTT assay. All scatter graphs are the mean with SD. *P < .05, **P < .01, ***P < .001. The unpaired Student t test was used to determine statistical significance in panels C-E and G-H.
Intrinsic clotting profile is altered in AD patient plasma. Intrinsic clotting in ND and AD plasma was assessed by TEG and microtiter plate–based aPTT. (A) TEG trace from normal plasma indicates the origin of the graphed metrics. (B) Representative TEG traces from ND and AD plasma (red = 1 ND donor, blue = 3 AD donors). (C) Tmax. (D) R2. (E) Rate of clot formation (alpha). (F) Representative spectra of ND and AD plasma in the aPTT assay. (G) Clotting start time. (H) Clotting rate (Vmax) in ND and AD plasma assessed in the aPTT assay. All scatter graphs are the mean with SD. *P < .05, **P < .01, ***P < .001. The unpaired Student t test was used to determine statistical significance in panels C-E and G-H.
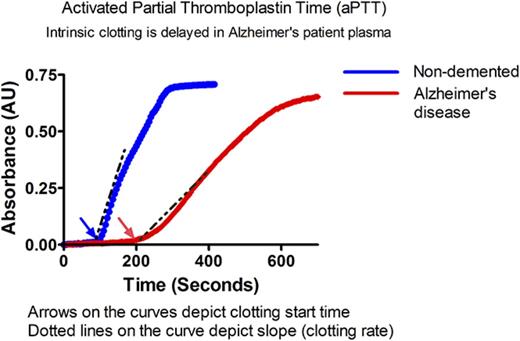
Similar results were found in a plate-based aPTT assay in which ellagic acid was used to initiate clotting (Figure 1F). The clotting profile was measured by changes in absorbance over time. Each clotting reaction was a typical sigmoidal turbidity graph with a lag phase, log phase, and stationary phase. The beginning of the log phase was considered the clotting start time in our assay, whereas the stationary phase was considered to represent “completeness of clotting” (Figure 1F). Clotting start times of AD and ND control samples were calculated as described above. The clotting start time of AD plasma was significantly delayed compared with ND plasma (Figure 1G) (128.9 ± 53.4 vs 87.5 ± 38.3 seconds, respectively, P < .01). This assay also revealed that the maximum velocity (Vmax), an end point that is similar to alpha, was significantly reduced in AD patient plasma (Figure 1H) (ND: 270.3 ± 173.7 vs AD: 132 ± 94.50 mU/min, P < .001). To further show that the use of EDTA in the aPTT assay did not influence our results, we collected blood from healthy individuals in EDTA, citrate, or heparin. The clotting profile of plasma isolated from blood collected in EDTA was right shifted compared with citrate; however, the overall profiles were very similar. These results are in contrast to the plasma isolated from blood collected in heparin, which did not clot, as expected (supplemental Figure 1B).
We did not find a significant difference in prothrombin time between ND and AD plasma, demonstrating that activation of the extrinsic pathway results in a normal clotting profile in AD patient samples (supplemental Figure 2).
Abnormal clotting end points generated via TEG are age related
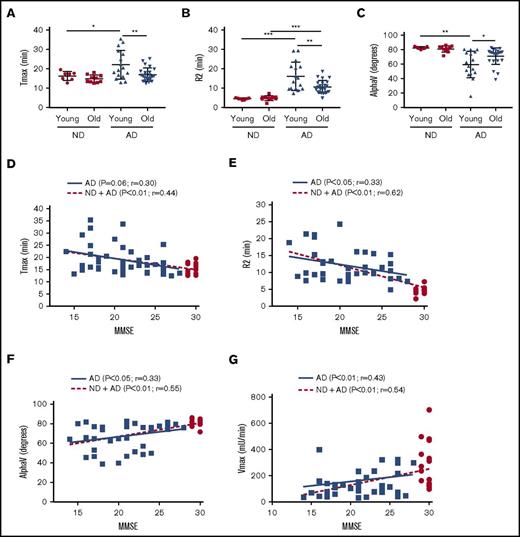
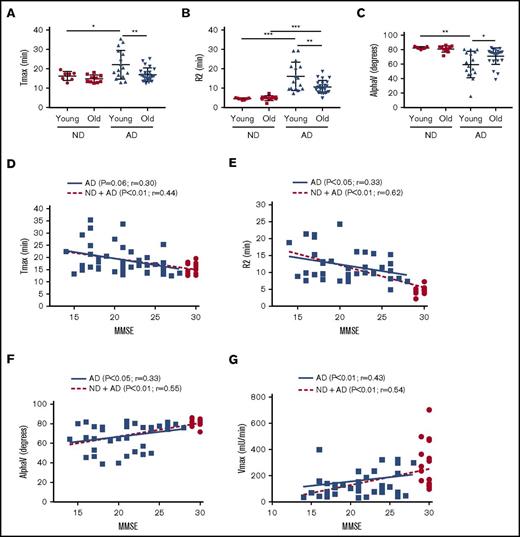
Age is the largest risk factor for the development of AD. We separated the AD cohort into a “young” group (50-65 years) and an “old” group (66-80 years) and plotted Tmax (Figure 2A), R2 (Figure 2B), and AlphaV (Figure 2C). Our results indicate that the young AD group had more significant abnormalities in clotting than did the older group with regard to all 3 end points. Correlation of TEG-generated metrics with TEG-independent analysis and aPTT assay can be found in supplemental Figure 3.
Intrinsic clotting abnormality is more profound in younger AD patient plasma and correlated inversely with MMSE score. ND and AD plasma samples were separated into a “young” group (50-65 years) and an “old” group (66-80 years), and different TEG parameters were analyzed. Tmax (A), R2 (B), and alpha (C) graphed by age group. (D) Correlation of Tmax and MMSE score. (E) Correlation of R2 and MMSE score. (F) Correlation of alpha V and MMSE score. (G) Correlation of Vmax (from aPTT assay) and MMSE score. In panels D-G, red dots represent ND samples, and blue squares represent AD samples. In panels A-C, 2-way analysis of variance (ANOVA) revealed that age category and group, but not their interaction, were significantly different. In panels D-G, correlations were assessed for all subjects and within the AD group only via Pearson’s method. r = Pearson’s correlation coefficient. *P < .05, **P < .01, ***P < .001.
Intrinsic clotting abnormality is more profound in younger AD patient plasma and correlated inversely with MMSE score. ND and AD plasma samples were separated into a “young” group (50-65 years) and an “old” group (66-80 years), and different TEG parameters were analyzed. Tmax (A), R2 (B), and alpha (C) graphed by age group. (D) Correlation of Tmax and MMSE score. (E) Correlation of R2 and MMSE score. (F) Correlation of alpha V and MMSE score. (G) Correlation of Vmax (from aPTT assay) and MMSE score. In panels D-G, red dots represent ND samples, and blue squares represent AD samples. In panels A-C, 2-way analysis of variance (ANOVA) revealed that age category and group, but not their interaction, were significantly different. In panels D-G, correlations were assessed for all subjects and within the AD group only via Pearson’s method. r = Pearson’s correlation coefficient. *P < .05, **P < .01, ***P < .001.
Clotting abnormalities are correlated with MMSE score
The cognitive ability of AD patients and ND individuals was assessed using MMSE. The MMSE score is inversely correlated with the cognitive ability of a patient. The maximum MMSE score is 30; all of our ND controls scored 29 or 30, whereas our AD patients scored <26. In our linear correlation graph, we found that MMSE score was negatively correlated with TEG end points Tmax (Figure 2D) and R2 (Figure 2E) and was positively correlated with AlphaV (Figure 2F), as well as the aPTT end point Vmax (Figure 2G).
Clotting end points are correlated with cerebrospinal fluid neurofilament-light levels
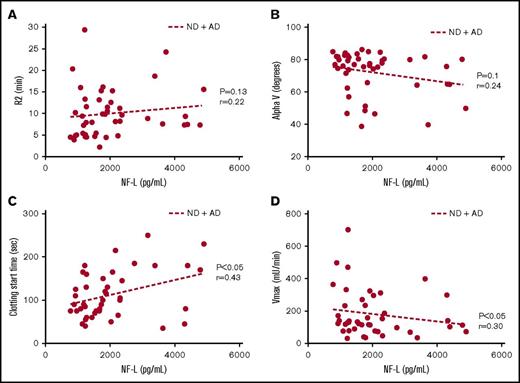
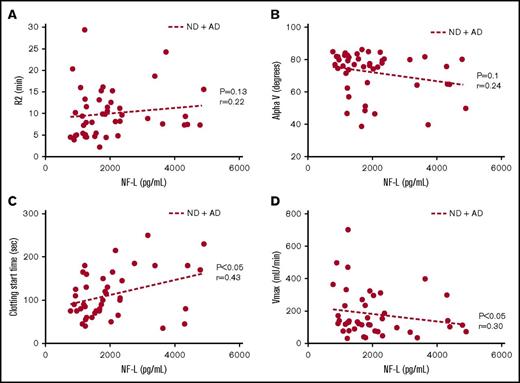
Cerebrospinal fluid (CSF) neurofilament-light (NF-L) levels have been reported as a biomarker of neurodegeneration in AD.25-26 In line with the reported literature, we found a significant increase in NF-L levels in the CSF of AD patients compared with ND controls (Table 1). Levels of this biomarker showed a trend toward a correlation with R2 (Figure 3A) and AlphaV (Figure 3B) generated by TEG and a significant correlation with clotting start time (Figure 3C) and Vmax (Figure 3D) values from aPTT.
Coagulation assay end points correlate with CSF NF-L levels. (A) Trend toward a positive correlation between R2 and NF-L. (B) Trend toward a negative correlation between alpha (rate of clot formation) and NF-L. (C) Significant positive correlation between clot start time and NF-L. (D) Significant negative correlation between Vmax and NF-L. Correlations were assessed for all subjects via Pearson’s method. r = Pearson’s correlation coefficient.
Coagulation assay end points correlate with CSF NF-L levels. (A) Trend toward a positive correlation between R2 and NF-L. (B) Trend toward a negative correlation between alpha (rate of clot formation) and NF-L. (C) Significant positive correlation between clot start time and NF-L. (D) Significant negative correlation between Vmax and NF-L. Correlations were assessed for all subjects via Pearson’s method. r = Pearson’s correlation coefficient.
Mixing experiments suggest the presence of FXII and/or FXI functional inhibitor(s) in AD plasma
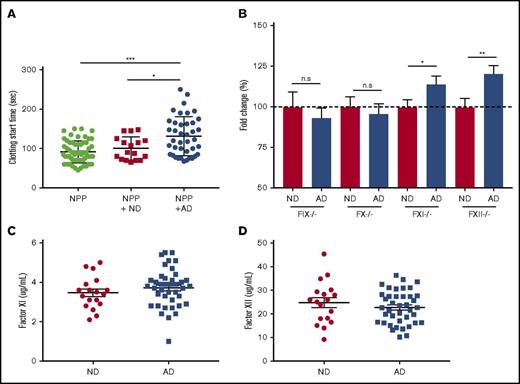
To better understand the mechanism of delayed clotting in AD plasma, we used 2 plasma-mixing experiments. We conducted a 1:1 mixing experiment in which AD or ND plasma was added to NPP and run on the aPTT assay. NPP mixed with AD plasma clotted significantly more slowly than did NPP or NPP mixed with ND (Figure 4A). These data indicated the presence of a functional inhibitor in the AD plasma. We next sought to determine whether AD plasma could correct the clotting abnormality of plasma deficient in various coagulation factors in the aPTT assay. When factor-deficient plasma samples are activated in the aPTT assay, clotting start time is drastically delayed. When normal plasma is mixed with factor-deficient plasma and run on the aPTT assay, the clotting time returns to normal. For these experiments, we used plasma deficient in FXII, FXI, FIX, or FX and added back plasma from ND or AD donors (9:1 mixing ratio). This was done to dilute the inhibitor amount in AD plasma so that we could determine the specificity of inhibitor to any coagulation factor, even at a very low concentration. Data are represented as fold change over the ND values (Figure 4B). The addition of ND plasma corrected the clotting time in all of the factor-deficient plasma and is represented as 100%. However, when AD plasma was mixed with FXII- or FXI-deficient plasma, clotting start time was significantly delayed compared with ND plasma. There was no difference between groups when ND and AD plasma were mixed with FIX- or FX-deficient plasma (supplemental Figure 4). We did not find any significant differences in the plasma protein levels (total and activated) of FXI (Figure 4C) or FXII (Figure 4D) in AD patient plasma, suggesting the presence of functional inhibitor(s) of these factors in AD.
FXII and FXI functional inhibitor(s) are likely to be responsible for coagulopathy in AD samples. (A) Clotting start time of NPP and NPP mixed with ND or AD plasma was assessed via aPTT. (B) Plasma deficient in FIX, FX, FXI, or FXII was mixed with ND or AD plasma (9:1), and clotting start time was assessed via aPTT. Data are represented as the fold change over the average of the ND sample mixed with each factor-depleted plasma. Plasma protein levels of FXI (C) and FXII (D). For NPP-mixing experiments, 1-way ANOVA was performed with Tukey’s post hoc analysis. For each factor-depleted plasma experiment, the unpaired Student t test was performed between ND and AD with Welch’s correction. *P < .05, **P < .01, ***P < .001.
FXII and FXI functional inhibitor(s) are likely to be responsible for coagulopathy in AD samples. (A) Clotting start time of NPP and NPP mixed with ND or AD plasma was assessed via aPTT. (B) Plasma deficient in FIX, FX, FXI, or FXII was mixed with ND or AD plasma (9:1), and clotting start time was assessed via aPTT. Data are represented as the fold change over the average of the ND sample mixed with each factor-depleted plasma. Plasma protein levels of FXI (C) and FXII (D). For NPP-mixing experiments, 1-way ANOVA was performed with Tukey’s post hoc analysis. For each factor-depleted plasma experiment, the unpaired Student t test was performed between ND and AD with Welch’s correction. *P < .05, **P < .01, ***P < .001.
AD mouse plasma also shows age-dependent delayed clotting start time in aPTT test
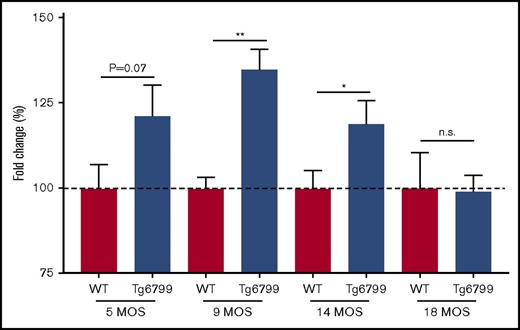
We hypothesized that the delayed clotting in AD patients could be related to Aβ, so we evaluated plasma from the Tg6799 mouse model of AD that overexpresses mutant human APP and PSEN1 to generate an abundance of Aβ.24 Most clinical coagulation assays are performed with citrated plasma; therefore, all mouse plasma was collected in citrate. For these studies, we ran plasma from 5-, 9-, 14-, and 18-month-old Tg6799 AD mice and WT littermates in the aPTT assay. We found that the difference in clotting start time between Tg6799 AD and WT littermates was age dependent, because there was a trending delay in 5-month-old mouse plasma and a significant delay in clotting start time in 9- and 14-month-old Tg6799 AD animals that was not detected in the 18-month-old mice (Figure 5; supplemental Figure 5). We also assessed prothrombin time in 14-month-old AD mice and found no significant difference between transgenic and age-matched WT animals (data not shown).
Clotting time is delayed in Tg6799 mice compared with WT littermates in an age-dependent manner. Clotting start time was assessed by aPTT in Tg6799 and age-matched littermate WT animals. Data are represented as a fold change compared with the average WT clotting time for each age group. *P < .05, **P < .01, unpaired Student t test.
Clotting time is delayed in Tg6799 mice compared with WT littermates in an age-dependent manner. Clotting start time was assessed by aPTT in Tg6799 and age-matched littermate WT animals. Data are represented as a fold change compared with the average WT clotting time for each age group. *P < .05, **P < .01, unpaired Student t test.
Increased Aβ40/42 ratio in matched CSF of AD patients
Pittsburgh compound-B is commonly used as a radioactive tracer in positron emission tomography to quantify amyloid deposition in AD brain.27 However, Pittsburgh compound-B imaging was not available for the AD patients used in this study. Therefore, we sought to determine whether these patients were positive for Aβ-related biomarkers of the disease. The Aβ40/Aβ42 ratio is reported to be increased in AD patients, presumably because more Aβ42 is deposited in the brain and is not cleared to the CSF. Although we did not detect any significant changes between ND and AD CSF with regard to the levels of Aβ38 and Aβ40, we did detect significantly less Aβ42 in the CSF of AD patients. Also, the Aβ40/42 ratio was significantly higher in the AD group than in ND controls (Table 1). These data indicate that our AD patients do indeed show accepted biomarkers of the disease. Additionally, we compared levels of cleaved high molecular weight kininogen and FXII in the ND and AD CSF and found that levels were higher in the AD patient samples. These data are in line with previous findings that the contact system is activated in AD CSF28 (data not shown).
Discussion
Understanding abnormalities in the coagulation system of AD patients is important, because they suffer from spontaneous cerebral emboli,7,29 cerebral microbleeds (CMBs),8-9 an increased risk for stroke and intracerebral hemorrhage,30 and altered cerebral blood flow.31 Therefore, we compared the intrinsic clotting profile in AD patient plasma with that of age-matched ND individuals. We found that the activation of the intrinsic clotting cascade leads to a significant delay in clot initiation and a decreased rate of clot formation in AD patient plasma compared with plasma of age-matched controls, indicating that AD patients have clotting abnormalities.
We also report that abnormal clotting in AD plasma correlated with MMSE score. Although MMSE score is not specific to AD, it does give an overall view of the cognitive abilities of the patient.32-33 Although our data are correlative, they indicate a relationship between disturbances in clotting ability and general cognition of AD patients. This finding is further supported by the association of CSF NF-L levels with multiple clotting end points in TEG and aPTT tests. Higher CSF NF-L levels were detected in patients who had a greater degree of dysregulated clotting. Detection of NF-L levels in CSF and plasma is a relatively recent advance in the AD field, and this biomarker is thought to follow the progression of neurodegeneration occurring in patients and in animal models.34 The AD patient cohort tested in this study had significantly increased levels of CSF NF-L, providing further evidence that there is ongoing neurodegeneration in the sample population tested. Whether changes occurring in the coagulation system precede the onset of neurodegeneration and cognitive decline is unknown. Investigation into the clotting status of patients diagnosed with mild cognitive impairment (MCI) would be very informative, because MCI patients did not show a clear increase in CSF NF-L in a previous report.34
To investigate the mechanism behind delayed clotting in AD plasma samples, we performed mixing experiments with plasma deficient for coagulation factors within the intrinsic and common pathways. AD plasma did not correct clotting in plasma deficient of FXI or FXII to the same degree as ND plasma, indicating that an endogenous inhibitor of coagulation might be present in AD patient samples.
Aging is associated with altered levels of coagulation factors.35 Therefore, we also examined plasma levels of FXI and FXII and found that there were no significant differences between ND and AD groups. We also did not find a difference in the levels of these factors between samples taken from “young” and “old” patients (data not shown). These data suggest that the levels of these factors in plasma do not contribute to the age-related delay in clotting that we observed in our experiments.
There are several transgenic mouse models that mimic the Aβ-related pathologies of AD: parenchymal plaques and CAA.36 In our study, we used the Tg6799 mouse model that has been shown to be prothrombotic in models of endothelial injury.15 The aPTT analysis of plasma from this mouse line showed a delay in ex vivo clotting via the intrinsic pathway that was resolved by the age of 18 months. These data suggest that the phenotype observed in the AD patient samples could be related to APP.
Pathogenic Aβ peptides and soluble truncated forms of APP (sAPPα and sAPPβ) are generated upon APP cleavage.37-39 Aβ peptides are procoagulant, based on their ability to activate FXII, as well as bind fibrinogen to form fibrinolysis-resistant clots.15-16 Conversely, APP and sAPP have anticoagulant properties that are primarily shown to be mediated through the kunitz protease inhibitor domain.40-45 sAPPα and sAPPβ were reported to be increased in AD patient plasma in a small patient cohort.46 In addition to neurons, Aβ and sAPPs are secreted by platelets after activation with thrombin and collagen, and these cells are the biggest producers of Aβ and sAPP in the blood.47 Interestingly, it has been reported that AD patients have similar platelet counts as age-matched controls, but their platelets are in a more activated state.48-49 Whether APP/sAPPs are responsible for the phenotype in our patient cohort is unknown.
The data presented in this article are somewhat counterintuitive, because ischemic stroke is a risk factor for AD,30 and patients are reported to have increased formation of cerebral emboli, as well as altered levels of clotting-related proteins, such as increased plasma fibrinogen50 and plasminogen activator inhibitor-1.51 However, CMBs are present in 20-30% of AD patients, and these patients are more cognitively impaired than patients without CMB,52 yet this finding is not entirely conclusive.53 CAA is thought to contribute to the incidence of CMBs, but many more AD patients have CAA (80-90%) than have CMBs. It is reasonable to postulate that the coagulation system, which serves to prevent bleeding, is altered in AD, which may contribute to the incidence of CMBs. Although studies conducted in CMB-positive patients with ischemic stroke showed no association with extrinsic pathway–specific prothrombin time (PT) or aPTT54 readouts, CMBs occur in AD in the absence of stroke. Therefore, the mechanism of CMB formation is most likely quite different. Assessing clotting end points in patients for whom imaging for CMBs has been performed would be necessary to address this hypothesis. Furthermore, MCI patients also have a higher incidence of CMBs than healthy controls, yet they do not have increased levels of CSF NF-L, suggesting that CMBs may occur prior to overt neurodegeneration.9,34 The delayed clotting in AD plasma was inversely correlated with age, because the young group had a greater delay in clotting. Our clotting profile data in the AD population are variable and may be due to the presence of the various vascular pathologies discussed above. Future studies are needed to address whether these vascular pathologies are associated with the severity of coagulation abnormalities in AD.
A recently published study also analyzed the clotting profiles of demented patients using TEG.55 Results from this work indicated that platelet-poor plasma from Alzheimer-type dementia patients with sepsis was procoagulant. There are several differences between this study and ours. The mean age of their patients was 79 years, whereas the average age of our cohorts was 66 years. Furthermore, our patients did not show signs of peripheral infection, because there were no changes in plasma or CSF cytokines (data not shown). Lastly, recalcification was used in this study to initiate clotting rather than initiating via one of the classical activators of intrinsic or extrinsic coagulation. Another publication assessed PT in AD patients56 and found that it was still within the normal range (8.8-15 seconds) but was significantly longer than the controls. In our study, we did not find a significant difference between ND and AD plasma in the PT assay.
The findings reported in this study suggest that coagulation panels could be a novel biomarker for defining AD patient populations and end points for clinical trials. Assays, such as aPTT or TEG, may not be useful as stand-alone biomarkers for AD; however, in the presence of other evidence of AD pathology (eg, cognitive decline or abnormal Aβ in the parenchyma or CSF), these assays could identify a subset of patients with vascular pathology and help with individualized therapy. These data also bring to light specific hemostatic abnormalities in AD patients, and interventions designed to restore hemostatic imbalances in AD to prevent abnormal clotting without promoting thrombosis should be explored as a novel therapeutic option in AD. Follow-up studies in additional AD and MCI patient cohorts are needed to further explore these possibilities.
The full-text version of this article contains a data supplement.
Acknowledgments
This work was supported by National Institutes of Health, National Institute of Neurological Disorders and Stroke grant NS050537, the Cure Alzheimer’s Fund, the Rudin Family Foundation, the Mellam Family Foundation, Louis Herlands, and John A. Herrmann Jr.
Authorship
Contribution: G.L.S., P.K.S., S.P.-H., Z.-L.C., H.Y.-I., E.H.N., R.D.B., and S.S. designed experiments; G.L.S., P.K.S., S.P.-H., Z.-L.C., and H.Y.-I. performed experiments; all authors analyzed data; G.LS., P.K.S., E.H.N., and S.S. wrote the manuscript; and all authors edited and approved the final manuscript.
Conflict-of-interest disclosure: The authors declare no competing financial interests.
The current affiliation for G.L.S. is Biogen, Inc., Cambridge, MA.
Correspondence: Georgette L. Suidan, Biogen, Inc., Binney St, Cambridge, MA 02142; email: georgette.suidan@biogen.com; and Sid Strickland, Rockefeller University, 1230 York Ave, Box 169, New York, NY 10065; e-mail: strickland@mail.rockefeller.edu.
References
Author notes
G.L.S. and P.K.S. are joint first authors.

