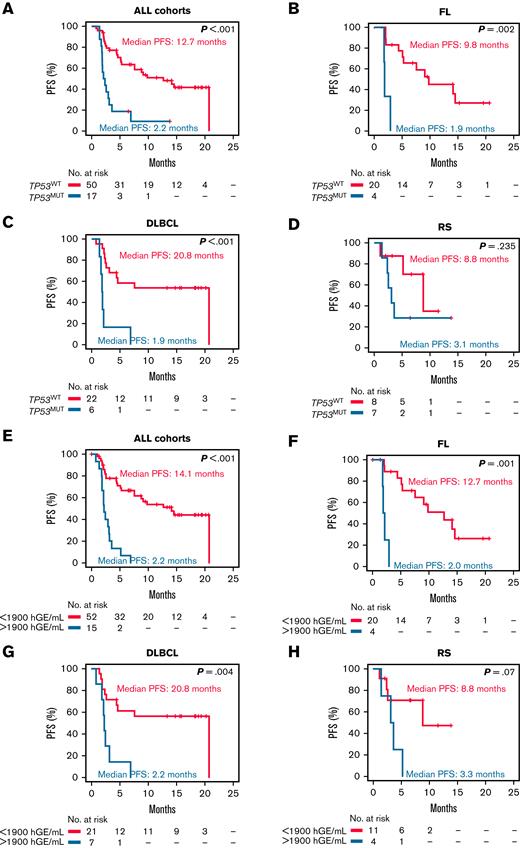
Kaplan-Meier curves of PFS stratified according to the pretreatment TP53 status and pretreatment ctDNA load. All cohorts stratified by TP53 mutation status (A), relapsed FL stratified by TP53 mutation status (B), relapsed DLBCL stratified by TP53 mutation status (C), and RS stratified by TP53 mutation status (D). Red: mutated (MUT); blue: wild-type (WT). All cohorts stratified by ctDNA load measured in haploid genomic equivalents per mL of plasma (E), relapsed FL stratified by ctDNA load (F), relapsed DLBCL stratified by ctDNA load (G), and RS stratified by ctDNA load (H). Red: ctDNA load <1900 hGE/mL of plasma; blue: ctDNA load >1900 hGE/mL of plasma.
Kaplan-Meier curves of PFS stratified according to the pretreatment TP53 status and pretreatment ctDNA load. All cohorts stratified by TP53 mutation status (A), relapsed FL stratified by TP53 mutation status (B), relapsed DLBCL stratified by TP53 mutation status (C), and RS stratified by TP53 mutation status (D). Red: mutated (MUT); blue: wild-type (WT). All cohorts stratified by ctDNA load measured in haploid genomic equivalents per mL of plasma (E), relapsed FL stratified by ctDNA load (F), relapsed DLBCL stratified by ctDNA load (G), and RS stratified by ctDNA load (H). Red: ctDNA load <1900 hGE/mL of plasma; blue: ctDNA load >1900 hGE/mL of plasma.
The publisher apologizes for the errors.


