Causes of death within subsequent 180 days. Causes of death stratified by post-HCT timepoint in patients with low EASIX (Fig 4a) and high EASIX (Fig 4b) at the day 180 landmark, when EASIX concordance with NRM was highest.
Causes of death within subsequent 180 days. Causes of death stratified by post-HCT timepoint in patients with low EASIX (Fig 4a) and high EASIX (Fig 4b) at the day 180 landmark, when EASIX concordance with NRM was highest.
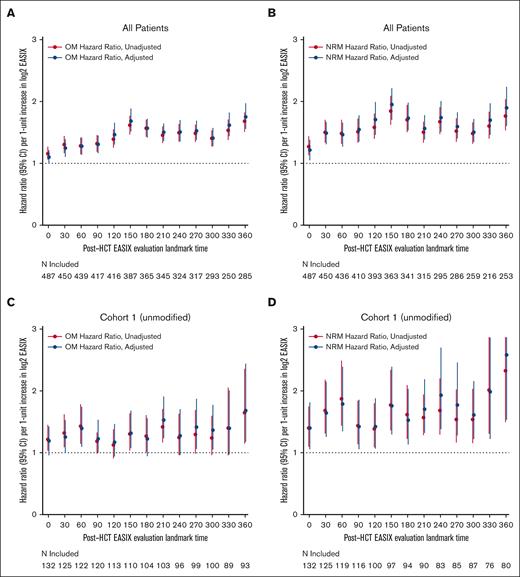
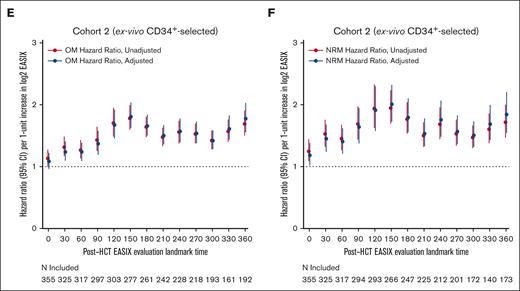
In Figure 5A, 5C, and 5E on pages 5904-5905, the red/blue color legends reading “OS Hazard Ratio, Unadjusted” and “OS Hazard Ratio, Adjusted,” should read “OM Hazard Ratio, Unadjusted” and “OM Hazard Ratio, Adjusted.” The corrected Figure 5 is shown below.Figure 5.
Varying association between EASIX and post-HCT outcomes over time. The hazard ratios for non-relapse mortality (NRM) and overall mortality (OM) events in the subsequent 180 days per 1-unit increase in log2 EASIX, and their variation over time post-transplantation. Adjustment factors include age, CD34-selection, and HCT-CI. Figures 5A-B include both cohorts; figures 5C-D include cohort 1 (unmodified) only; and figures 5E-F include cohort 2 (ex-vivo CD34+-selected) only.