Key Points
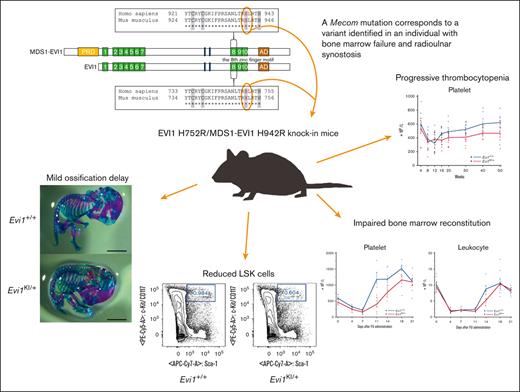
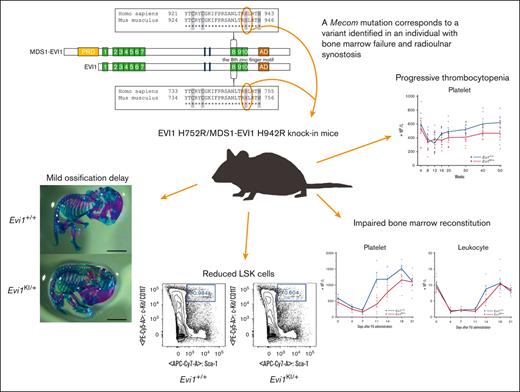
Mice with RUSAT-associated MECOM mutation were generated to investigate the impact on the phenotype of the organism.
The mice exhibited thrombocytopenia and reduced hematopoietic stem cells without radioulnar synostosis.
Abstract
Radioulnar synostosis with amegakaryocytic thrombocytopenia (RUSAT) is an inherited bone marrow failure syndrome characterized by the congenital fusion of the forearm bones. RUSAT is largely caused by missense mutations that are clustered in a specific region of the MDS1 and EVI1 complex locus (MECOM). EVI1, a transcript variant encoded by MECOM, is a zinc finger transcription factor involved in hematopoietic stem cell maintenance that induce leukemic transformation when overexpressed. Mice with exonic deletions in Mecom show reduced hematopoietic stem and progenitor cells (HSPCs). However, the pathogenic roles of RUSAT-associated MECOM mutations in vivo have not yet been elucidated. To investigate the impact of the RUSAT-associated MECOM mutation on the phenotype, we generated knockin mice harboring a point mutation (translated into EVI1 p.H752R and MDS1-EVI1 p.H942R), which corresponds to an EVI1 p.H751R and MDS1-EVI1 p.H939R mutation identified in a patient with RUSAT. Homozygous mutant mice died at embryonic day 10.5 to 11.5. Heterozygous mutant mice (Evi1KI/+ mice) grew normally without radioulnar synostosis. Male Evi1KI/+ mice, aged between 5 and 15 weeks, exhibited lower body weight, and those aged ≥16 weeks showed low platelet counts. Flow cytometric analysis of bone marrow cells revealed a decrease in HSPCs in Evi1KI/+ mice between 8 and 12 weeks. Moreover, Evi1KI/+ mice showed delayed leukocyte and platelet recovery after 5-fluorouracil–induced myelosuppression. These findings suggest that Evi1KI/+ mice recapitulate the bone marrow dysfunction in RUSAT, similar to that caused by loss-of-function Mecom alleles.
Introduction
Radioulnar synostosis with amegakaryocytic thrombocytopenia (RUSAT [MIM: PS605432]) is a genetic syndrome characterized by congenital bone marrow failure, radioulnar synostosis (RUS, fusion of the proximal part of the radius with the ulna), congenital heart disease, deafness, and malformation of the digits (such as clinodactyly and brachydactyly).1-6 Critical bone marrow failure necessitates hematopoietic stem cell transplantation in patients.1-4,6 Approximately 22 families have been reported to have individuals affected with RUSAT.1-10 Heterozygous mutations in homeobox A11 (HOXA11) and MDS1 and EVI1 complex locus (MECOM) have been identified as the underlying cause of RUSAT.4,10
MECOM is transcribed into several isoforms with alternative start and splicing sites.11 The major alternative translation products of MECOM are the zinc finger transcription factors EVI1, EVI1 Δ324, and MDS1-EVI1,11 of which EVI1 is the best-characterized isoform.11 EVI1 is a 1051–amino acid protein harboring 7 N-terminal zinc finger motifs at the N-terminus, 3 zinc finger motifs at the C-terminus, the C-terminal binding protein (CtBP) binding motif 1/2, and the acidic domain (Figure 1A).11,12 MDS1-EVI1 has a PRDF1-RIZ domain added at the N-terminal position of EVI1 (Figure 1A).11,12 EVI1 interacts with other transcription factors, including GATA1, PU.1, FOS, and SMAD3, to regulate transcription13 and plays a vital role in ontogenesis and hematopoiesis.11Evi1 is highly expressed in the urinary system, lungs, heart, and developing limbs of mouse embryos.14 During hematopoiesis, EVI1 binds to the promoter of GATA2, which encodes a transcription factor required for the proliferation and survival of early hematopoietic progenitor cells, through the N-terminal zinc finger domain.15,16 Furthermore, the eighth zinc finger motif of EVI1 represses the activity of RUNX1, another critical transcription factor involved in hematopoiesis.17 The overexpression of EVI1 or the formation of fusion proteins involving EVI1 because of chromosomal rearrangements at 3q26 leads to hematologic malignancies.17,18
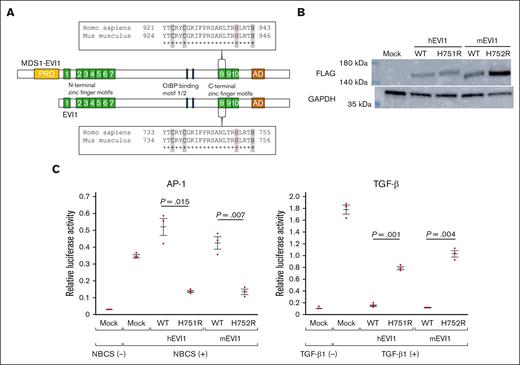
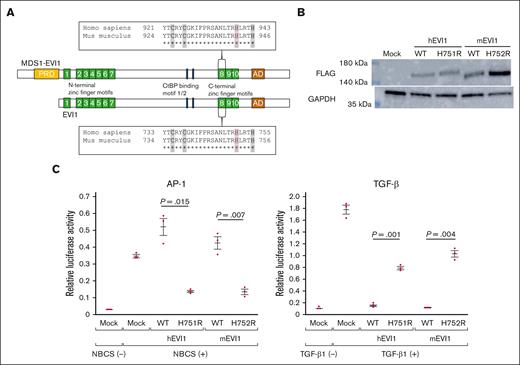
Generation of mutant mice harboring the point mutation translated into EVI1 H752R and MDS1-EVI1 H942R in mice, corresponding to EVI1 H751R and MDS1-EVI1 H939R in humans. (A) The point mutation is located in the eighth zinc finger motifs of EVI1 and MDS1-EVI1. The sequence of the eighth zinc finger motif is given in a box. “C” and “H,” shaded in a gray, bind to a zinc ion. EVI1 H751 in humans, MDS1-EVI1 H939 in humans, EVI1 H752 in mice, and MDS1-EVI1 in mice are represented in red letters. (B) Overexpression of C-terminal FLAG-tagged wild-type or mutant hEVI1/mEVI1 in NIH3T3 cells. (C) Luciferase assay for assessing the effects of wild-type or mutant hEVI1/mEVI1 on AP-1 and TGF-β signaling. pCAGGS empty vector (mock) indicates the effectiveness of newborn calf serum or TGF-β1 stimulation. The relationship between the reactions against the stimulation between wild-type and mEVI1 H752R resembles that between wild-type and hEVI1 H751R. Representative data from 3 experiments performed in triplicates are shown. Values are the mean ± standard error of the mean (SEM) of 3 samples of the representative experiment. Underlined numbers denote the P value (2-tailed Welch t test). Threshold significance level, P = .05.
Generation of mutant mice harboring the point mutation translated into EVI1 H752R and MDS1-EVI1 H942R in mice, corresponding to EVI1 H751R and MDS1-EVI1 H939R in humans. (A) The point mutation is located in the eighth zinc finger motifs of EVI1 and MDS1-EVI1. The sequence of the eighth zinc finger motif is given in a box. “C” and “H,” shaded in a gray, bind to a zinc ion. EVI1 H751 in humans, MDS1-EVI1 H939 in humans, EVI1 H752 in mice, and MDS1-EVI1 in mice are represented in red letters. (B) Overexpression of C-terminal FLAG-tagged wild-type or mutant hEVI1/mEVI1 in NIH3T3 cells. (C) Luciferase assay for assessing the effects of wild-type or mutant hEVI1/mEVI1 on AP-1 and TGF-β signaling. pCAGGS empty vector (mock) indicates the effectiveness of newborn calf serum or TGF-β1 stimulation. The relationship between the reactions against the stimulation between wild-type and mEVI1 H752R resembles that between wild-type and hEVI1 H751R. Representative data from 3 experiments performed in triplicates are shown. Values are the mean ± standard error of the mean (SEM) of 3 samples of the representative experiment. Underlined numbers denote the P value (2-tailed Welch t test). Threshold significance level, P = .05.
Recent studies have identified MECOM variants in individuals with congenital bone marrow failure with or without RUS (supplemental Figure 1).1-9,19-22 In addition, other skeletal anomalies of the forearms and hands, congenital heart diseases, and renal anomalies were also involved with variable penetrance.1,2,4-7,9,20,22 The term “MECOM-associated syndrome” is proposed to represent this heterogeneous disease.2 Individuals with congenital bone marrow failure without RUS exhibit nonsense, insertion/deletion, or splicing variants that result in a premature termination codon in MECOM (supplemental Figure 1).1,2,19,20,22-26 RUSAT-associated mutations are located in the eighth and ninth zinc finger motifs, suggesting that RUSAT-associated mutations may have particular intravital effects (supplemental Figure 1).1-9 Thus far, no RUSAT animal models have been developed. Therefore, the effects of RUSAT-associated Mecom mutations on hematopoiesis and skeletal development have not been analyzed in vivo.
In this study, we generated knockin mice harboring mouse Mecom c.2255A>G in XM_006535394.4 (translating into EVI1 [XP_006535457.1] p.H752R and MDS1-EVI1 [NP_001347963.1] p.H942R), corresponding to the pathogenic human MECOM c.2252A>G in NM_001105078.4 (translating into EVI1 [NP_001098548.2] p.H751R and MDS1-EVI1 [NP_004982.2] p.H939R; Figure 1A)4; we have designated the human EVI1 as hEVI1, the human MDS1-EVI1 as hMDS1-EVI1, the mouse EVI1 as mEVI1, and the mouse MDS1-EVI1 as mMDS1-EVI1. The heterozygous mutant mice (Evi1KI/+ mice) exhibited peripheral blood and hematopoietic stem cell (HSC) abnormalities but not RUS, whereas homozygous mutant mice (Evi1KI/KI mice) were embryonic lethal. Our findings indicate that RUSAT-associated MECOM missense mutation has a similar effect to loss-of-function alleles in hematopoiesis.
Materials and methods
Plasmid construction, western blot, and luciferase assay
Plasmid generation, western blot, and luciferase assay are described in supplemental Methods. Briefly, pCAGGS plasmids containing complementary DNA encoding the C-terminal FLAG-tagged human EVI1 wild-type, human EVI1 mutant (H751R), mouse Evi1 wild-type, or mouse Evi1 mutant (H752R) were generated. For western blots, NIH3T3 cells (American Type Culture Collection, Manassas, VA) were transfected with one of these plasmids or an empty pCAGGS vector. pAP1-Luc (Agilent Technologies, Santa Clara, CA) or p3TP-lux (Addgene plasmid # 11767) reporter vectors were used in the luciferase assay to assess activator protein 1 (AP-1) or transforming growth factor β (TGF-β) signaling.
Generation of the Evi1KI/+ knockin mice
A gene-targeting strategy was used to generate the Evi1KI/+ knockin mice. The targeting vector was electroporated into embryonic stem cells derived from C57BL/6 mice. Neomycin selection was performed to isolate homologous recombinant ES cells. Homologous recombination was confirmed using Southern blotting. Blastocysts from BALB/c mice were used for homologous recombinant ES cell injection. ICR mice were used as the foster mothers. The chimeric mice obtained were identified based on their coat colors. The chimeras obtained were crossed with wild-type mice. Selected offspring with the heterozygous targeted allele were then crossed with CAG-Cre mice to excise floxed DNA segments, resulting in the Evi1KI/+Cre mice. These mice were crossed with wild-type mice to obtain the Evi1KI/+ mice lacking the Cre allele. The primers for Southern blot probes and a schema are provided in supplemental Table 1 and supplemental Figure 2, respectively.
Survival curve, body weight, and digit length of Evi1+/+ and Evi1KI/+ mice
We evaluated the survival curve and body weight of offspring from 4 pairs of Evi1+/+ and Evi1KI/+ mice. Nine male Evi1+/+, 8 male Evi1KI/+, 10 female Evi1+/+, and 6 female Evi1KI/+ offspring were obtained. The observation period was 1 year. At 5 to 15 weeks, the body weight of the mice was measured once a week. We evaluated 15-week-old Evi1+/+ and Evi1KI/+ age- and sex-matched littermates (Evi1+/+, n = 7; Evi1KI/+, n = 7) for digit length. We calculated the average of D3 digit/palm length of both hands of the mice.
Skeletal staining
The staining protocol is provided in supplemental Methods and supplemental Figure 3A. The evaluated mice were as follows: embryonic day 18.5 (E18.5) male Evi1+/+ (n = 3), E18.5 female Evi1+/+ (n = 5), E18.5 male Evi1KI/+ (n = 4), E18.5 female Evi1KI/+ (n = 3), postnatal day 0 (P0) male Evi1+/+ (n = 3), P0 female Evi1+/+ (n = 4), P0 male Evi1KI/+ (n = 2), and P0 female Evi1KI/+ (n = 4). As described in the study by Chang et al,27 the ossification level was evaluated using the ossified fraction, which was determined as the ratio of ossified length to the total length of the bone (supplemental Figure 3B).
CBC, megakaryocyte count, and morphology
Complete blood counts (CBCs) of Evi1+/+ and Evi1KI/+ age- and sex-matched littermates (Evi1+/+; n = 10, Evi1KI/+; n = 10) were determined using a particle counter (PCE 310; Erma, Tokyo, Japan). Megakaryocyte counts of 13-week-old Evi1+/+ and Evi1KI/+ mice (Evi1+/+, n = 4; Evi1KI/+, n = 4) were performed using flow cytometry analysis as described by Winter et al,28 with modification. The relationship between aging and the presence of megakaryocytes was analyzed using bone marrow cells (BMCs) from Evi1KI/+ mice. Megakaryocyte morphology was observed using between 8- and 12-week-old Evi1+/+ and Evi1KI/+ age- and sex-matched littermates (Evi1+/+, n = 4; Evi1KI/+, n = 4) and between 10- and 52-week-old Evi1KI/+ mice. Detailed protocols are provided in the supplemental Methods.
Flow cytometry of lineage-negative cells
FU treatment
5-fluorouracil (FU; 200 mg/kg; Towa Pharmaceutical, Osaka, Japan) was administered intraperitoneally to 8-week-old Evi1+/+ and Evi1KI/+ littermates (Evi1+/+, n = 7; Evi1KI/+, n = 7). CBC was performed on days 0 (immediately before FU administration), 4, 7, 11, 14, 18, and 21. Peripheral blood was analyzed using a particle counter PCE 310.
Statistics
Graphs were drawn using JMP 16 software (SAS Institute Inc., Cary, NC). Error bars represent the mean ± standard error of the mean. A 2-tailed Welch t test was performed using Microsoft Excel (Microsoft Corporation, Redmond, WA) to assess the means of the 2 populations. To assess whether livebirth offspring were born in accordance with the Mendelian ratio, the χ2 goodness-of-fit test was performed using R version 4.2.2. Statistical significance was set at P = .05.
Study approval
Genetic recombination experiments were approved by The Tohoku University Expert Committee on Genetic Recombination Experiments Security. Animal studies were approved by The Institutional Animal Care and Use Committee of the Tohoku University Environmental & Safety Committee.
Results
Modulation of AP-1 and TGF-β signaling by mEVI1 H752R is similar to that of their human counterparts
Firstly, we evaluated whether the function of mEVI1 H752R, as a transcriptional regulatory factor, is similar to that of hEVI1 H751R, the corresponding human mutant gene. NCBI protein BLAST revealed 93% homology and 95% similarity between hEVI1 and mEVI1.31,32 The homology and similarity between hMDS1-EVI1 and mMDS1-EVI1 was 93% and 95%, respectively.31,32 We introduced the wild-type and mutant hEVI1/mEVI1-FLAG into NIH3T3 cells (Figure 1B) and performed luciferase assays to examine the activation of AP-1 and TGF-β signaling, similar to our previous study.4 We assessed the activation of AP-1 signaling using the pAP1-Luc reporter vector containing specific transcription recognition sequences for AP-1. Under serum stimulation, the relative luciferase activity (RLA) of cells transfected with pAP1-Luc and hEVI1 H751R was lower than that of cells transfected with wild-type hEVI1 (Figure 1C). Similarly, RLA in cells expressing mEVI1 H752R was significantly lower than that in cells expressing wild-type mEVI1 (Figure 1C). Activation of TGF-β signaling was assessed using the p3TP-lux reporter construct containing 3 12-O-tetradecanoylphorbol 13-acetate response elements and a part of the plasminogen activator inhibitor 1 promoter region. The RLA in cells transfected with wild-type hEVI1 was suppressed compared with that in cells transfected with the empty vector (Figure 1C). RLA in cells expressing hEVI1 H751R was remarkably increased compared with that in cells expressing wild-type hEVI1, suggesting a weaker suppressive effect on TGF-β signaling by mutant EVI1 (Figure 1C). We observed the same effect on TGF-β signaling in cells expressing their mouse counterparts (Figure 1C). These results indicate that mEVI1 H752R is, at least in part, functionally similar to hEVI1 H751R.
Generation of Evi1KI/+ knockin mice
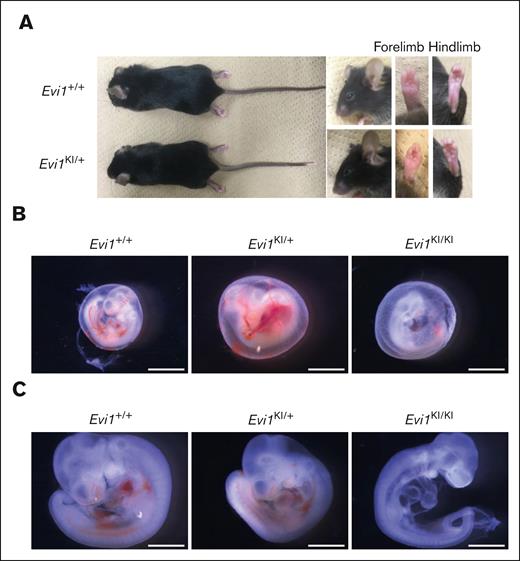
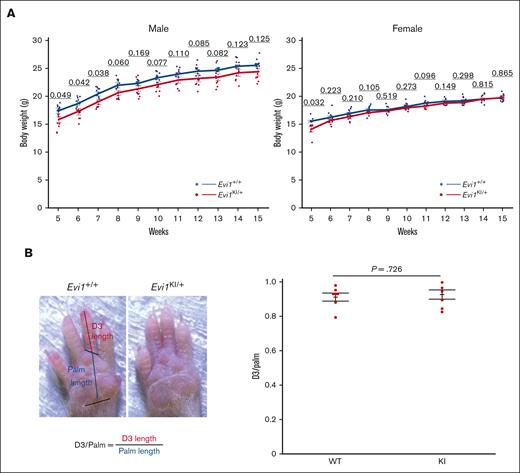
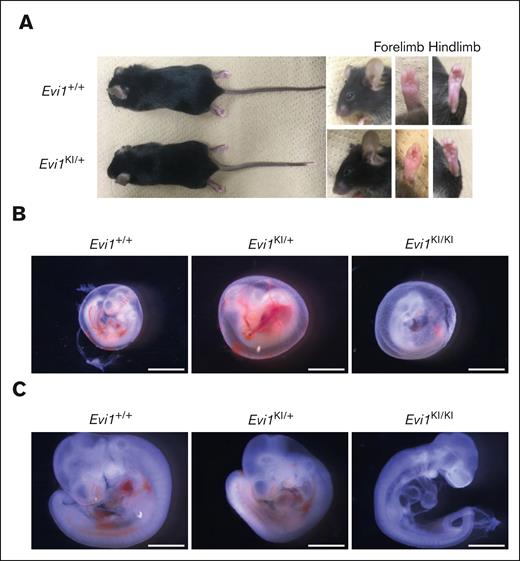
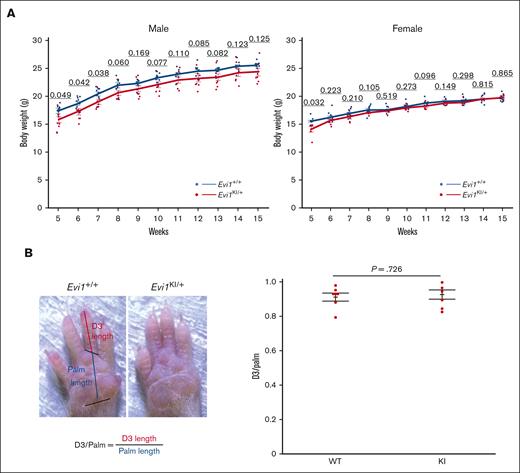
We generated Evi1KI/+ knockin mice to evaluate the function of mutant Evi1 in RUSAT using a gene-targeting strategy (supplemental Figures 2 and 4A). Sequence analysis of complementary DNA obtained from the leukocytes, liver, heart, kidney, and the spleen of Evi1KI/+ mice demonstrated that both the wild-type and H752R Evi1 messenger RNA were expressed (supplemental Figure 4B). We confirmed the protein expression of MDS1-EVI1 and EVI1 via western blot analysis using embryonic fibroblasts derived from Evi1+/+, Evi1KI/+, and Evi1KI/KI mice (supplemental Figure 4C). DNA extracted from tails, embryos, embryonic fibroblasts, or yolk sacs was used for genotyping (supplemental Figure 4D). Evi1KI/+ mice exhibited no gross morphological differences compared with their Evi1+/+ littermates (Figure 2A). At E10.5, most of the Evi1KI/KI mice had avascular yolk sacs, decreased blood vessels in the head and bodies, and flattened heads (Figure 2B-C). They were almost the same size as the Evi1+/+ and Evi1KI/+ mice (Figure 2B-C). At E11.5, all the Evi1KI/KI mice had died (Table 1). The results indicated that Evi1KI/KI mice died at E10.5 through E11.5. In contrast, Evi1KI/+ mice were born at the expected Mendelian ratio of 1:1 from the Evi1+/+ and Evi1KI/+ mice (supplemental Table 3). None of the Evi1+/+ or Evi1KI/+ mice died during the 1-year observation period (Evi1+/+, n = 19 vs Evi1KI/+, n = 14). The daily activities of the Evi1KI/+ mice were not impaired; they showed no difficulty in feeding or hanging from the wire-netting ceiling of the cages. Between weeks 5 and 7, the Evi1KI/+ male mice had lower body weights than the Evi1+/+ male mice of the same age (Figure 3A). Although the difference was not statistically significant, the mean body weight of Evi1KI/+ male mice was consistently lower than that of Evi1+/+ male mice from week 8 to 15 (Figure 3A). The Evi1KI/+ female mice had lower body weights than the Evi1+/+ female mice that were 5 weeks old (Figure 3A). From 6 to 15 weeks, Evi1KI/+ female mice had almost the same weight as Evi1+/+ female mice (Figure 3A). These results indicate that the knockin allele caused no gross morphological abnormalities or persistent lower weight in male mice aged from 5 to 15 weeks.
Comparison between Evi1KI/+ and Evi1+/+ mice. (A) External morphology of Evi1+/+ and Evi1KI/+ mice. Images of 10-week-old male littermates. Gross appearance, face, left forelimb, and left hindlimb of Evi1KI/+ mice compared with those of Evi1+/+ mice. There are no external morphological abnormalities. (B) Representative embryos in their yolk sacs at E10.5. The Evi1KI/KI embryo has an avascular yolk sac. Bars represent 2.4 mm. (C) Representative Evi1+/+, Evi1KI/+, and Evi1KI/KI littermates at E10.5. The Evi1KI/KI embryo has a flattened head and poor vascularization. Its size is almost the same as the size of Evi1+/+ and Evi1KI/+ mice. Bars represent 1.2 mm.
Comparison between Evi1KI/+ and Evi1+/+ mice. (A) External morphology of Evi1+/+ and Evi1KI/+ mice. Images of 10-week-old male littermates. Gross appearance, face, left forelimb, and left hindlimb of Evi1KI/+ mice compared with those of Evi1+/+ mice. There are no external morphological abnormalities. (B) Representative embryos in their yolk sacs at E10.5. The Evi1KI/KI embryo has an avascular yolk sac. Bars represent 2.4 mm. (C) Representative Evi1+/+, Evi1KI/+, and Evi1KI/KI littermates at E10.5. The Evi1KI/KI embryo has a flattened head and poor vascularization. Its size is almost the same as the size of Evi1+/+ and Evi1KI/+ mice. Bars represent 1.2 mm.
Comparison between Evi1KI/+ and Evi1+/+ mice. (A) Body weight of male and female Evi1+/+ and Evi1KI/+ mice. Values are the mean ± SEM of each group (male Evi1+/+, n = 9; male Evi1KI/+, n = 8; female Evi1+/+, n = 10; and female Evi1KI/+, n = 6). In male mice aged between 5 and 7 weeks, Evi1KI/+ mice had significantly lower body weights than Evi1+/+ mice. In female mice aged 5 weeks, Evi1KI/+ mice had significantly lower body weights than Evi1+/+ mice. (B) The photograph shows the right palm of Evi1+/+ and Evi1KI/+ mice. D3/palm was calculated by dividing D3 length by palm length. D3/palm of Evi1+/+ and Evi1KI/+ age- and sex-matched littermates (Evi1+/+, n = 7; Evi1KI/+, n = 7). There is no significant difference between Evi1+/+ and Evi1KI/+ age- and sex-matched littermates. Threshold significance level, P = .05 (2-tailed Welch t test). Underlined numbers denote the P value. Values are the mean ± SEM of each group. WT, Evi1+/+ mice; KI, Evi1KI/+ mice.
Comparison between Evi1KI/+ and Evi1+/+ mice. (A) Body weight of male and female Evi1+/+ and Evi1KI/+ mice. Values are the mean ± SEM of each group (male Evi1+/+, n = 9; male Evi1KI/+, n = 8; female Evi1+/+, n = 10; and female Evi1KI/+, n = 6). In male mice aged between 5 and 7 weeks, Evi1KI/+ mice had significantly lower body weights than Evi1+/+ mice. In female mice aged 5 weeks, Evi1KI/+ mice had significantly lower body weights than Evi1+/+ mice. (B) The photograph shows the right palm of Evi1+/+ and Evi1KI/+ mice. D3/palm was calculated by dividing D3 length by palm length. D3/palm of Evi1+/+ and Evi1KI/+ age- and sex-matched littermates (Evi1+/+, n = 7; Evi1KI/+, n = 7). There is no significant difference between Evi1+/+ and Evi1KI/+ age- and sex-matched littermates. Threshold significance level, P = .05 (2-tailed Welch t test). Underlined numbers denote the P value. Values are the mean ± SEM of each group. WT, Evi1+/+ mice; KI, Evi1KI/+ mice.
Some patients with RUSAT and mice with Mecom mutation (Junbo mice) have malformation of their digits including brachydactyly.2,4,5,9,22,33 We examined the morphology of the forelimbs and hindlimbs of Evi1KI/+ mice to examine the effect of this variant on limb development. No extra digits or spurs were observed in Evi1KI/+ mice (n = 7; Figure 3B). D3 digit/palm length did not show a statistically significant difference between Evi1KI/+ and Evi1+/+ mice (Figure 3B).
Evi1KI/+ mice exhibit mild ossification delay
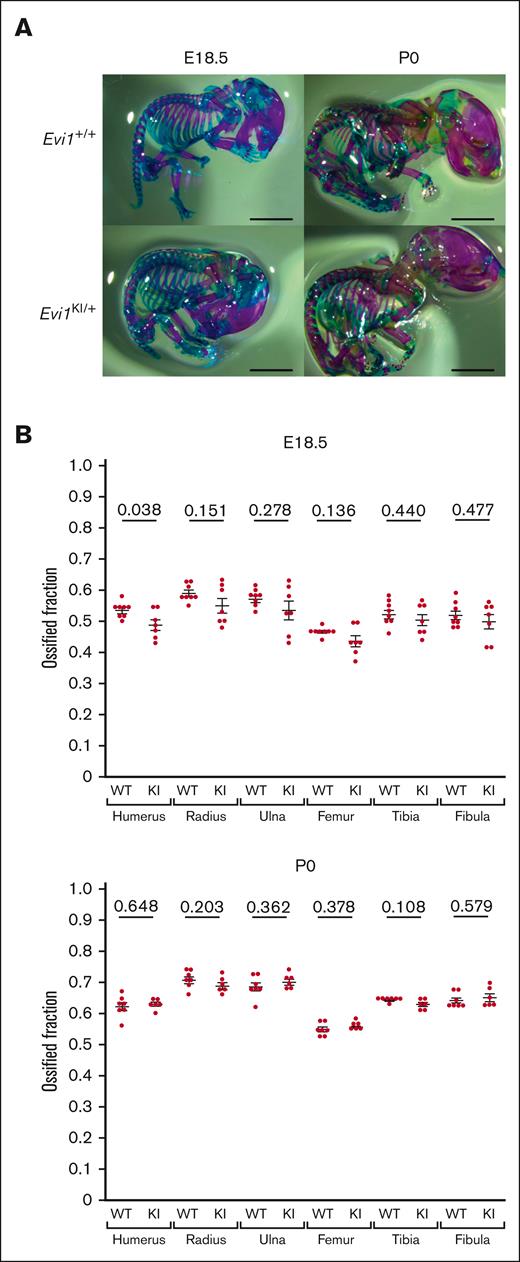
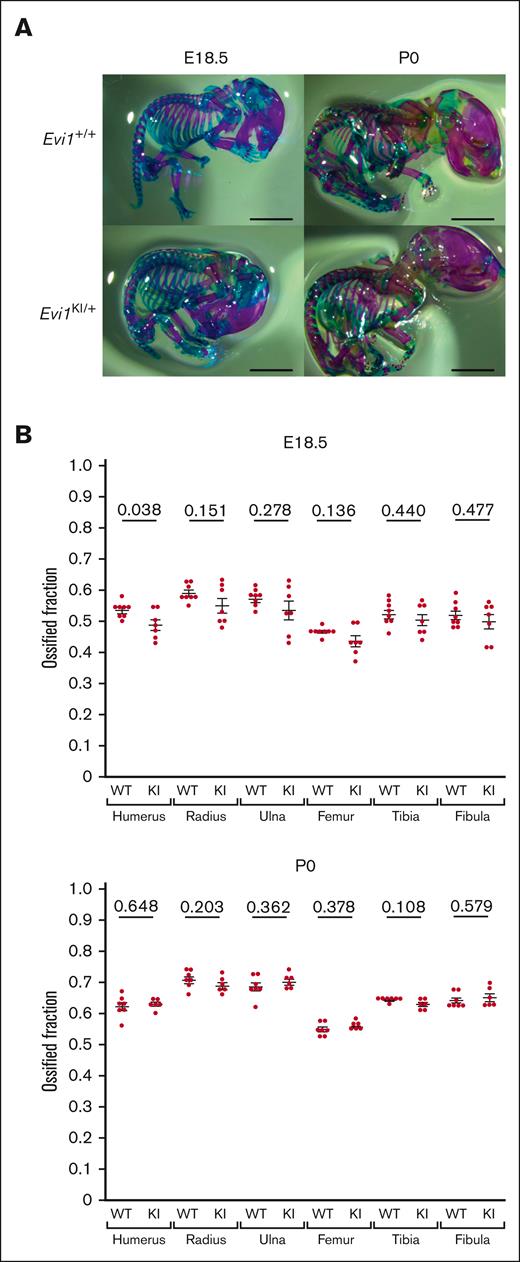
The ossification and morphology of the long bones were assessed using double skeletal staining at E18.5 and P0 (Figure 4A; supplemental Figure 3A).27 All the long bones of the embryos and newborns were morphologically normal. The ossified fraction of the humerus was significantly lower in Evi1KI/+ mice than in Evi1+/+ mice at E18.5 (Figure 4B). Although the difference was not statistically significant, the average ossified fraction of other long bones was lower in Evi1KI/+ mice than that in Evi1+/+ mice at E18.5 (Figure 4B). In contrast, the ossified fraction in the long bones of Evi1KI/+ and Evi1+/+ mice was almost the same as that at P0 (Figure 4B). RUS and skeletal anomalies of the limbs were assessed in 72-week-old Evi1KI/+ (n = 4) and Evi1+/+ mice (n = 4). No apparent deformities of the limbs or proximal radioulnar fusion were observed (supplemental Figure 5). These results suggest that a mild ossification delay occurs in the limb bones of Evi1KI/+ mice at the embryonic stage.
Evi1KI/+ mice show mild ossification delay. (A) Alcian blue and Alizarin red staining of Evi1+/+ mice and Evi1KI/+ mice at E18.5 and P0. Bars represent 5 mm. The ossified fraction was used to evaluate ossification, based on the study by Chang et al.24 (B) Ossification of Evi1+/+ and Evi1KI/+ mice. At E18.5, although only the comparison of the humeral ossification was statistically significant, Evi1KI/+ mice (n = 7) exhibited delayed ossification compared with Evi1+/+ mice (n = 8). At P0, there was no significant difference between the ossification of Evi1+/+ mice (n = 7) and Evi1KI/+ mice (n = 6). Threshold significance level, P = .05 (2-tailed Welch t test). Underlined numbers denote the P value. Values are the mean ± SEM of each group. WT, Evi1+/+ mice; KI, Evi1KI/+ mice.
Evi1KI/+ mice show mild ossification delay. (A) Alcian blue and Alizarin red staining of Evi1+/+ mice and Evi1KI/+ mice at E18.5 and P0. Bars represent 5 mm. The ossified fraction was used to evaluate ossification, based on the study by Chang et al.24 (B) Ossification of Evi1+/+ and Evi1KI/+ mice. At E18.5, although only the comparison of the humeral ossification was statistically significant, Evi1KI/+ mice (n = 7) exhibited delayed ossification compared with Evi1+/+ mice (n = 8). At P0, there was no significant difference between the ossification of Evi1+/+ mice (n = 7) and Evi1KI/+ mice (n = 6). Threshold significance level, P = .05 (2-tailed Welch t test). Underlined numbers denote the P value. Values are the mean ± SEM of each group. WT, Evi1+/+ mice; KI, Evi1KI/+ mice.
Evi1KI/+ mice exhibit low platelet count and reduced HSPC counts
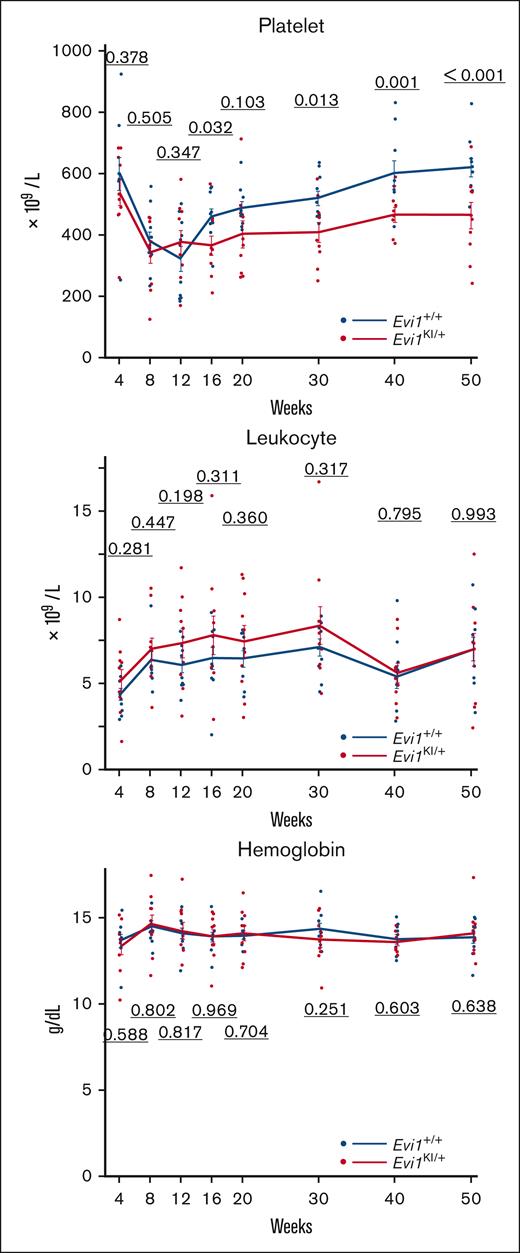
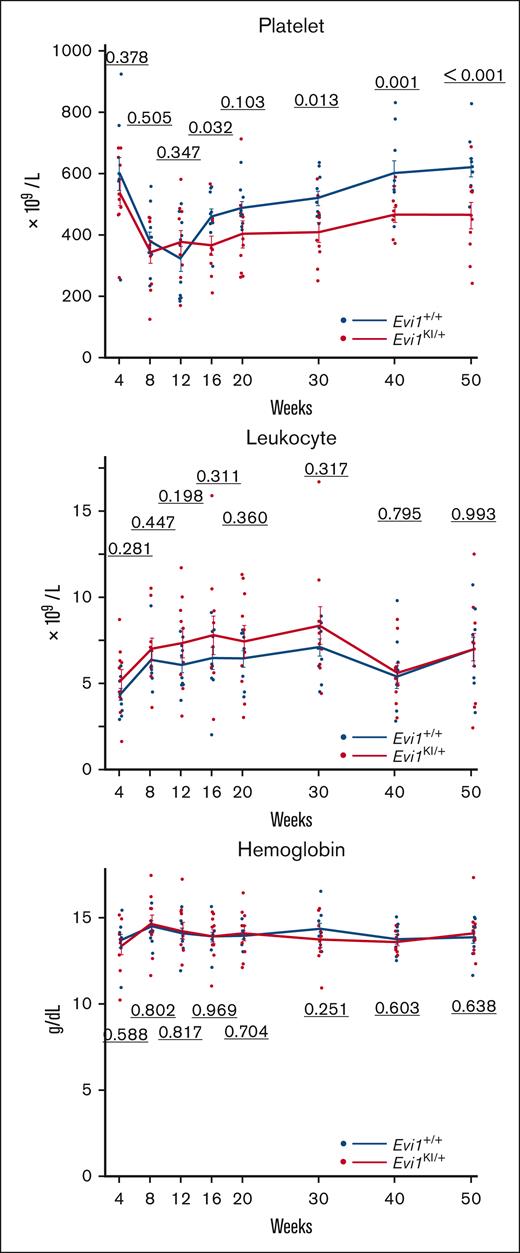
We measured the peripheral blood cell count to evaluate whether Evi1KI/+ mice developed manifestations similar to those observed in RUSAT. The platelet counts of Evi1KI/+ mice were significantly lower than those of Evi1+/+ mice at almost all measurement points from 16 to 50 weeks (Figure 5). Leukocyte counts and hemoglobin levels did not differ significantly between Evi1+/+ and Evi1KI/+ mice aged between 4 and 50 weeks (Figure 5). Polyploid megakaryocytes of Evi1KI/+ mice were reduced compared with those of Evi1+/+ mice aged 13 weeks (supplemental Figure 6). As megakaryocyte maturation progressed, the difference in megakaryocyte number between Evi1+/+ and Evi1KI/+ mice became obvious (supplemental Figure 6). A certain number of megakaryocytes was observed in the bone marrows of Evi1KI/+ mice aged between 10 and 52 weeks (supplemental Figure 7A). Evi1KI/+ mice had megakaryocytes with a normal morphology (supplemental Figure 7A-B).
Evi1KI/+ mice show decreased platelet count with age. (A) Peripheral blood cells of Evi1+/+ and Evi1KI/+ age- and sex-matched littermates (Evi1+/+, n = 10; Evi1KI/+, n = 10). The platelet count of Evi1KI/+ mice was significantly lower than that of Evi1+/+ mice at 16, 30, 40, and 50 weeks of age. Threshold significance level, P = .05 (2-tailed Welch t test). Underlined numbers denote the P value. Values are the mean ± SEM of each group.
Evi1KI/+ mice show decreased platelet count with age. (A) Peripheral blood cells of Evi1+/+ and Evi1KI/+ age- and sex-matched littermates (Evi1+/+, n = 10; Evi1KI/+, n = 10). The platelet count of Evi1KI/+ mice was significantly lower than that of Evi1+/+ mice at 16, 30, 40, and 50 weeks of age. Threshold significance level, P = .05 (2-tailed Welch t test). Underlined numbers denote the P value. Values are the mean ± SEM of each group.
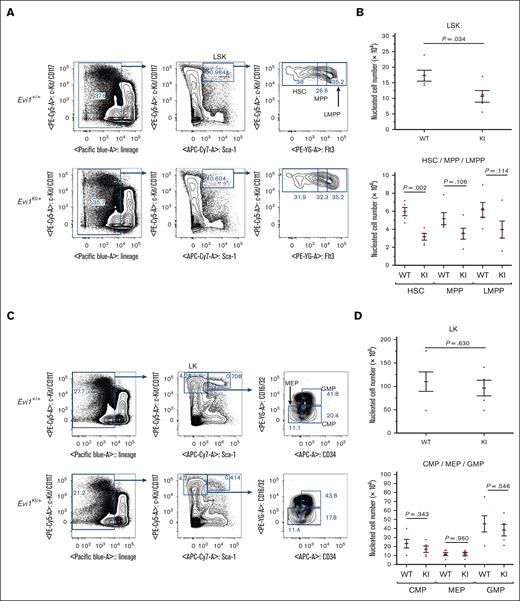
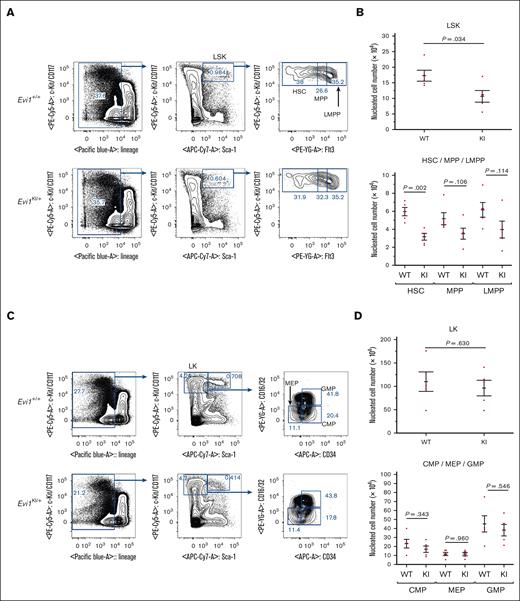
Because RUSAT is characterized by bone marrow failure,4 we assessed bone marrow hematopoiesis via flow cytometric analysis of bone marrow samples from Evi1KI/+ mice. BMCs from Evi1+/+ and Evi1KI/+ age- and sex-matched littermates aged between 8 and 12 weeks were analyzed. No significant difference was observed in the total number of nucleated cells between the Evi1+/+ and Evi1KI/+ mice (supplemental Figure 8). To examine the hematopoietic stem and progenitor cells (HSPCs), the LSK (lineage−, Sca-1+, and c-Kit+) cells were subdivided into HSCs, multipotent progenitors (MPPs), and lymphoid-primed multipotent progenitors (LMPPs). The LSK cell count in Evi1KI/+ mice was found to be significantly lower than that in wild-type mice (1.72 × 10⁵ cells in Evi1+/+ mice vs 1.06 × 10⁵ cells in Evi1KI/+ mice; P = .034 using 2-tailed Welch t test; Figure 6A-B). The cell counts of HSC, MPP, and LMPPs were lower in Evi1KI/+ mice than in Evi1+/+ mice (Figure 6A-B). To examine myeloid progenitor cells, LK (lineage−, Sca-1−, and c-Kit+) cells were subdivided into common myeloid progenitors (CMPs), megakaryocyte-erythrocyte progenitors (MEPs), and granulocyte-monocyte progenitors (GMPs). The numbers of LK, CMP, MEP, and GMP cells in Evi1KI/+ mice were similar to those in wild-type mice (Figure 6C-D). These results suggest that the number of HSPCs was decreased and that the number of myeloid progenitor cells was not altered in Evi1KI/+ mice compared with those in Evi1+/+ mice (supplemental Figure 9).34
Evi1KI/+ mice show impaired HSPCs. (A) Flow cytometric analysis of HSPCs. BMCs were obtained from the bilateral femur and tibia of Evi1+/+ and Evi1KI/+ age- and sex-matched littermates. The LSK compartment of Evi1KI/+ mice was visually reduced compared with that of Evi1+/+ mice. Representative data from 5 experiments are shown. (B) The number of LSK cells and their components. The LSK cell count of Evi1KI/+ mice (n = 5) was significantly lower than that of Evi1+/+ mice (n = 5). (C) Flow cytometric analysis of myeloid progenitor cells. The LK compartment of Evi1KI/+ mice resembled that of Evi1+/+ mice. Representative data from 5 experiments are shown. (D) The number of LK cells and its components. There was no significant difference between the number of LK cells and their components of Evi1KI/+ mice (n = 5) and those of Evi1+/+ mice (n = 5). Threshold significance level, P = .05 (2-tailed Welch t test). Underlined numbers denote the P value. Values are the mean ± SEM of each group. WT, Evi1+/+ mice; KI, Evi1KI/+ mice.
Evi1KI/+ mice show impaired HSPCs. (A) Flow cytometric analysis of HSPCs. BMCs were obtained from the bilateral femur and tibia of Evi1+/+ and Evi1KI/+ age- and sex-matched littermates. The LSK compartment of Evi1KI/+ mice was visually reduced compared with that of Evi1+/+ mice. Representative data from 5 experiments are shown. (B) The number of LSK cells and their components. The LSK cell count of Evi1KI/+ mice (n = 5) was significantly lower than that of Evi1+/+ mice (n = 5). (C) Flow cytometric analysis of myeloid progenitor cells. The LK compartment of Evi1KI/+ mice resembled that of Evi1+/+ mice. Representative data from 5 experiments are shown. (D) The number of LK cells and its components. There was no significant difference between the number of LK cells and their components of Evi1KI/+ mice (n = 5) and those of Evi1+/+ mice (n = 5). Threshold significance level, P = .05 (2-tailed Welch t test). Underlined numbers denote the P value. Values are the mean ± SEM of each group. WT, Evi1+/+ mice; KI, Evi1KI/+ mice.
Evi1KI/+ mice show impaired leukocyte and platelet count recovery from myelosuppression
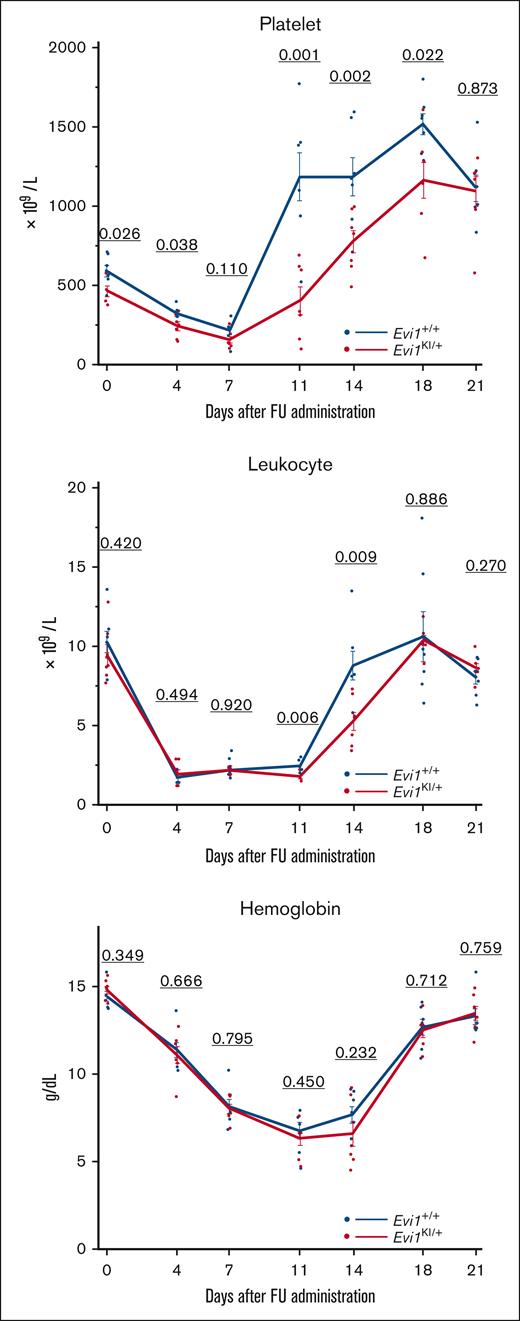
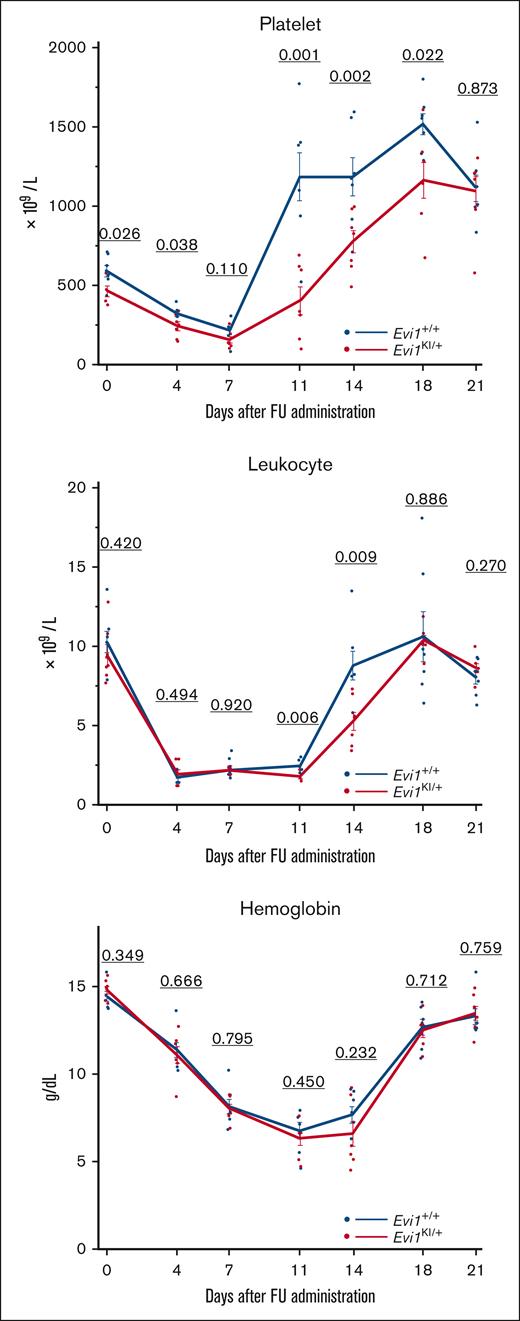
FU kills BMCs and spares long-term HSCs.35 After the BMC count is reduced, FU works in the bone marrow niche to regenerate HSCs.36 To evaluate hematopoietic recovery from myelosuppression, FU was administered to the 8-week-old Evi1+/+ and Evi1KI/+ age- and sex-matched littermates. We tracked the CBC of the mice. The decreasing trend in peripheral blood cells after FU administration was similar between Evi1+/+ and Evi1KI/+ mice (Figure 7). Evi1KI/+ mice showed delayed platelet and leukocyte count recovery compared with Evi1+/+ mice (Figure 7). Although the difference was not significant, hemoglobin recovery in the Evi1KI/+ mice was delayed compared with that in the Evi1+/+ mice (Figure 7).
Evi1KI/+ mice show low platelet count and delayed leukocyte and platelet recovery from FU treatment. The peripheral blood cells of Evi1+/+ and Evi1KI/+ age- and sex-matched littermates after FU administration (Evi1+/+, n = 7 vs Evi1KI/+, n = 7). The platelet and leukocyte count recovery of Evi1KI/+ mice was slow and delayed. Platelet count rebound of Evi1KI/+ mice was milder than that of Evi1+/+ mice. Values are the mean ± SEM of each group. Threshold significance level, P = .05 (2-tailed Welch t test).
Evi1KI/+ mice show low platelet count and delayed leukocyte and platelet recovery from FU treatment. The peripheral blood cells of Evi1+/+ and Evi1KI/+ age- and sex-matched littermates after FU administration (Evi1+/+, n = 7 vs Evi1KI/+, n = 7). The platelet and leukocyte count recovery of Evi1KI/+ mice was slow and delayed. Platelet count rebound of Evi1KI/+ mice was milder than that of Evi1+/+ mice. Values are the mean ± SEM of each group. Threshold significance level, P = .05 (2-tailed Welch t test).
Discussion
In this study, we generated mice with a RUSAT-associated Mecom mutation. Evi1KI/KI mice died at E10.5 to 11.5, and adult Evi1KI/+ mice did not exhibit clear RUS. The ossification of long bones in the Evi1KI/+ mice was delayed at E18.5 but was almost the same at P0, compared with that in Evi1+/+ mice. The platelet and HSPC counts of Evi1KI/+ mice were lower than those of Evi1+/+ mice, whereas the myeloid progenitor cell counts did not differ between Evi1KI/+ and Evi1+/+ mice. Furthermore, Evi1KI/+ mice presented delayed recovery of leukocyte and platelet counts after FU treatment. Although the phenotypic similarity to RUSAT was limited, the hematopoietic defects in these mice support the pathogenicity of the introduced missense variant at the eighth zinc finger motif.
The heterozygous Mecom mutation in Evi1KI/+ mice corresponds to RUSAT-associated mutation in humans. Five Mecom mutant mice were generated (Table 2).37-41 Four of them had deletions of exon 1 of Mds1-Evi1 or exons 3, 4, or 7 of Evi1; abbreviations of these mice are defined in Table 2.37-39,41 Affected translation products of Mecom depend on the deletions (Table 2).37-39,41Junbo mice have a missense mutation in mEVI1 (p.N783I), which is located in the ninth zinc finger motif (Table 2),40 and are a model organism of otitis media. mEVI1 N783I corresponds to hEVI1 N782I, which has not been reported in patients with RUSAT. To the best of our knowledge, this is the first report of genetically authentic mice that expresses a mutation identified in patients with RUSAT.
The LSK cell and HSC counts in Evi1KI/+ mice were lower than those in wild-type mice between 8 and 12 weeks of age. Evi1Δ3/+ or Evi1Δ4/+ mice showed decreased LSK cell count in the fetal liver at E14.5.37,38Evi1Δ4/+ mice showed almost extinct long-term HSCs in their bone marrow.42 EVI1 is involved in HSC maintenance and cellular adhesion to the bone marrow niche via upregulation of ADGRG1 expression.43,44 MDS1-EVI1 plays an important role in long-term HSCs.41Mds1Δ/Δ mice reduce LSK cells and HSCs as seen in Evi1KI/+ mice.41 Therefore, EVI1 and MDS1-EVI1 mutations are assumed to participate in impaired HSC maintenance. Unlike the LSK cell count, the LK cell count of Evi1KI/+ mice was normal. Recent studies have shown that progenitors independent of traditional HSCs drive hematopoiesis in embryos45 and adults.46Evi1+/− mouse embryos exhibited highly decreased HSCs and normal progenitors (CMPs, GMPs, and MEPs),45 resembling our observations. These results indicate that the EVI1 mutation causes a bias in hematopoietic differentiation.
Evi1KI/+ mice showed lower platelet counts at 16 weeks and later in age, although their progenitor MEPs were comparable with those of Evi1+/+ mice between 8 and 12 weeks of age. Although the reason for the differences in counts within the lower-level hierarchy is still unknown, the decreased contribution of HSC-independent hematopoiesis with age46 could explain, at least in part, the age dependency of the lower platelet counts after 12 weeks of age. When focusing on the differentiation stage between MEPs and platelets, Evi1KI/+ mice showed reduced counts of mature polyploid megakaryocytes at 13 weeks of age. Although TGF-β is obviously not the only factor responsible for the complex process in megakaryopoiesis and platelet production,47 it is possible that insufficient suppression of TGF-β signaling by mutant EVI1 reduced megakaryocyte polyploidization, based on the knowledge that TGF-β1 suppresses their polyploidization.48 The vast majority of platelet-producing megakaryocytes are ≥16N,49,50 and thus inhibited polyploidization results in lower thrombocyte counts. TGF-β is a well-known regulator of HSC lineage determination, self-renewal, and differentiation in development.51 When TGF-β signaling was blocked at the hematopoietic regeneration phase after FU treatment, recovery from cytopenia was shortened.52 One of the reasons for delayed recovery from FU-induced cytopenia in Evi1KI/+ mice also may be associated with insufficient inhibition of TGF-β signaling.
The Evi1KI/KI mice were embryonic lethal from E10.5 to 11.5, an earlier stage than that of Evi1Δ4/Δ4 mice (whose protein isoforms of MECOM are null) and almost the same as that of Evi1Δ7/Δ7 mice (which have null mEVI1, normal mEVI1 Δ324, and null mMDS1-EVI1) (Table 2).38,39Mds1Δ/Δ mice, which have normal mEVI1, normal mEVI1 Δ324, and null mMDS1-EVI1, were not embryonic lethal (Table 2).41 The number of Evi1Δ3/Δ3 mice, which have truncated mEVI1, truncated mEVI1 Δ324, and null mMDS1-EVI1, were within a typical Mendelian ratio at birth but died within 3 days (Table 2).37 Many homozygous Junbo mice died at E18.5, although their background was not C57BL/6 but C3H/HeN.40 Overall, mEVI1 H752R induced a severe defect during ontogenesis, similar to loss-of-function alleles.
Evi1KI/+ mice exhibited ossification delay at E18.5 with no difference in their ossification levels at P0. Fifteen-week-old Evi1KI/+ mice did not exhibit short digit length in addition to extra digits. Our luciferase assay indicated that mEVI1 H752R had an impaired ability to inhibit TGF-β signaling or response to AP-1 signaling. TGF-β signaling induces the proliferation and differentiation of osteoprogenitor cells into osteoblasts.53 It also inhibits the maturation and calcification of osteoblasts and their transition into osteocytes.53 FOS, a component of the AP-1 heterodimer, is involved in differentiating chondrocytes.54 Although many molecules are associated with bone ossification, modulation of TGF-β and AP-1 signaling by mutant EVI1 may be involved in a mild ossification delay. The limb phenotypic differences between the Evi1KI/+ mice and Junbo mice might be because of strain differences or different functional properties of the variants.
Our results demonstrate the functional significance of a missense Mecom mutation corresponding to a human mutation identified in an individual with RUSAT in vivo. Mice with a RUSAT-associated Mecom mutation may enable us to study and identify new roles for Mecom in hematopoiesis.
Acknowledgments
The authors thank Koichi Onodera and Hisayuki Yokoyama for their helpful comments on hematopoietic differentiation in mice; Jun-ichi Miyazaki for pCAGGS; and Joan Massague and Jeff Wrana for p3TP-lux (Addgene plasmid #11767). The authors also thank Yoko Tateda, Kumi Kato, and Riyo Takahashi for their technical assistance. They thank the Biomedical Research Unit of Tohoku University Hospital and the Biomedical Research Core of Tohoku University Graduate School of Medicine for their technical support.
This study was supported by Grants-in-Aid for Research on Rare and Intractable Diseases (H26-itaku[nan]-ippan-082) (T.N.) from the Ministry of Health, Labour and Welfare of Japan; the Practical Research Project for Rare/Intractable Diseases (15ek0109067h0002, 16ek0109067h0003) (T.N. and Y.A.) from the Japan Agency for Medical Research and Development; the Medical Research grant and the Medical Research Continuous grant (T.N.) from the Takeda Science Foundation; and JSPS KAKENHI grants JP17K10045 and JP20H03637 (T.N.).
Authorship
Contribution: Y.A. and T.N. designed the study; K.N. and A.M. performed the experiments; K.N., T.A., T.N., and Y.A. analyzed and interpreted the experiments; A.M., Y.H., and K.I. analyzed and interpreted the flow cytometry data of LK and LSK analysis; K.N., T.N., and Y.A. wrote the manuscript; and all authors have read and approved the final manuscript.
Conflict-of-interest disclosure: The authors declare no competing financial interests.
Correspondence: Tetsuya Niihori, Department of Medical Genetics, Tohoku University Graduate School of Medicine, 1-1 Seiryo-machi, Sendai 980-8574, Japan; e-mail: tniihori@med.tohoku.ac.jp; and Yoko Aoki, Department of Medical Genetics, Tohoku University Graduate School of Medicine, 1-1 Seiryo-machi, Sendai 980-8574, Japan; e-mail: aokiy@med.tohoku.ac.jp.
References
Author notes
Data are available on request from the corresponding author, Tetsuya Niihori (tniihori@med.tohoku.ac.jp).
The full-text version of this article contains a data supplement.

