Key Points
Exosc3 expression in the hematopoietic system is essential for mouse embryogenesis.
Exosc3 confers erythroid progenitor survival and activity in vivo by suppressing an apoptotic gene expression program.
Abstract
The RNA-regulatory exosome complex (EC) posttranscriptionally and cotranscriptionally processes and degrades RNAs in a context-dependent manner. Although the EC functions in diverse cell types, its contributions to stem and progenitor cell development are not well understood. Previously, we demonstrated that the transcriptional regulator of erythrocyte development, GATA1, represses EC subunit genes, and the EC maintains erythroid progenitors in vitro. To determine if this mechanism operates in vivo, we used the hematopoietic-specific Vav1-Cre and “conditional by inversion” mouse system to ablate Exosc3, encoding an EC structural subunit. Although Exosc3C/C Cre+ embryos developed normally until embryonic day 14.5, Exosc3 ablation was embryonic lethal and severely reduced erythromyeloid progenitor activity. RNA sequencing analysis of Exosc3-ablated burst-forming unit-erythroid revealed elevated transcripts encoding multiple proapoptotic factors, and the mutant erythroid progenitors exhibited increased apoptosis. We propose that the EC controls an ensemble of apoptosis-regulatory RNAs, thereby promoting erythroid progenitor survival and developmental erythropoiesis in vivo.
Introduction
The evolutionarily conserved RNA-regulatory exosome complex (EC) functions to synthesize, process, and degrade diverse coding and noncoding RNA transcripts. EC components were identified as 3’ to 5’ exoribonucleases required for 5.8 Svedberg units (S) ribosomal RNA (rRNA) processing in yeast.1,2 Loss-of-function studies revealed an EC role in processing diverse RNAs and regulating important biological processes.3-6 In mammalian cells, the EC interacts with other RNA-processing components to target coding and noncoding transcripts in a context-specific manner.7,8 Although EC molecular attributes have been rigorously analyzed, it is unclear how it controls biological processes in cells and tissues of complex organisms.
The extensive transcriptomic remodeling required for stem and progenitor cell differentiation involves transcriptional and posttranscriptional mechanisms. For erythropoiesis, in which hematopoietic stem cells (HSCs) generate committed progenitors, GATA19,10 regulates a large gene cohort required for erythroid maturation and erythrocyte function.11-15 GATA1 represses genes encoding EC subunits at an early stage of erythroblast maturation in mouse and human cells.6,16,17 Downregulating the structural subunits, Exosc8 and Exosc9, using short hairpin RNAs disrupts EC integrity in primary erythroid precursors and depletes the burst-forming unit-erythroid (BFU-E) progenitor.16,17 In immature erythroblasts, the EC promotes c-kit receptor tyrosine kinase expression (KIT) and suppresses expression of the erythropoietin (Epo) receptor that mediates prodifferentiation signaling.16,17 Downregulation of the EC catalytic subunit, DIS3, using short hairpin RNAs in primary erythroid precursors triggers apoptosis, which correlates with reduced Kit expression and elevated DNA damage.6
We developed a hematopoietic-specific in vivo knockout strategy to ablate Exosc3, encoding a structural component with conserved S1 and K homology RNA-binding domains.18 Based on 2 pairs of lox sites in introns 1 and 3,4 Vav1-regulated Cre disrupted Exosc3 in hematopoietic cells, which impaired fetal hematopoiesis and erythromyeloid progenitor activity. Exosc3-deficient progenitors failed to form BFU-Es, expressed reduced cell-surface KIT levels, and were apoptotic. Exosc3 ablation upregulated transcripts encoding BCL-2 family proapoptotic factors, Fas death receptor, and p53 pathway components. Thus, EC function is vital for erythroid progenitors before GATA1-mediated erythroid differentiation in vivo.
Methods
Mice
Exosc3-floxed mice were described previously.4 Vav1-Cre mice were provided by Jing Zhang (University of Wisconsin-Madison). Mouse experiments were performed with the ethical approval of Association for the Assessment and Accreditation of Laboratory Animal Care International at University of Wisconsin-Madison.
Colony-forming unit assays
For fetal liver colony–forming unit assays, embryonic day 14.5 (E14.5) fetal liver cells were dissociated and plated in duplicate in methylcellulose (MethoCult M3434, StemCell Technologies) at the indicated concentrations. Colony-forming unit-erythroid (CFU-E) were scored on day 3, and colony-forming unit–granulocyte macrophage (CFU-GM) and BFU-E were scored on day 8. Megakaryocyte erythrocyte progenitor (MEP)–derived colonies were scored on day 5.
Locus disruption analysis
Sorted green fluorescent protein+ (GFP+) and GFP− erythroid progenitors (CD71low-intermediate Ter119−) (30 000-50 000) were sorted and processed as described in supplemental Methods. Real-time polymerase chain reaction (PCR) was conducted with SYBR Green master mix using a Viia7 instrument (Applied Biosystems) and primers flanking the loxP site. Relative values were calculated from a standard curve of serial dilutions of genomic DNA (gDNA) samples and normalized to the Polr2a promoter.
Gene expression analysis
Total RNA was purified from cells using TRIzol (Invitrogen). Complementary DNA was synthesized by Moloney murine leukemia virus reverse transcription (Thermo Fisher Scientific). Real-time PCR was conducted with SYBR Green master mix (Thermo Fisher Scientific). Control reactions lacking Moloney murine leukemia virus reverse transcription yielded little to no signal. Relative expression was calculated from a standard curve of complementary DNA serial dilutions, and values were normalized to 18S RNA expression. Primer sequences are shown in supplemental Table 3.
Flow cytometry
Sample preparation details are provided in supplemental Methods. Data were acquired on an Attune NxT Flow Cytometer (Thermo Fisher Scientific) or collected on a BD FACSAria II Cell Sorter (BD Biosciences). The data were analyzed using FlowJo version 10.1 software (TreeStar). 4′,6-diamidino-2-phenylindole (DAPI) (422801, BioLegend) was used for live/dead discrimination in all assays.
Apoptosis analysis
Lineage-depleted progenitors were stained with Lin+, CD71, CD24, and KIT. Cells were stained with DRAQ7 and Annexin V pacific blue (ThermoFisher Scientific, A35122) and analyzed on an Attune NxT Flow Cytometer.
Statistics
For quantitative analysis of cell numbers, DNA, messenger RNA (mRNA), and flow cytometric data, when comparing >2 experimental groups, significance was assessed using Tukey multiple comparisons test. When comparing 2 experimental conditions, significance was assessed using 2-tailed unpaired Student t test, unless otherwise indicated. P < .05 was considered significant. GraphPad Prism 6 (GraphPad Software) was used for data analysis and graph generation.
RNA-seq
E14.5 fetal livers (n = 6, 2 from each of 3 litters) were processed, and GFP+ and GFP− Lin−KIT+CD24/7110%low BFU-Es were sorted as described in supplemental Methods. Cells were analyzed for CFU assay (2600 cells per mL), and RNA was used for RNA sequencing (RNA-seq). RNA libraries were prepared using the SMARTer Stranded Total RNA-Seq Kit version 2 (Takara) Pico Library Prep with random hexamers for the reverse transcription reaction. RNA-seq data were generated with an NovaSeq 6000 System sequencer (Illumina) as 151 base pair paired-end reads. Sample processing and analysis details are presented in the supplemental Data.
Results
Expression of EC subunit Exosc3 in the hematopoietic system is required for embryogenesis
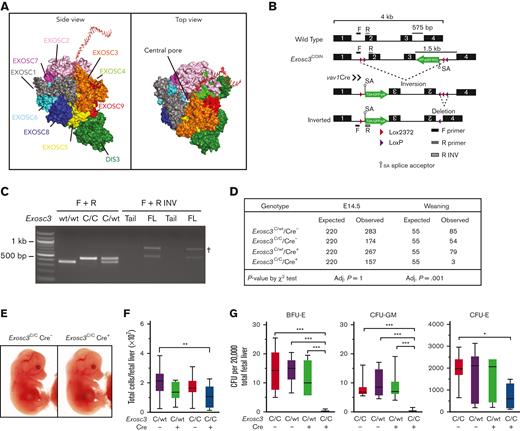
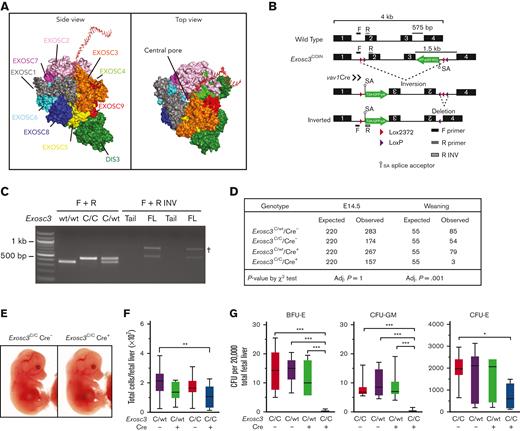
Because GATA1 represses EC subunit genes and in vitro studies implicated EC in erythroid progenitor survival and differentiation,16,17 we generated a hematopoietic-specific knock out of Exosc3 to test whether these results can be extrapolated to erythroblasts in an in vivo microenvironment. Exosc3 associates with Exosc1 and Exosc2 to form an RNA-binding cap to the EC barrel structure, which directs transcripts through the central pore for processing/degradation (Figure 1A). Mice containing a COIN Exosc3 allele were crossed to Vav1-Cre mice to ablate Exosc3 in hematopoietic cells.4 Cre-mediated recombination of lox sites within introns 1 and 3 promotes inversion between the lox2372 sequences and deletion between the loxP sites, thus, corrupting the Exosc3 open reading frame (Figure 1B). The inversion induces Exosc3 promoter–dependent GFP expression as a metric of locus disruption. PCR analysis was used to distinguish the WT allele and the COIN noninverted allele and to detect the COIN-inverted alleles, which were specific to hematopoietic tissue (Figure 1C). The Vav1 promoter is activated at approximately E9.5-E10.5 when HSCs emerge in the aorta-gonad-mesonephros region of the mouse embryo and is active in all hematopoietic lineages.20-24
Exosc3 expression in the hematopoietic system is required for hematopoietic progenitor activity and embryogenesis. (A) Crystal structure and model of the human EC bound by a synthetic 16 base pair RNA molecule.19 (B) Exosc3 conditional ablation strategy with Cre recombinase expression controlled by the hematopoietic promoter Vav1. Cre recognizes the loxP and lox2372 sites within Exosc3 and promotes inversion, followed by deletion. A GFP cassette is activated after inversion and serves as a recombination marker. Forward (F) and reverse (R) primer sets were used to distinguish wild-type (WT) from conditional by inversion (COIN = C) allele. F and R-inverted (R INV) primer set was used to detect the inverted C allele in hematopoietic tissue. Primer alignment is depicted as black and gray boxes. (C) PCR-based genotyping of WT (expected size of 300 base pair) and Exosc3 COIN allele (expected size of 400 base pair) and amplification of inverted allele (expected size of 500 base pair) specific to hematopoietic tissue. gDNA was obtained from tail clip of Exosc3WT/WT Cre−, Exosc3C/C, and Exosc3C/WT mice for the first 3 lanes. gDNA was obtained from tail clip and fetal liver (FL) of Exosc3C/C Cre+ embryos (2 biological reps) for the 4 lanes below F + R INV. Tail gDNA was used as a negative control for the F + R INV PCR reaction. (D) Embryo genotypes at the indicated developmental stages. The χ-square P values refer to Exosc3C/C Cre+ in comparison with control Exosc3C/C Cre−. (E) Representative E14.5 Exosc3C/C Cre− and Exosc3C/C Cre+ embryos. (F) Fetal liver cell enumeration (13 independent experiments: Exosc3C/C Cre− = 14, Exosc3C/WT Cre− = 33, Exosc3C/WT Cre+ = 28, and Exosc3C/C Cre+ = 14). (G) E14.5 fetal liver cells were plated in a CFU media at 20 000 cells per mL (5 independent experiments: Exosc3C/wt Cre− = 13, Exosc3C/wt Cre+ = 7, Exosc3C/C Cre− = 10 and Exosc3C/C Cre+ = 10). Quantitative data are presented as box and whisker plots, with bounds from the 25th to 75th percentiles, the median line, and whiskers ranging from minimum to maximum values. ∗P < .05, ∗∗P < .01, and ∗∗∗P < .001, by Tukey multiple comparisons test. † indicates nonspecific band; adj, adjusted.
Exosc3 expression in the hematopoietic system is required for hematopoietic progenitor activity and embryogenesis. (A) Crystal structure and model of the human EC bound by a synthetic 16 base pair RNA molecule.19 (B) Exosc3 conditional ablation strategy with Cre recombinase expression controlled by the hematopoietic promoter Vav1. Cre recognizes the loxP and lox2372 sites within Exosc3 and promotes inversion, followed by deletion. A GFP cassette is activated after inversion and serves as a recombination marker. Forward (F) and reverse (R) primer sets were used to distinguish wild-type (WT) from conditional by inversion (COIN = C) allele. F and R-inverted (R INV) primer set was used to detect the inverted C allele in hematopoietic tissue. Primer alignment is depicted as black and gray boxes. (C) PCR-based genotyping of WT (expected size of 300 base pair) and Exosc3 COIN allele (expected size of 400 base pair) and amplification of inverted allele (expected size of 500 base pair) specific to hematopoietic tissue. gDNA was obtained from tail clip of Exosc3WT/WT Cre−, Exosc3C/C, and Exosc3C/WT mice for the first 3 lanes. gDNA was obtained from tail clip and fetal liver (FL) of Exosc3C/C Cre+ embryos (2 biological reps) for the 4 lanes below F + R INV. Tail gDNA was used as a negative control for the F + R INV PCR reaction. (D) Embryo genotypes at the indicated developmental stages. The χ-square P values refer to Exosc3C/C Cre+ in comparison with control Exosc3C/C Cre−. (E) Representative E14.5 Exosc3C/C Cre− and Exosc3C/C Cre+ embryos. (F) Fetal liver cell enumeration (13 independent experiments: Exosc3C/C Cre− = 14, Exosc3C/WT Cre− = 33, Exosc3C/WT Cre+ = 28, and Exosc3C/C Cre+ = 14). (G) E14.5 fetal liver cells were plated in a CFU media at 20 000 cells per mL (5 independent experiments: Exosc3C/wt Cre− = 13, Exosc3C/wt Cre+ = 7, Exosc3C/C Cre− = 10 and Exosc3C/C Cre+ = 10). Quantitative data are presented as box and whisker plots, with bounds from the 25th to 75th percentiles, the median line, and whiskers ranging from minimum to maximum values. ∗P < .05, ∗∗P < .01, and ∗∗∗P < .001, by Tukey multiple comparisons test. † indicates nonspecific band; adj, adjusted.
The intercross between Exosc3C/C Cre− and Exosc3C/WT Cre+ mice yielded only 3 Exosc3C/C Cre+ animals at weaning of 221 total (1.3%), far below the expected Mendelian ratio (25%), indicating that Exosc3 expression in the hematopoietic system is required for embryogenesis (Figure 1D). The 3 Exosc3C/C Cre+ mice had normal blood count and did not show defective hematopoiesis in the steady state (data not shown). Analyses at E12.5 and E14.5 revealed that Exosc3C/C Cre+ embryos lacked obvious developmental abnormalities and signs of anemia or hemorrhage. Fetal liver cell numbers were slightly decreased in Exosc3C/C Cre+ embryos in comparison with Exosc3C/WT Cre− embryos (P = .002) (Figure 1E-F; supplemental Figure 1A-B). To test if Exosc3 ablation in the hematopoietic system affects hematopoietic progenitor activity, E14.5 fetal liver cells (20 000/mL) were analyzed in a CFU assay. Exosc3C/C Cre+ cells generated reduced BFU-E (mean ± standard error of the mean [SEM], 0.25 ± 0.13 vs 14.45 ± 2.23; P < .0001) and CFU-GM (mean ± SEM, 0.25 ± 0.15 vs 7.9 ± 1.0; P < .0001) in comparison with Exosc3C/C Cre− cells. CFU-Es were reduced significantly with Exosc3C/C Cre+ cells in comparison with Exosc3C/C Cre− cells (mean ± SEM, 713.5 ± 189.4 vs 1960 ± 202.7; P = .01) (Figure 1G). Thus, Exosc3 expression in the hematopoietic system is required for erythroid and myeloid progenitor activity during fetal development.
To validate the Exosc3 ablation, primers were designed to target a region flanking the loxP sites, which is corrupted by Cre recombinase–mediated inversion (supplemental Figure 1C). GFP+ erythroid cells (CD71+Ter119−) were fluorescence-activated cell sorting–sorted for gDNA and RNA isolation. Exosc3C/C Cre+ CD71+Ter119− GFP+ precursors showed a loss of 72% (P < .0001) of loxP site relative to control Exosc3C/C Cre− cells at E12.5 (supplemental Figure 1D). The locus disruption in the GFP+ population reduces Exosc3 mRNA by 60% and 50% at E12.5 and E14.5, respectively (P = .0012 and P = .0327, respectively) (supplemental Figure 1E-F). Sorted GFP− erythroid precursors from Exosc3C/C Cre+ were analyzed as a control and had levels of unrecombined allele and Exosc3 mRNA comparable to Exosc3C/C Cre− cells.
The loss of BFU-E colonies might result from BFU-E cell depletion or defective progenitor activity. To test these possibilities, we used flow cytometry with erythroid cell–surface markers, CD71 and Ter119, to determine if Exosc3 ablation affected immunophenotypic erythroid progenitors and to define the maturation stage of live DAPI− erythroblasts in E14.5 fetal liver (Figure 2A). In Exosc3C/C Cre+ fetal liver, 2% of live cells expressed GFP, whereas in Exosc3C/WT/Cre+ fetal liver, 20% of live cells expressed the inversion reporter (Figure 2B). Within the progenitor-enriched R1 subpopulation, 43% and 19% of cells expressed GFP in Exosc3C/WT Cre+ and Exosc3C/C Cre+ conditions, respectively (Figure 2C). Erythroid maturation (R1-R5) was assessed with CD71 and Ter119 (Figure 2D). The R1 subpopulation and precursors decreased 40%, from 2.5% to 1.5% (P = .0003), whereas early and late basophilic erythroblasts enriched in R3 increased 3.6%, from 84% to 87% (P = .0285), with Exosc3C/C Cre+ in comparison with Exosc3C/C Cre− conditions (Figure 2E). Polychromatic and orthochromatic erythroblasts and reticulocytes enriched in R4 and R5, respectively, were comparable to control. Thus, although Exosc3 ablation abrogated progenitor activity, immunophenotypic progenitors could still be detected at decreased levels.
Exosc3 expression in the hematopoietic system confers erythroid progenitor activity in an erythroid cell–intrinsic manner. (A) Exosc3 ablation did not affect cellular viability, assessed by DAPI staining. (B) GFP+ percentage of live fetal liver cells. Significance by Tukey multiple comparisons test. (C) GFP+ percentage from live R1 cells parent gate. Significance by Tukey multiple comparisons test. (D) Representative flow cytometric plots depicting erythroid maturation based on CD71 and Ter119 expression in Exosc3C/C Cre− and Exosc3C/C Cre+ E14.5 embryos (13 independent experiments: Exosc3C/C Cre− = 21 and Exosc3C/C Cre+ = 17). (E) Quantification of R1 to R4 populations from E14.5 fetal livers. (F) Experimental scheme for assessing CFU activity of Exosc3C/C Cre− and Exosc3C/C Cre+ of sorted GFP+ R1 + R2 from E12.5 or E14.5 fetal livers. Colonies were quantified after 3 days (CFU-E) or 8 days (BFU-E and CFU-GM) in methylcellulose. (G) CFU activity of Exosc3C/C Cre− and Exosc3C/C Cre+ 3000 sorted GFP+ R1 + R2 cells from E12.5 fetal livers (7 independent experiments: Exosc3C/C Cre− = 7 and Exosc3C/C Cre+ = 6). (H) CFU activity of Exosc3C/C Cre− and Exosc3C/C Cre+ with 5000 sorted GFP+ R1 + R2 from E14.5 fetal livers (7 independent experiments: Exosc3C/C Cre− = 9 and Exosc3C/C Cre+ = 6). Quantitative data are presented as box and whisker plots, with bounds from the 25th to 75th percentiles, the median line, and whiskers ranging from minimum to maximum values. ∗P < .05, ∗∗P < .01, and ∗∗∗P < .001, by unpaired t test. APC, allophycocyanin.
Exosc3 expression in the hematopoietic system confers erythroid progenitor activity in an erythroid cell–intrinsic manner. (A) Exosc3 ablation did not affect cellular viability, assessed by DAPI staining. (B) GFP+ percentage of live fetal liver cells. Significance by Tukey multiple comparisons test. (C) GFP+ percentage from live R1 cells parent gate. Significance by Tukey multiple comparisons test. (D) Representative flow cytometric plots depicting erythroid maturation based on CD71 and Ter119 expression in Exosc3C/C Cre− and Exosc3C/C Cre+ E14.5 embryos (13 independent experiments: Exosc3C/C Cre− = 21 and Exosc3C/C Cre+ = 17). (E) Quantification of R1 to R4 populations from E14.5 fetal livers. (F) Experimental scheme for assessing CFU activity of Exosc3C/C Cre− and Exosc3C/C Cre+ of sorted GFP+ R1 + R2 from E12.5 or E14.5 fetal livers. Colonies were quantified after 3 days (CFU-E) or 8 days (BFU-E and CFU-GM) in methylcellulose. (G) CFU activity of Exosc3C/C Cre− and Exosc3C/C Cre+ 3000 sorted GFP+ R1 + R2 cells from E12.5 fetal livers (7 independent experiments: Exosc3C/C Cre− = 7 and Exosc3C/C Cre+ = 6). (H) CFU activity of Exosc3C/C Cre− and Exosc3C/C Cre+ with 5000 sorted GFP+ R1 + R2 from E14.5 fetal livers (7 independent experiments: Exosc3C/C Cre− = 9 and Exosc3C/C Cre+ = 6). Quantitative data are presented as box and whisker plots, with bounds from the 25th to 75th percentiles, the median line, and whiskers ranging from minimum to maximum values. ∗P < .05, ∗∗P < .01, and ∗∗∗P < .001, by unpaired t test. APC, allophycocyanin.
Cell-intrinsic Exosc3 requirement in erythroid progenitor cells
To rigorously establish if the Exosc3 requirement for erythroid progenitor activity reflects an erythroid cell–intrinsic mechanism, GFP+ CD71+Ter119− erythroid cells (R1 + R2) from E12.5 and E14.5 embryos were isolated by flow cytometry and plated in methylcellulose (3000/mL and 5000/mL, respectively) (Figure 2F). Exosc3 ablation reduced BFU-E and CFU-E. At E12.5, BFU-E decreased 84% from 17.6 ± 2.0 to 2.91 ± 0.7 (P < .0001), and CFU-Es decreased 85%, from 550 ± 65.3 to 84 ± 15.7 (P = .0001) (Figure 2G). At E14.5, BFU-E decreased 92%, from 8.7 ± 1.2 to 0.17 ± 0.1 (P < .0001), and CFU-E decreased 79%, from 435 ± 55.3 to 91.5 ±11.3 (P = .0003) (Figure 2H). As expected, the sorted erythroid CD71+ progenitors did not yield nonerythroid CFU-GM colonies. These results indicate that Exosc3-ablated erythroid progenitors have a cell-intrinsic defect in erythroid colony generation, consistent with a model in which the EC is essential for erythroid progenitor activity before GATA1 repression during erythroid differentiation.
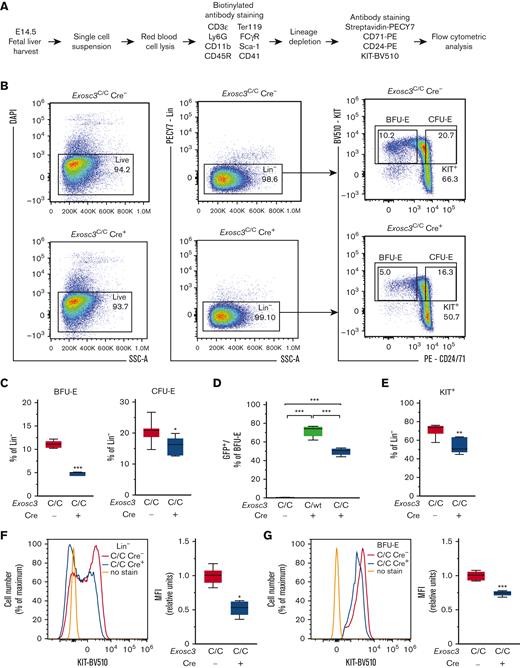
As Exosc3 expression is required for BFU-E activity, and its loss modestly decreased an erythroid progenitor–enriched immunophenotypic population, we used a more refined flow cytometric assay to detect BFU-E.25 BFU-E were defined as the subset (10%) of KIT+ cells of lineage-depleted progenitors with the lowest expression of the early erythroid antigens CD24 and CD71, including CD24−/CD71− cells. CFU-E were defined as the subset (20%) of KIT+ cells with the highest CD24 and CD71 expression. Lineage-depleted (Lin−) fetal liver hematopoietic progenitors were stained for KIT, CD24, and CD71 and analyzed by flow cytometry (Figure 3A-B). Exosc3C/C Cre+ fetal livers had 57.3% fewer Lin−KIT+CD24/7110%low BFU-E (4.7%) in comparison with control Exosc3C/C Cre− fetal liver (11%) (P < .0001). CFU-E were reduced by 24% in Exosc3C/C Cre+ (15.6%) fetal liver in comparison with Exosc3C/C Cre− fetal liver (20.5%) (P = .02) (Figure 3C). With E14.5 fetal livers, 71% and 49% of BFU-E were GFP+ with Exosc3C/WT Cre+ and Exosc3C/C Cre+ genotypes, respectively. GFP+ progenitors were undetectable with control Exosc3C/C Cre− fetal liver (Figure 3D).
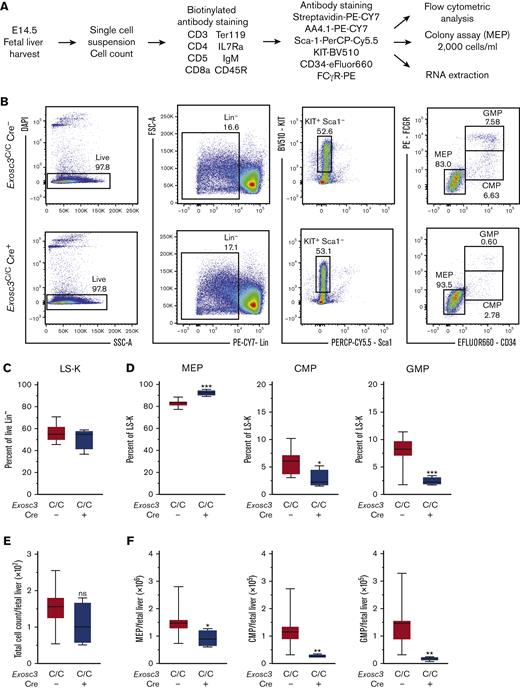
Exosc3 ablation reduces immunophenotypic BFU-E and KIT cell-surface surface expression. (A) Experimental strategy. (B) Representative flow plots depicting erythroid maturation based on KIT, CD71, and CD24 expression to discriminate BFU-E (Lin−KIT+CD24/7110%low) and CFU-E (Lin−KIT+CD24/7120%high) populations in Exosc3C/C Cre− and Exosc3C/C Cre+ E14.5 embryos. (C) Quantification of Lin−KIT+CD24/7110%low BFU-E and Lin−KIT+CD24/7120%high CFU-E (3 independent experiments: Exosc3C/C Cre− = 8 and Exosc3C/C Cre+ = 5). (D) GFP percentage in BFU-E gate for Exosc3C/C Cre−, Exosc3C/WT Cre+, and Exosc3C/C Cre+ conditions. Significance by Tukey multiple comparisons test. (E) KIT+ cells within Lin− progenitor population. (F) KIT cell-surface expression within Lin− progenitors. (G) KIT cell-surface expression in Lin−KIT+CD24/7110%low BFU-E population. Quantitative data are presented as box and whisker plots, with bounds from the 25th to 75th percentiles, the median line, and whiskers ranging from minimum to maximum values. ∗P < .05, ∗∗P < .01, and ∗∗∗P < .001, by unpaired t test.
Exosc3 ablation reduces immunophenotypic BFU-E and KIT cell-surface surface expression. (A) Experimental strategy. (B) Representative flow plots depicting erythroid maturation based on KIT, CD71, and CD24 expression to discriminate BFU-E (Lin−KIT+CD24/7110%low) and CFU-E (Lin−KIT+CD24/7120%high) populations in Exosc3C/C Cre− and Exosc3C/C Cre+ E14.5 embryos. (C) Quantification of Lin−KIT+CD24/7110%low BFU-E and Lin−KIT+CD24/7120%high CFU-E (3 independent experiments: Exosc3C/C Cre− = 8 and Exosc3C/C Cre+ = 5). (D) GFP percentage in BFU-E gate for Exosc3C/C Cre−, Exosc3C/WT Cre+, and Exosc3C/C Cre+ conditions. Significance by Tukey multiple comparisons test. (E) KIT+ cells within Lin− progenitor population. (F) KIT cell-surface expression within Lin− progenitors. (G) KIT cell-surface expression in Lin−KIT+CD24/7110%low BFU-E population. Quantitative data are presented as box and whisker plots, with bounds from the 25th to 75th percentiles, the median line, and whiskers ranging from minimum to maximum values. ∗P < .05, ∗∗P < .01, and ∗∗∗P < .001, by unpaired t test.
Because the EC regulates KIT transcription and signaling in erythroid progenitors in vitro, we asked if this axis operates in vivo. Exosc3C/C Cre+ embryos had 29% fewer KIT+ Lin− progenitors (70.9% and 54.3% with Exosc3C/C Cre− and Exosc3C/C Cre+ fetal livers, respectively (P = .002) (Figure 3E). In principle, this could reflect a decreased percentage of KIT-expressing cells, or fewer KIT molecules on the surface of KIT+ cells, or both. In the Lin− population, the KIT mean fluorescence intensity (MFI) was 48% lower in Exosc3C/C Cre+ in comparison with Exosc3C/C Cre− cells, reflected by loss of KIT-expressing cells and reduced intensity of fluorescence within the KIT+ population (P = .01) (Figure 3F). In KIT+ BFU-Es, the KIT MFI was 26% lower with Exosc3C/C Cre+ in comparison with Exosc3C/C Cre− (P < .0001) (Figure 3G). Because the EC processes 5.8S rRNA intermediate precursors,1 we quantified these transcripts with sorted BFU-E. Primers were designed against the junction regions between ITS1 (internal transcribed spacer 1), 5.8S, and ITS2, and values were normalized to 18S, which had comparable expression between Exosc3C/C Cre+ and Exosc3C/C Cre− samples. In Exosc3C/C Cre+ BFU-E, 5.8S-ITS2 transcripts increased 40% (from 1.21 to 1.48, P = .01), whereas ITS1-5.8S transcripts were unaffected (P = .51) (supplemental Figure 2A). Thus, Exosc3 ablation during fetal development compromises immunophenotypic BFU-E, restricts KIT cell–surface expression, and elevates rRNA precursors in progenitors in vivo.
The committed erythroid BFU-E progenitor is derived from bipotent MEP, defined as Lin−Sca1−KIT+FcγR−CD34−.26-29 Because Exosc3 ablation reduces immunophenotypic BFU-E and abrogates functional BFU-E, we asked if MEP levels and/or function were compromised. Within the Lin− population, we quantified MEP, Lin−Sca1−KIT+FcγR−CD34+ common myeloid progenitor (CMP), and Lin−Sca1−KIT+FcγR+CD34+ granulocyte macrophage progenitor (GMP). E14.5 fetal livers were harvested, and MEPs were sorted from mutant and control embryos for RNA and CFU analyses (Figure 4A). In Exosc3C/C Cre+ fetal liver, immunophenotypic MEPs increased in proportion relative to CMP and GMP, which were significantly reduced in comparison with control Exosc3C/C Cre− fetal liver (Figure 4B). Although there was neither genotype-dependent difference in the Lin−Sca1−KIT+ (55.6 ± 1.78 vs 51.3 ± 5, P = .3) nor in the Lin−Sca1+KIT+ (LSK) populations (1.9 ± 0.4 vs 2.0 ± 1.1, P = .8) (Figure 4C; supplemental Figure 2B), MEPs increased by 10%, from 83% to 92% in comparison with control Exosc3C/C Cre− fetal liver (P < .0001). CMPs and GMPs decreased twofold and threefold, respectively (P = .01 and P = .0005, respectively) (Figure 4D). Although the absolute number of fetal liver cells was unaltered (Figure 4E), the MEP cell number decreased by 1.6-fold (P = .02) in Exosc3C/C Cre+ fetal liver, indicating that the increased percentage reflects the CMP and GMP loss in the Lin−Sca1−KIT+ population, which decreased fourfold (P = .005) and sevenfold (P = .002), respectively, in absolute cell number in the Exosc3C/C Cre+ fetal liver (Figure 4F). Despite the presence of immunophenotypic MEPs in Exosc3C/C Cre+ fetal livers, these progenitors exhibited reduced CFU activity. MEP-derived colonies decreased by 66% from 403 ± 34 with Exosc3C/C Cre− to 138 ± 12 with Exosc3C/C Cre+ fetal liver (P = .002) (Figure 4G). Exosc3 mRNA decreased by 40% in GFP+Exosc3C/C Cre+–sorted MEPs (P = .003) (Figure 4H). Cell-surface KIT expression was 20% lower in Exosc3C/C Cre+ MEPs (P < .0001) (Figure 4I). Although Exosc3 depletion affected progenitors upstream of BFU-E, the magnitude of alterations was less than that for erythroid-committed progenitors, which were exceptionally sensitive to Exosc3 ablation.
Exosc3 ensures early erythroid progenitor survival in vivo
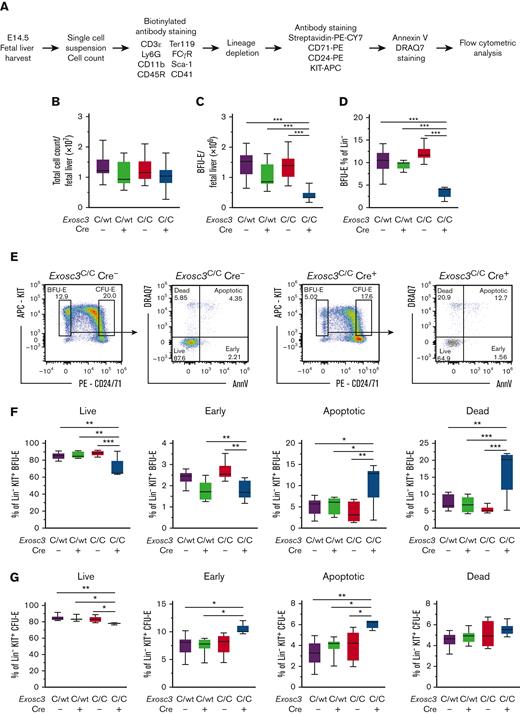
We asked if Exosc3 ablation in vivo affects erythroid progenitor viability. Erythroid progenitors were isolated, stained with annexin V and DRAQ7, and analyzed by flow cytometry (Figure 5A). With E14.5 fetal liver and comparable total cell counts (Figure 5B), the absolute number of Lin−KIT+CD24/7110%low BFU-E decreased significantly from 1.3 × 10⁶ to 0.4 × 10⁶ with Exosc3C/C Cre− and Exosc3C/C Cre+ conditions, respectively (P < .0001) (Figure 5C). As a percentage of Lin− progenitors, Lin−KIT+CD24/7110%low BFU-E decreased 61% from 11% to 4.3% with Exosc3C/C Cre− and Exosc3C/C Cre+ conditions, respectively, (P < .0001) (Figure 5D).
Exosc3 ablation compromises erythroid progenitor survival. (A) Experimental strategy. (B) Fetal liver live cell counts. Dead cells were excluded by trypan blue. (C) KIT+ BFU-E cell counts per E14.5 fetal liver. (D) BFU-E as percentage of lineage-depleted precursors (4 independent experiments: n = 33). (E) Representative flow cytometric plots for control Exosc3C/C Cre− and Exosc3C/C Cre+. (F) Percentage of BFU-E in live (AnnV−DRAQ7−), early apoptotic (AnnV+DRAQ7−), late apoptotic (AnnV+DRAQ7+), and dead (AnnV−DRAQ7+) cells, based on annexin V and DRAQ7 staining. Quantitative data are presented as box and whisker plots, with bounds from the 25th to 75th percentiles, the median line, and whiskers ranging from minimum to maximum values. ∗P < .05, ∗∗P < .01, and ∗∗∗P < .001, by Tukey multiple comparisons test. (G) Percentage of CFU-E in live, early apoptotic, late apoptotic, and dead cells (3 independent experiments: Exosc3C/C Cre− = 6, Exosc3C/WT Cre− =6, Exosc3C/WT Cre+ = 6, and Exosc3C/C Cre+ = 6).
Exosc3 ablation compromises erythroid progenitor survival. (A) Experimental strategy. (B) Fetal liver live cell counts. Dead cells were excluded by trypan blue. (C) KIT+ BFU-E cell counts per E14.5 fetal liver. (D) BFU-E as percentage of lineage-depleted precursors (4 independent experiments: n = 33). (E) Representative flow cytometric plots for control Exosc3C/C Cre− and Exosc3C/C Cre+. (F) Percentage of BFU-E in live (AnnV−DRAQ7−), early apoptotic (AnnV+DRAQ7−), late apoptotic (AnnV+DRAQ7+), and dead (AnnV−DRAQ7+) cells, based on annexin V and DRAQ7 staining. Quantitative data are presented as box and whisker plots, with bounds from the 25th to 75th percentiles, the median line, and whiskers ranging from minimum to maximum values. ∗P < .05, ∗∗P < .01, and ∗∗∗P < .001, by Tukey multiple comparisons test. (G) Percentage of CFU-E in live, early apoptotic, late apoptotic, and dead cells (3 independent experiments: Exosc3C/C Cre− = 6, Exosc3C/WT Cre− =6, Exosc3C/WT Cre+ = 6, and Exosc3C/C Cre+ = 6).
Within the BFU-E population, apoptotic cells (AnnV+DRAQ7+) increased threefold from 3.7 ± 1.0 to 11 ± 1.9 with Exosc3C/C Cre− and Exosc3C/C Cre+ conditions, respectively (P = .003). Dead cells (AnnV−DRAQ7+) increased by 3.1-fold from 5.4 ± 0.4 to 17 ± 2.7 with Exosc3C/C Cre− and Exosc3C/C Cre+ conditions, respectively, (P = .0002) (Figure 5E-F). Live cells (AnnV−DRAQ7−) decreased by 20% from 88 ± 1.3 to 70 ± 4.4 (P = .0006) and early apoptotic cells (AnnV+DRAQ7−) decreased by 33% from 2.7 ± 0.1 to 1.8 ± 0.1 (P = .009) (Figure 5F). With CFU-E, there was a 6.1% decrease in live cells from 83 ± 1.5 to 78 ± 0.3 (P = .03) and 1.5-fold increase in apoptotic cells (4.0 ± 0.5-6.1 ± 0.1 with Exosc3C/C Cre− and Exosc3C/C Cre+, respectively, P = .01), with no change in early apoptotic or dead cells, in comparison with the Exosc3C/C Cre− condition (Figure 5G). Thus, the EC is a determinant of erythroid progenitor survival in vivo, with BFU-E exhibiting the greatest sensitivity to Exosc3 ablation.
To elucidate the mechanism by which the EC confers erythroid progenitor survival, RNA-seq was conducted to ask how Exosc3 ablation affects the BFU-E transcriptome. GFP+ Lin−KIT+CD24/7110%low BFU-E and GFP− Lin−KIT+CD24/7110%low BFU-E were sorted from Exosc3C/CCre+ embryos and Exosc3C/C Cre− embryos, respectively, for CFU and RNA-seq analyses (Figure 6A-B; supplemental Figure 2C). DAPI staining was used to assess cell viability, and DAPI− cells were sorted for subsequent analyses (Figure 6C). Immunophenotypic BFU-E were twofold lower in the Lin− population (Figure 6D). Sorted BFU-E were also analyzed in the CFU assay, and Exosc3-ablated progenitors did not form colonies (Figure 6E).
The RNA-seq analysis quantified 48 893 annotated genes, and 11 422 genes had, within at least 1 genotype group, mean FPKM >1 and nonzero abundance in all samples of that group (Figure 6F). Among these genes, 530 were differentially expressed genes with an adjusted P < .05 with Exosc3C/C Cre+ BFU-E in comparison with control Exosc3C/C Cre− BFU-E. A total of 276 and 254 of the differentially expressed genes were downregulated and upregulated, respectively (Figure 6G). GFP transcripts were only detected in Exosc3C/C Cre+ samples, and all replicates had comparable gene expression distribution and average number of reads, and biological replicates were segregated by principal component analysis (supplemental Figure 2D-G)
GO analysis of downregulated genes yielded 110 categories, including basic cellular processes and immune response (not shown). Because transcript upregulation is likely to be a direct consequence of reduced EC activity, we further analyzed the upregulated transcripts. The GO analysis for upregulated genes revealed a restricted cohort of categories (Figure 6H), including components of the p53-mediated apoptosis pathway, which increased significantly in Exosc3-ablated BFU-Es. The p53 target genes Mdm2, Trp53inp1, Cdkn1a, and Phlda3 were upregulated significantly in Exosc3C/C Cre+ BFU-Es. We mined transcriptome and proteome data, which revealed Trp53inp1, Mdm2, and Cdkn1a transcripts to be GATA1-induced in the G1E-ER-GATA1 genetic complementation system.15,30 The quantitative proteomic analysis, which sampled a subset of cellular proteins, identified Trp53inp1 as being GATA1-induced (4.9-fold) (supplemental Figure 3A-B). GATA2 upregulated Mdm2 and Pmaip1 and decreased Mybbp1a transcripts in GATA2-deficient myeloid progenitors lacking the Gata2-77 enhancer28,31 (supplemental Figure 3C).
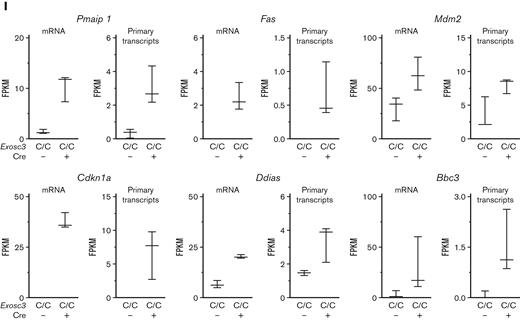
We deployed a prioritization strategy based on fold change, transcript abundance, whether the gene was expressed in the erythroid lineage, and whether the gene was known to regulate cell survival/death. This analysis yielded 14 genes that were subjected to validation by qRT-PCR. Exosc3 mRNA was 50% lower in GFP+ BFU-E from Exosc3C/CCre+ fetal livers. Comparison of GFP+ BFU-E from Exosc3C/CCre+ fetal livers and GFP− BFU-E from Exosc3C/CCre− fetal livers revealed that the levels of diverse transcripts important for erythroid biology, such as, Kit, Epor, Gata1, and globin genes, were unaltered (supplemental Table 1; supplemental Figures 3D and 4B). Exosc3 ablation increased accumulation of Bax, Bbc3/Puma, and Pmaip1/Noxa transcripts, encoding members of the BCL-2 protein family of proapoptotic factors that function in the intrinsic apoptosis pathway. Bax transcripts increased 2.3-fold (P = .0001), Bbc3 increased fivefold (P < .0001), and Pmaip1 increased fourfold (P = .003), with Exosc3C/C Cre+ in comparison with Exosc3C/C Cre− BFU-E (supplemental Figure 4A-B). In addition to upregulation of intrinsic apoptotic pathway components, Exosc3 ablation increased Fas (Tnfrsf6, tumor necrosis factor receptor superfamily 6) transcripts, which encode the death receptor Fas. Fas mRNA increased 23-fold, whereas FasL, encoding its ligand, was undetectable in the analysis (supplemental Figure 4A). The integral membrane proteins Fas and FasL are members of the tumor necrosis factor receptor superfamily. The transcriptomic landscape of Exosc3-ablated BFU-E, isolated by flow cytometry to ensure cell viability, revealed the upregulation of multiple cohorts of proapoptotic genes. Quantitative analysis of mRNA and primary transcripts from the RNA-seq data revealed that Exosc3 ablation elevated mRNAs and primary transcripts (Figure 6I; supplemental Figure 5), consistent with a model in which the EC suppresses a proapoptotic transcriptional program in erythroid progenitor cells.
Discussion
Because the EC regulates diverse RNA species, one would predict that it is broadly important in all cell types. The hematopoietic system, in which stem and progenitor cells are generated and function at distinct anatomical sites during embryogenesis, constitutes an attractive model to address whether the EC is critical in all or a circumscribed cohort of cell types. An important component of hematopoiesis requires population of the fetal liver with aorta-gonad-mesonephros–generated HSCs.32 The fetal liver also harbors abundant progenitors generated from erythrocyte macrophage progenitors (EMPs) that arise in the yolk sac.33-35 Given our in vitro studies demonstrating that EC disruption is deleterious to erythroid progenitors,6,16,17 we used a Vav1-Cre system to evaluate EC function in the hematopoietic system in vivo, with an emphasis on erythrocyte development. Vav1-Cre–mediated Exosc3 ablation reduced, but did not eliminate, Exosc3 expression from hematopoietic progenitors owing to monoallelic recombination and/or cells resistant to ablation. Despite this reduced Exosc3 expression, Exosc3-ablated E12.5 and 14.5 embryos were morphologically normal, with a small reduction in fetal liver cellularity. However, the fetal livers were devoid of functional erythroid progenitors, and embryonic lethality occurred after E14.5.
Exosc3-ablated fetal liver contained large numbers of GFP− progenitors harboring a WT locus and normal Exosc3 mRNA levels, consistent with a lack of Vav1-Cre action in these cells and their precursors. Although Vav1-Cre is used commonly to generate hematopoietic-specific knockouts,20,22,23,36 whether Vav1 is invariably inactive or active in yolk sac–derived progenitors in different systems is unresolved. GATA1 represses Exosc3 transcription,6,17 and once GFP is expressed from a recombined locus, the locus is predicted to retain GATA1 responsiveness. GATA1 repression of the recombined locus will generate cells lacking GFP transcripts, and some dividing cells might become GFP−. However, structural analysis revealed recombination exclusively with sorted GFP+, but not GFP−, erythroid progenitors. GFP− progenitors expressed Exosc3 mRNA at levels comparable to control progenitors. GFP− cells may arise from yolk sac–derived progenitors that do not express Vav1, for example, EMPs that generate erythroid and myeloid cells to sustain embryogenesis or the selective expansion of residual WT cells. Assessing EC function in EMPs will require alternative strategies, and critical EC functions in other sectors of the hematopoietic system cannot be ruled out, as transplantation analyses are required. It will be instructive to use other conditional knockout systems to analyze lineage-specific EC functions during adult hematopoiesis. Our results demonstrate a hematopoietic cell–intrinsic requirement of an essential EC subunit for erythroid progenitor activity.
The nearly complete lack of erythroid progenitor activity was not accompanied by a quantitative depletion of immunophenotypic erythroid progenitors. Exosc3 ablation decreased immunophenotypic BFU-E by ∼50%. As the erythroid progenitor CFU assay involves an 8-day culture and Exosc3 ablation elevates transcripts encoding proapoptotic factors, progenitor viability may decrease as a function of time after progenitor culture. As immunophenotypic erythroid progenitors were not quantitatively eliminated, Exosc3 ablation did not eliminate the capacity of MEPs to generate BFU-E or at least functionally defective cells with BFU-E attributes.
Transcripts encoding proapoptotic factors, including intrinsic apoptotic pathway components Bbc3, Bax, and Pmaip1, were upregulated in Exosc3-ablated BFU-E. The BCL-2 family contains the BH3 (BCL-2 homology 3)–only members (Bbc3, Bad, Bid, Bik, Bim, Noxa, Bmf, and Hrk), prosurvival factors (Bcl2, Mcl-1, Bcl2l1, Bcl2l2, and Bcl2a1), and proapoptotic factors (Bax, Bak, and Bok)37 (supplemental Table 2). Conditional BCL-XL ablation induces anemia due to a BCL-XL requirement in reticulocytes. Loss of the BH3-only domain factors, BIM and PUMA, does not rescue the phenotype, indicating that these proapoptotic factors do not mediate apoptosis without BCL-XL during adult erythropoiesis.38 PUMA and NOXA function during embryonic erythropoiesis have not been fully characterized. The antiapoptotic protein MCL-1 confers erythroid progenitor survival before BCL-XL expression at later stages. BAX is highly expressed in a population enriched for proerythroblasts (CD71+ Ter119−) and early basophilic erythroblasts (CD71+ Ter119low).39 Although Mcl1 and Bcl2l1 (encoding BCL-XL) transcripts detected by our RNA-seq analysis were not significantly different between Exosc3C/C Cre+ and Exosc3C/C Cre− conditions, qRT-PCR analysis revealed a 1.3-fold increase (P = .004) in Bcl2l1 transcripts. Primary transcripts and mRNA encoding the death receptor, FAS, were also detected at increased levels in mutant embryos. In splenic stress erythropoiesis, the interaction between Fas and FasL regulates apoptosis, which is suppressed by prosurvival EPO signaling.40 During fetal liver development, Fas and FasL negatively regulate erythroid progenitor expansion, limiting mature cell generation.41 Mechanistically, primary transcript upregulation suggests an EC-suppressed transcriptional mechanism, as the EC directly and indirectly controls genome function3,42,43 or EC-dependent destruction of primary transcripts.44
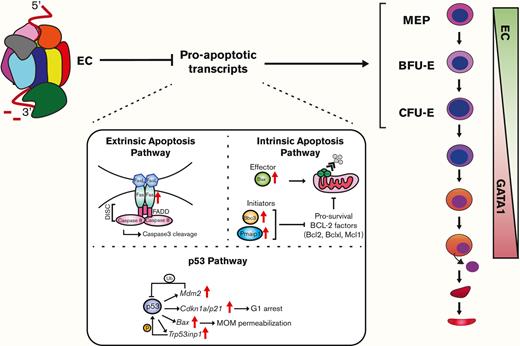
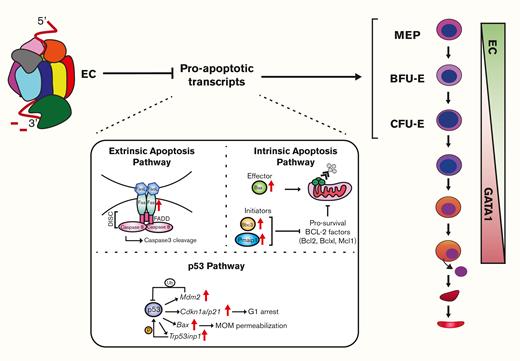
Considering that Exosc3 confers erythroid progenitor function, survival, and suppresses apoptosis-regulatory transcripts, we propose that the EC limits the levels of proapoptotic factors in erythroid progenitors (Figure 7), and once GATA1 represses EC genes, distinct mechanisms are deployed to balance pro- and antiapoptotic factors. Further studies are required to establish if EC directly controls the levels of apoptotic transcripts, as EC subunit downregulation disrupts RNA processing and induces DNA damage and apoptosis.5,6 The GATA1/EC axis confers maximal stem cell factor signaling in erythroid progenitors ex vivo,17 and stem cell factor signaling supports survival and proliferation.45 Kit and Epor transcript levels were unaltered in Exosc3-ablated erythroid progenitors, which might reflect the partial loss of Exosc3 and/or subunit-specific requirements for the control of cellular signaling. It will be instructive to consider whether this EC-apoptosis link can be extrapolated to other sectors of the hematopoietic system and nonhematopoietic contexts in which the EC may also exert vital functions in stem and/or progenitor cells. Analogous to the GATA1-regulated network of genes and proteins that inform mechanisms of erythropoiesis and, more broadly, cellular differentiation, the EC-dependent transcriptome established herein, which supports progenitor cells, will almost certainly unveil new paradigms.
EC confers erythroid progenitor survival and function in vivo.Vav1-Cre–mediated Exosc3 ablation in the hematopoietic system is embryonically lethal after E14.5. Exosc3 expression is required for erythroid and myeloid progenitor activity. In Exosc3-ablated embryos, immunophenotypic BFU-Es are reduced, and progenitor activity is abrogated. MEPs can still be detected but have reduced activity. RNA-seq analysis of sorted GFP+ BFU-E revealed accumulation of proapoptotic genes, and Exosc3-ablated progenitors became apoptotic. During erythroid maturation, GATA1 represses genes encoding EC subunits.6,16,17 Before repression, the EC establishes and/or maintains functional erythroid progenitors, which involves conferring KIT expression/signaling, protection against DNA damage,6 and suppressing, directly or indirectly, a proapoptotic program.
EC confers erythroid progenitor survival and function in vivo.Vav1-Cre–mediated Exosc3 ablation in the hematopoietic system is embryonically lethal after E14.5. Exosc3 expression is required for erythroid and myeloid progenitor activity. In Exosc3-ablated embryos, immunophenotypic BFU-Es are reduced, and progenitor activity is abrogated. MEPs can still be detected but have reduced activity. RNA-seq analysis of sorted GFP+ BFU-E revealed accumulation of proapoptotic genes, and Exosc3-ablated progenitors became apoptotic. During erythroid maturation, GATA1 represses genes encoding EC subunits.6,16,17 Before repression, the EC establishes and/or maintains functional erythroid progenitors, which involves conferring KIT expression/signaling, protection against DNA damage,6 and suppressing, directly or indirectly, a proapoptotic program.
Acknowledgments
The authors thank the University of Wisconsin Biotechnology Center DNA Sequencing Facility and the Carbone Cancer Center Flow Cytometry Laboratory for providing sequencing and flow cytometry services, respectively.
This work was supported by grants from the National Institute of Diabetes and Digestive and Kidney Diseases (NIHDK50107) (E.H.B.), National Institute of Allergy and Infectious Diseases (NIHAI143897) (U.B.), and Carbone Cancer Center (P30CA014520). I.F.d.A. was supported in part by funding from Coordenação de Aperfeiçoamento de Pessoal de Nível Superior (CAPES), Brazil.
Authorship
Contribution: I.F.d.A. performed experiments and constructed the figures and graphs; I.F.d.A. and K.D.J. analyzed results; C.N.D. conducted RNA sequencing analysis; U.B. provided Exosc3-floxed animals and primers; and I.F.d.A., C.M., and E.H.B. designed the research and wrote the manuscript.
Conflict-of-interest disclosure: The authors declare no competing financial interests.
Correspondence: Emery H. Bresnick, Department of Cell and Regenerative Biology, Carbone Cancer Center, University of Wisconsin School of Medicine and Public Health, 1111 Highland Ave, 4009 WIMR, Madison, WI 53705; e-mail: ehbresni@wisc.edu.
References
Author notes
The sequencing data reported in this article have been deposited in the Gene Expression Omnibus database (accession number GSE203607).
Data are available on request from the corresponding author, Emery H. Bresnick (ehbresni@wisc.edu).
The full-text version of this article contains a data supplement.


