Key Points
This study demonstrates the severity of anemia and relapsing nature of CAD over time, even after administration of multiple therapies.
The majority of CAD patients will at some point in their disease course manifest severe disease necessitating transfusion.
Abstract
Cold agglutinin disease (CAD), a rare disease and subtype of autoimmune hemolytic anemia, is characterized by autoantibodies that bind to red blood cells at low temperatures. There is no established standard of care for CAD treatment and CAD cohort studies are limited by the rarity of the condition. The objectives of this study are to present the longitudinal experience of a CAD cohort from the United States, with a focus on anemia severity, use of medications and transfusions, and health care resource utilization. The Stanford Translational Research Integrated Database Environment database was used to retrospectively identify CAD patients diagnosed and treated at Stanford Health Care from 2000 to 2016. Twenty-nine patients were included in this analysis. There were 7.1 severe anemia events per patient-year observed over the follow-up time. For CAD patients treated at Stanford, there was a mean of 3.5 therapies per patient. Transfusions were given in at least 65% of the cohort with a mean of 11 transfusions per patient-year. For CAD-related health care use in the first year after disease onset, 93% used outpatient services with a median of 26 outpatient visits per patient. The data presented here likely represent the minimum number of events for these patients during this timeframe, as this single-center experience does not capture care from other providers. This longitudinal study of CAD patients demonstrates the severity of anemia and relapsing nature of the disease, even after administration of multiple therapies and transfusions.
Introduction
Autoimmune hemolytic anemia (AIHA) is a group of diseases in which autoantibodies target and destroy red blood cells.1,2 Cold agglutinin disease (CAD) constitutes 13% to 32% of AIHA,3-5 and is distinguished from warm AIHA by a preponderance of immunoglobulin M (IgM) autoantibodies known as cold agglutinins (CAs) that react most strongly between 0°C and 4°C.2,6 CAs are potent activators of the classical complement pathway, leading to C3b deposition on the surface of red blood cells. These complement-coated red blood cells are then phagocytosed in the liver, a process known as extravascular hemolysis, the primary driver of anemia in CAD patients.7-9 CAD is classified as either primary (idiopathic) or secondary, with the primary form believed to be much more common.10 Primary CAD is thought to be caused by a low-grade lymphoproliferative bone marrow disorder characterized by clonal expansion of B cells.11 Secondary CAD is related to an underlying disease, most often non-Hodgkin lymphoma or another malignancy. It can also be secondary to infections or autoimmune diseases.4,11
CAD disease severity can fluctuate throughout the course of a patient’s illness. The thermal amplitude of CAs may be considered the most clinically relevant feature in determining disease severity in patients with CAD. Although CAs can be detected in healthy individuals without pathogenic implications, CAD patients have a higher concentration of CAs than healthy individuals, and the CAs present have a higher thermal amplitude (>30°C).12,13 Disease severity can also be determined by the capacity of the antibody to activate complement and the availability of complement in the serum.13 Additionally, B-lymphocyte clonality is often noted in CAD patients, suggesting CAD may be a symptom of a premalignant or low-grade lymphoproliferative disorder rather than a benign condition as previously thought.14,15
Disease severity fluctuations result in varying CAD symptoms. Although some patients have mild anemia, the median hemoglobin level in the only population-based CAD study is 8.9 g/dL.11 This degree of anemia can be associated with substantial impairment in quality of life. CAD patients experience symptoms including acrocyanosis, fatigue, dyspnea, hemoglobinuria, weakness, and weight loss.16 Agglutinated red blood cells can also result in mild to severe Raynaud events.11
The rarity of CAD has limited the ability to perform large population-based studies, with most knowledge coming from case reports and small case series until very recently. In 2006, the first population-based study in CAD suggested a prevalence of 16.2 cases per million and an incidence rate of 1.0 CAD case per million person-years (Norwegian population).11 The risk of CAD onset increases after age 55 years.5 CAD affects men and women in roughly equal proportions. The slight preponderance in women in some studies is likely due to women living to an older age, where the onset of the disease is more common.11,14,17
Treatment of CAD has traditionally been dependent upon disease severity. Avoiding exposure to cold temperatures is only variably effective in very mild cases.18 Rituximab has not been extensively studied in CAD; however, meta-analyzed data show a response in only 57% of CAD cases, with complete responses observed in only 21% of CAD patients and a slow response time.19 Furthermore, the duration of response with rituximab was reported as only 6.5 months in Schöllkopf et al20 and 11 months in Berentsen et al.17 The most effective CAD treatment reported in the literature is a combination of rituximab and fludarabine, providing 76% response and a median response duration of 66 months.21 However, toxicity was a serious concern,21,22 with 41% (n = 12) of patients having grade 3-4 toxicity.21 Plasmapheresis may be used in an acute hemolytic crisis, but the response is temporary.23,24 Although frequently used in clinical practice, corticosteroids are no longer recommended as treatment for CAD, as response is limited and reported only when very high doses are used.18,22,25
Due to the temporary effectiveness of existing CAD treatments, patients often transition back to more severe anemia and require additional interventions. Transfusions may be used as supportive therapy in patients with severe anemia.16 The extent of CAD subjects utilizing transfusions in study populations ranges from 40% to 100% in the literature (Table 1).11,16,20,26-28
Transfusion use in the Stanford Translational Research Integrated Database Environment (STRIDE) compared with the literature
| Reference . | Received transfusions (%) . | Median follow-up length . |
|---|---|---|
| This study | 19 (65) | 4.9 y (range, 0.1-15.1 y) |
| 11 | 44 (51) | 5.0 y (range, 0.0-21.0 y) |
| 26 | 4 (100) | Not specified |
| 27 | 23 (48) | 5.0 y (0.6-25.0 y) |
| 28 | 12 (80) | 4.2 y (0.3-15.7 y)* |
| 20 | 11 (55) | Transfusions received in the 3 mo before the clinical trial |
| 16 | 36 (40) | Patients identified and followed up between January 1, 1970 and May 25, 2012 |
Both warm AIHA and CAD patients.
Given the limited study of CAD in large populations and the absence of any studies presenting a detailed disease course over time, we performed a retrospective longitudinal analysis of CAD patients seen at Stanford Health Care. The goal of this analysis is to better understand the patient and clinical characteristics of a CAD cohort including changes over time, particularly, their severity of anemia, use of medications and blood transfusions, and their health care resource utilization.
Methods
Study design
We performed a retrospective analysis of CAD patients seen at Stanford Health Care between 1995 and 2016. After approval from the Stanford Institutional Review Board, deidentified patient records were analyzed from STRIDE, which contains clinical and demographic data for 2.1 million adult and pediatric patients seen at Lucile Packard Children’s Hospital or Stanford University Medical Center. STRIDE data from individuals seen within the Stanford system include a large portion of referrals from within California and potentially from out of state. Demographic characteristics were abstracted from patients’ medical records. Hemoglobin at CAD onset was defined as the lowest hemoglobin value during the patients’ first hemolytic crisis, as defined in other studies.29
Study population
Records were limited to patients ≥18 years of age who had at least 1 hemoglobin reading ≤12 g/dL in their medical record. AIHA patients were identified using International Classification of Diseases Ninth Revision (ICD-9) diagnosis code 283.0. This population was narrowed to those having a haptoglobin value <35 mg/dL with a direct antiglobulin test positive for IgG, C3, or both, and/or a diagnosis of AIHA in the patient chart (n = 156). These patients were further classified as having CAD if they had an explicit cold AIHA diagnosis in their chart or a direct antiglobulin test that was IgG− and C3+. Those patients identified as warm or mixed AIHA were excluded. In cases where there were conflicting diagnoses of warm, cold, or mixed AIHA, patients were not included. The STRIDE database did not capture the data required to distinguish primary vs secondary CAD. Thirty-five CAD patients were identified, with data from 2000 to 2016. Twenty-nine patients were included in this longitudinal analysis based on a sufficient number of hemoglobin readings and follow-up time (at least 5 readings; and if <10 readings, then >1-year follow-up time). Six patients were excluded from the longitudinal analysis. The data flow diagram detailing the exclusions can be found in supplemental Figure 1.
Clinical data
Data abstracted included birth year, and several clinical parameters over time including hemoglobin values (2000-2016), units of transfused red blood cells (2008-2016), CAD-related therapies (2008-2016), and thrombotic events (2008-2016). CAD-related therapies were characterized as corticosteroids (betamethasone, budesonide, dexamethasone, steroid, prednisone, prednisolone, methylprednisolone), IV immunoglobulin, rituximab, immunosuppressants (azathioprine, cyclosporine, methotrexate, mycophenolate mofetil, tacrolimus), antineoplastics (bendamustine, cyclophosphamide, daunorubicin liposomal), or biologics (eculizumab, lymphocyte immune globulin antithymocyte globulin). All dates were recorded in terms of patient age. Each 6-month time period of patient follow-up is characterized by the lowest hemoglobin value during that time period and categorized as either “mild” (hemoglobin >10 g/dL), “moderate” (hemoglobin = 8.1-10 g/dL), or “severe” (hemoglobin ≤8 g/dL).
Health care resource utilization
All visits to Stanford facilities were categorized as inpatient, outpatient, or emergency room visits. Prescription information was captured from the patient records. Inpatient visits were further categorized by length of stay. Health care resource utilization (HRU) was categorized as CAD-related or not CAD-related by a hematologist/oncologist. CAD-related visits were categorized based on the clinical department and provider specialties. In particular, visits to oncology, hematology, general internal medicine, family medicine, immunology, infectious disease, and procedures such as laboratory draws and infusions were considered plausibly related to CAD.
Statistics
General descriptive statistics were performed, including frequencies, percentages, medians, means, and standard deviations. Dates and values of hemoglobin, dates of transfusions, dates of medication initiations, and dates of hospitalized visits were also graphically displayed for each CAD patient. For the sake of comparison, mean, median, standard deviation, and range values for hemoglobin values were calculated from published studies.
Results
Twenty-nine CAD patients with longitudinal data were identified in the STRIDE database. The average follow-up time for the 29 CAD patients was 5.6 years (median, 4.9; range, 0.12-15.1). Thirteen (45%) were male and the average age at disease onset was 58.5 years (range, 18.9-74.1). Sixty-two percent (n = 18) of the patients were white, 21% (n = 6) were Asian, and 17% (n = 5) were other races.
Table 2 shows the characteristics of anemia at disease onset or study baseline for this cohort of CAD patients compared with other studies in the literature. Most of the patients (79%) had severe (45%) or moderate (34%) anemia at disease onset. Mean and median hemoglobin were similar (mean, 8.3 g/dL; median, 8.2 g/dL) with a range of 4.7 to 11.6 g/dL.
Characteristics of anemia in CAD patients at study baseline
| Reference . | N . | Severity at baseline, % (N) . | Mean (SD) Hgb, g/dL . | Median Hgb, g/dL . | Range Hgb, g/dL . | ||
|---|---|---|---|---|---|---|---|
| Severe . | Moderate . | Mild . | |||||
| This study* | 29 | 45 (13) | 34 (10) | 21 (6) | 8.3 (1.8) | 8.2 | 4.7-11.6 |
| 29* | 84 | 44 (37) | 32 (27) | 24 (20) | — | — | — |
| 28*,† | 15 | 84 (13) | 8 (1) | 8 (1) | — | 6.0 | — |
| 20 | 20 | 10 (2)‡ | 35 (7)‡ | 55 (11)‡ | 10.1 (1.8)‡ | 10.3 | 7.3-15.3 |
| 38 | 5 | 0 (0) | 60 (3) | 40 (2) | 10.5 (1.8)‡ | 9.8‡ | 8.4-12.5‡ |
| 10 | 14 | 21 (3)‡ | 50 (7)‡ | 29 (4)‡ | 9.3 (2.8)‡ | 9.1 | 4.0-15.0 |
| 40 | 9 | — | — | — | — | 9.4 | 7.1-12.2 |
| 39 | 14 | — | — | — | 9.4 (1.7) | — | — |
| 17 | 27 | — | — | — | 8.5 (NR)‡ | 8.2‡ | 6.2-12.3‡ |
| 11 | 86 | — | — | — | 9.2 (2.3) | 8.9 | 4.5-15.6 |
| 21 | 29 | — | — | — | — | 8.7 | 5.4-15.6 |
| 36 | 2 | — | — | — | — | — | 6.0-14.5 |
| 34 | 18 | — | — | — | — | 8.4 | 4.5-13.5 |
| 27 | 48 | — | — | — | — | 9.3 | 4.0-16.2 |
| 33 | 2 | — | — | — | 5.8 (0.4)‡ | 5.8‡ | 5.5-6.1‡ |
| 30 | 5 | — | — | — | 7.9 (3.0)‡ | 6.9‡ | 4.8-12.7‡ |
| 16 | 89 | — | — | — | — | 10.2 | 6.2-17.7 |
—, no data available; Hgb, hemoglobin; NR, not reported.
Study baseline is at disease onset.
Only percentages presented in the publication. Numbers of patients are calculated.
Calculated from raw data presented in text.
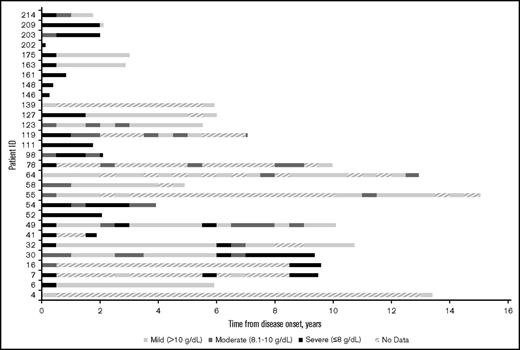
Figure 1 shows hemoglobin measurements during patient follow-up for each patient in the cohort. Each 6-month time period of patient follow-up is characterized by the lowest hemoglobin value measured during that time period and categorized as either mild (hemoglobin >10 g/dL), moderate (hemoglobin = 8.1-10 g/dL), or severe (hemoglobin ≤8 g/dL). The different levels of anemia severity are represented by variations in shading for the time period. If no hemoglobin measurements were taken during a 6-month period, that time period is hashed. Seventy-two percent of the patients had at least 1 severe anemia event within the first year of follow-up. The severity of anemia varied for each patient over time, with many patients remaining severely anemic despite receiving multiple therapies. Overall, there were 7.1 severe anemia events per patient-year (787 events per 110.5 patient-years), 10.8 moderate events per patient-year (1196 events per 110.5 patient-years), and 8.0 mild events per patient-year (888 events per 110.5 patient-years) during the follow-up period.
Severity of anemia among CAD patients in Stanford cohort, in 6-month intervals from disease onset (2000-2016). “No data” indicates that no hemoglobin readings were found in the Stanford patients’ records during the 6-month interval.
Severity of anemia among CAD patients in Stanford cohort, in 6-month intervals from disease onset (2000-2016). “No data” indicates that no hemoglobin readings were found in the Stanford patients’ records during the 6-month interval.
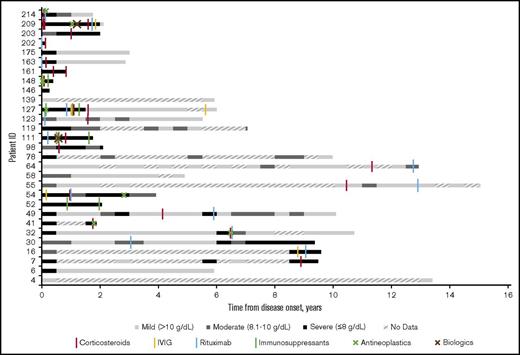
Eight patients had no medications recorded in the STRIDE database and thus either did not receive treatment of CAD at Stanford from 2008 to 2016 or received treatment elsewhere. Of patients receiving treatment (n = 21), the average number of therapies per patient was 3.5 (73 therapies per 21 patients). The majority of patients had 1 (14%), 2 (38%), or 3 (19%) lines of therapy at Stanford, with 2 patients receiving 4 treatment lines and 1 patient each receiving 6, 7, 9, and 12 lines of therapy. Corticosteroids were the most common treatment provided (90%; n = 19). Many patients also received rituximab (67%; n = 14). Less common therapies included IV immunoglobulin (24%; n = 5), immunosuppressants (n = 4; 19%), antineoplastics (n = 7; 33%), and biologics (n = 2; 10%). Figure 2 shows that 67% of patients (12 patients of 18 with at least 6 months of follow-up after their initial therapy) had a severe anemia event in the first 6 months after their initial therapy whereas 50% (6 of 12 with at least 6 months of follow-up after their last therapy) had a severe anemia event after their last therapy.
Severity of anemia in relation to therapy administered at Stanford among CAD patients in Stanford cohort, in 6-month intervals from disease onset (2008-2016). “No data” indicates that no hemoglobin readings were found in the Stanford patients’ records during the 6-month interval.
Severity of anemia in relation to therapy administered at Stanford among CAD patients in Stanford cohort, in 6-month intervals from disease onset (2008-2016). “No data” indicates that no hemoglobin readings were found in the Stanford patients’ records during the 6-month interval.
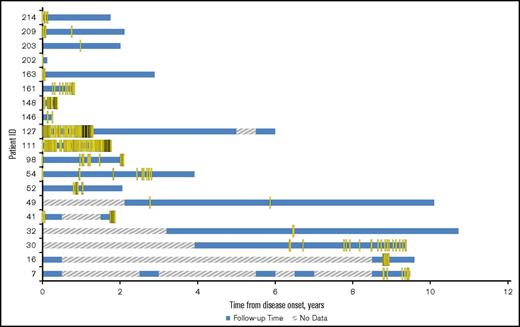
Figure 3 displays the transfusions received by each patient for patients receiving transfusions between 2008 and 2016. At least 65% (19 of 29) of the CAD patients had at least 1 transfusion at Stanford. This is the minimum number of transfusions these patients may have had as transfusions at other institutions would not be captured in our analysis. There was an average of 11.0 transfusions per patient-year of follow-up (median, 4.4; range, 0.14-79). The average number of units of red blood cells per transfusion was 1.5 (standard deviation [SD], 1.3; range, 1-15 units).
Incidence of transfusions at Stanford among CAD patients in Stanford cohort who had transfusions, in 6-month intervals from disease onset (2008-2016). For CAD patients who had a surgery, transfusions within 72 hours after surgery were removed from analysis. “No data” indicates either no transfusion information before 2008 or no transfusion information was found in the Stanford patients’ records during the 6-month interval.
Incidence of transfusions at Stanford among CAD patients in Stanford cohort who had transfusions, in 6-month intervals from disease onset (2008-2016). For CAD patients who had a surgery, transfusions within 72 hours after surgery were removed from analysis. “No data” indicates either no transfusion information before 2008 or no transfusion information was found in the Stanford patients’ records during the 6-month interval.
Five of the 29 CAD patients suffered a thrombotic event which was recorded in STRIDE during their follow-up time in 2008 to 2016. Three patients had a portal vein thrombosis and 2 had an acute venous embolism and thrombosis of deep vessels. Three of 5 patients had multiple severe anemia events and multiple transfusions before the time of their thrombotic event. Patient 52 had 40 severe anemia events and 24 transfusions, patient 98 had 13 severe anemia events and 16 transfusions, and patient 127 had 34 severe anemia events and 74 transfusions before their thrombotic event.
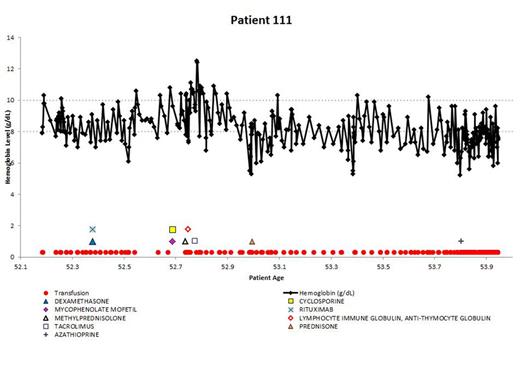
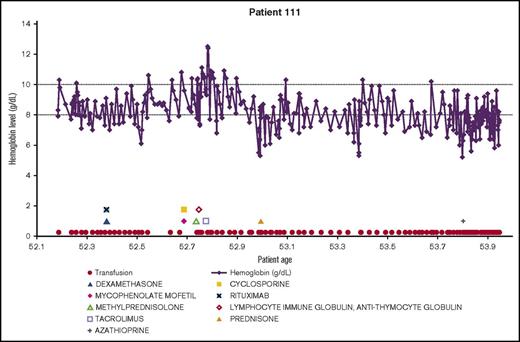
Demonstrating the disease course for 1 of the most severe CAD patients, the experience of patient 111 is shown in Figure 4. All available longitudinal data, including hemoglobin values, transfusions, and medications are presented together. The variable nature of the disease can be seen in this patient, with hemoglobin values repeatedly dropping below 8 g/dL. The administration of medications appears to coincide with low hemoglobin levels, as do the transfusions. This figure emphasizes the relapsing nature of CAD over time, as this patient is severely anemic for almost 2 years, even with administration of therapies and transfusions.
Example patient: clinical and treatment characteristics during follow-up time.
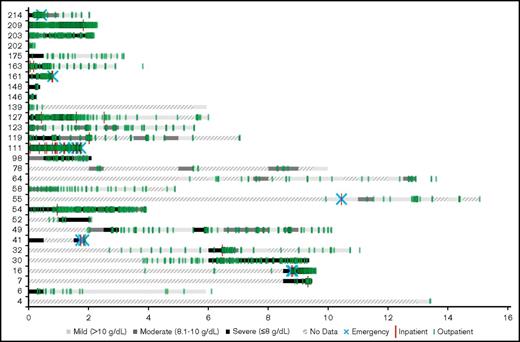
The CAD-related HRU at the Stanford facilities is shown in relationship to anemia severity in Figure 5. Some patients had outpatient visits during periods with no hemoglobin readings (see patients 16, 52, 119), indicating that hemoglobin was not measured at that visit. Inpatient and emergency room visits appeared to coincide with severe anemia events in most. Outpatient visits were clearly the most used health care resource, and are observed through periods of mild, moderate, and severe anemia. HRU was only measured for patient encounters captured in STRIDE. Patients seeking emergency or other care outside of the Stanford Hospital and Clinics would not be captured, so these estimates are minimum usage values.
CAD-related HRU at Stanford among CAD patients in Stanford cohort from disease onset (2008-2016). “No data” indicates periods without hemoglobin data or periods prior to 2008. HRU events that occurred during “No data” periods indicate that no hemoglobin readings were found in the Stanford patients’ records in that 6-month interval.
CAD-related HRU at Stanford among CAD patients in Stanford cohort from disease onset (2008-2016). “No data” indicates periods without hemoglobin data or periods prior to 2008. HRU events that occurred during “No data” periods indicate that no hemoglobin readings were found in the Stanford patients’ records in that 6-month interval.
For patients with disease onset between 2008 and 2016 and at least 1 year of follow-up (n = 15), HRU at the Stanford facilities for the first year of care after CAD onset is described in Table 3. Health care utilization in the year after disease onset is high, with 67% of individuals using inpatient services (10 of 15), 100% using outpatient services (15 of 15), and 53% of individuals using emergency services (8 of 15). For CAD-related health care use in the first year after disease onset, 27% of the cohort used inpatient services, 93% used outpatient services, and 7% presented to the emergency department. The median number of CAD-related outpatient visits in the first year after disease onset for the 14 patients using outpatient services was 26 (range, 6-146), which is slightly lower than the median number of overall (including visits that were not CAD-related) outpatient visits (42; range, 10-167). Although fewer patients used inpatient CAD-related care, the median length of stay for patients was 4.3 days (range, 4-5 days), which was similar to the observed hospital stay for overall (not CAD-related) inpatient care (Table 3). In both CAD-related and overall inpatient care, patients had an average of 3 admissions. Although 100% of the cohort used pharmacy services in the first year after CAD onset, only 60% used CAD-related pharmacy services. The cohort used general medications more frequently than CAD-related mediations, with a mean for overall prescriptions of 27.1 (median 21) and a mean for CAD-related prescriptions of 4.7 (median, 3.0).
HRU by type of service for the first year after CAD onset: overall and related to CAD in 2008-2016
| . | CAD-related . | Total . |
|---|---|---|
| Hospital inpatient | ||
| Percent of cohort using (N) | 26.7 (4) | 66.7 (10) |
| Mean no. of admissions (SD) | 3.0 (3.4) | 2.9 (2.7) |
| Median no. of admissions (range) | 1.5 (1.0-8.0) | 2.0 (1.0-10.0) |
| Mean* length of stay, d (SD) | 4.4 (0.5) | 6.8 (5.4) |
| Median* length of stay (range) | 4.3 (4.0-5.0) | 4.5 (1.0-18.5) |
| Outpatient claims and services | ||
| Percent of cohort using (N) | 93.3 (14) | 100 (15) |
| Mean no. of visits (SD) | 44.9 (43.9) | 58.1 (53.3) |
| Median no. of visits (range) | 26.0 (6.0-146.0) | 42.0 (10.0-167.0) |
| Emergency room visits and services | ||
| Percent of cohort using (N) | 6.7 (1) | 53.3 (8) |
| Mean no. of visits (SD) | 1.0 (0) | 2.0 (1.3) |
| Median no. of visits (range) | 1.0 (1.0-1.0) | 1.5 (1.0-4.0) |
| Pharmacy | ||
| Percent of cohort using (N) | 60.0 (9) | 100 (15) |
| Mean no. of prescriptions (SD) | 4.7 (4.4) | 27.1 (24.0) |
| Median no. of prescription (range) | 3.0 (1.0-14.0) | 21.0 (2.0-76.0) |
The analysis is limited to the patient whose onset is in and after 2008.
Patient must have at least 1 year follow-up.
Mean and median of average length of stay of each patient.
Discussion
The CAD-related literature is largely composed of case reports and small case series, and studies including 3 or more CAD cases are sparse.4,10,11,16,17,20,26-40 To our knowledge, our study is the first to describe individual disease courses over time,11,16,28 capturing both fluctuations in anemia severity and transfusion use. The data demonstrate the volatile nature of the disease, and how mild and moderate anemia patients can become severely anemic and transfusion-dependent. Our study is also the first to characterize HRU in CAD, which is substantial in this population.
Another major strength of this study is the detailed patient experience over substantial follow-up time. The mean duration of follow-up was 5.6 years (0.12-15.1). Only 3 studies had similar median follow-up length, but their outcomes were limited to aggregate measures of survival and treatment response, rather than detailed disease history.11,16,28
In this study, the high proportion of CAD patients with severe anemia in year 1 likely reflects their symptoms driving them to seek care. In the literature, Barcellini et al29 and Prabhu et al28 also found that most of the CAD patients had severe anemia at disease onset, whereas Schöllkopf et al20 and Berentsen et al (in 199710 and 200038 ) showed most patients having moderate or mild anemia at study baseline. Mean hemoglobin was calculated for 8 studies reporting mean hemoglobin values between 5.8 and 10.5 g/dL.10,11,17,20,30,33,38,39 Similarly, median hemoglobin values from 13 studies ranged from 5.8 to 10.3 g/dL.10,11,16,17,20,21,27,28,30,33,34,38,40
This study is also unique in presenting red blood cell transfusions per patient over time in detail. In accordance with the literature, we observed patient need for transfusions fluctuating and seemingly correlating with the occurrence of severe anemia. Transfusion use for patients at Stanford is similar to transfusion use reported in the literature (Table 1). At least 65% of patients received transfusions at Stanford during their follow-up period whereas 3 other studies with similar follow-up times show that 48%,27 51%,11 and 80%26 of patients received transfusions. Studies with unclear follow-up times reported that 40%,16 55%,20 and 100%26 of CAD patients received transfusions. We observed a transfusion rate of 11 transfusions per patient-year, with a median of 15 transfusions per patient (range, 1-197) over a median follow-up of 4.9 years, comparable to the LaMarque study that showed a median of 10.5 transfusions per patient (range, 2-40) over a median 5 years of follow-up.27
There is no established standard-of-care protocol for CAD, resulting in treatment that is varied and lacks consistent response. Several studies have evaluated a single drug in trial form, but follow-up is often short.17,38-40 Over time, patients in our cohort received multiple lines of CAD-directed therapy (average of 3.5). Most (71%) patients had 1 to 3 lines of treatment and 1 patient had 12. Prabhu et al similarly observed that over a median follow-up of 50 months, 80% of patients received 1 to 3 lines of therapy, and 1 patient had 4 lines.28 Despite receiving many courses of treatment, patients often relapse with severe anemia events. In our cohort, 67% of patients had their hemoglobin fall below 8.0 g/dL within 6 months of their initial therapy, and 50% were experiencing severe anemia after their last course of treatment with at least 6 months of follow-up.
Recent literature explicitly states corticosteroid therapy is not recommended for primary CAD treatment given the general lack of response to and the need for high doses throughout the disease course to maintain any response.11,16,28,41,42 This lack of response is corroborated in our cohort. Many patients receiving corticosteroids received additional treatments due to a severe anemia event after corticosteroid therapy.
The most studied drug for CAD is rituximab.43 However, response rates and lasting responses to this treatment are not optimal.19 In our cohort, 48% (n = 14) of patients received rituximab treatment, with 86% (12 of 14) of these patients experiencing severe (50%) or moderate (36%) anemia following treatment. This is consistent with the literature, where rituximab studies show a low response rate and slow time to response.19,21,39 Combination rituximab/fludarabine treatment has shown efficacy with the tradeoff of high toxicity.21 One of the patients described in this study (patient 209) received rituximab/fludarabine combination therapy near the end of their follow-up time, so response could not be determined at this time.
Though the mechanism is not well understood, thromboembolic events are associated with anemia.44 A meta-analysis of several AIHA cohorts observed a significantly increased risk of thrombotic events among AIHA patients45-48 which have been linked to cause of death.49,50 In the CAD literature, thrombotic events were reported in Prabhu et al28 (1 cerebral venous thrombosis event among 12 patients) and Roth et al32 (7 events in 4 patients, including 1 pulmonary embolism), which are comparable to our 5 thrombotic events in 29 patients.
The prognosis of CAD patients depends on the severity of the disease.25 Median overall survival was found to be 12.5 years (range, 1-21 years) from disease onset in Berentsen et al11 and 10.6 years (range, 0-29.9 years) in Swiecicki et al.16 After a median follow-up of 55.5 months in Go et al,34 8 patients (44%) were alive. Causes of death were infrequently reported among the CAD studies. The most commonly reported causes of death were lymphohematopoietic diseases.26,27,31,34,36 Other causes of death included severe anemia complications,34 ischemic stroke,40 and infection.31
In the first year after disease onset, 67% of our cohort used inpatient services at Stanford, 100% used outpatient, and about 50% used emergency services. The median number of CAD-related outpatient visits in the first year after disease onset was 26, representing a significant burden on the patient and the medical system. These data may be underestimating total health care resource use, as we only captured health care use at Stanford facilities beginning in 2008.
In this cohort of US CAD patients, there is a considerable burden of disease, and patients vary widely in their disease course. Seventy-two percent of the patients had at least 1 severe anemia event within the first year of follow-up, and at least 65% warranted transfusion over their disease course. Many patients continued to relapse despite the use of multiple lines of therapy. This suggests the notion that there are mild, moderate, and severe variants that may underestimate the true burden of disease because the majority of patients will at some point in their disease course manifest severe disease necessitating transfusion.
A limitation of our study is that the STRIDE database does not record reasons for loss to follow-up. Some patients with severe anemia at disease onset could not be followed for a year or more. Additionally, given the STRIDE database only captures data from Stanford clinics, we are capturing the minimum levels of care for this cohort of CAD patients. However, this longitudinal analysis of CAD patients’ clinical characteristics and treatment patterns over time is an important addition to the sparse CAD literature.
The full-text version of this article contains a data supplement.
Acknowledgments
The authors thank Catherine Broome and members of True North Therapeutics, Inc for valuable suggestions and discussion. The authors are particularly grateful to all the CAD patients who were part of this longitudinal analysis.
This work was supported in part by the resources of the Stanford Center for Population Health Sciences.
Authorship
Contribution: M.M. analyzed and interpreted data, drafted and critically revised the article, and gave final approval of the version to be published; X.J., L.C.B., J.P.F., and H.R. analyzed and interpreted data, critically revised the article, and gave final approval of the version to be published; E.C.C. collected data, critically revised the article, and gave final approval of the version to be published; and S.K. and A.R. conceived or designed the work, critically revised the article, and gave final approval of the version to be published.
Conflict-of-interest disclosure: M.M., X.J., L.C.B., J.P.F., H.R., E.C.C., and S.K. received a grant from True North Therapeutics, Inc for this project. A.R. is employed by True North Therapeutics, Inc and has ownership interests in a start-up company, the stock of which is not publicly traded.
Correspondence: Adam Rosenthal, True North Therapeutics, Inc, 951 Gateway Blvd, South San Francisco, CA 94080; e-mail: adam@truenorthrx.com.

