Key Points
Using EBMT data in >2000 patients from 1994 to 2015, we analyzed the development and factors influencing outcomes of HSCT for ADs.
Transplant center experience, accreditation, and national socioeconomic factors are relevant for outcomes and future health service delivery.
Abstract
Hematopoietic stem cell transplantation (HSCT) has evolved for >20 years as a specific treatment of patients with autoimmune disease (AD). Using European Society for Blood and Marrow Transplantation registry data, we summarized trends and identified factors influencing activity and outcomes in patients with AD undergoing first autologous HSCT (n = 1951; median age, 37 years [3-76]) and allogeneic HSCT (n = 105; median age, 12 years [<1-62]) in 247 centers in 40 countries from 1994 to 2015. Predominant countries of activity were Italy, Germany, Sweden, the United Kingdom, The Netherlands, Spain, France, and Australia. National activity correlated with the Human Development Index (P = .006). For autologous HSCT, outcomes varied significantly between diseases. There was chronological improvement in progression-free survival (PFS, P < 10−5), relapse/progression (P < 10−5), and nonrelapse mortality (P = .01). Health care expenditure was associated with improved outcomes in systemic sclerosis and multiple sclerosis (MS). On multivariate analysis selecting adults for MS, systemic sclerosis, and Crohn disease, better PFS was associated with experience (≥23 transplants for AD, P = .001), learning (time from first HSCT for AD ≥6 years, P = .01), and Joint Accreditation Committee of the International Society for Cellular Therapy and European Society for Blood and Marrow Transplantation accreditation status (P = .02). Despite improved survival over time (P = .02), allogeneic HSCT use remained low and largely restricted to pediatric practice. Autologous HSCT has evolved into a treatment modality to be considered alongside other modern therapies in severe AD. Center experience, accreditation, interspecialty networking, and national socioeconomic factors are relevant for health service delivery of HSCT in AD.
Introduction
Autoimmune diseases (ADs) affect ∼8% of the population in Western countries, but not all are severe and most respond to standard immunosuppressive treatments and supportive care. However, cure remains elusive and many patients suffer the chronic effects of both the disease and their treatment. Economic costs are not only associated with pharmaceuticals, but also with considerable personal and societal impact, especially in progressively disabling states.
Supported originally by preclinical studies and serendipitous case reports, hematopoietic stem cell transplantation (HSCT) has been evolving as a specific treatment of patients with ADs responding poorly or refractory to conventional treatments.1-4 In the mid-1990s, the first transplants performed specifically for ADs were followed by the formation of the European Society for Blood and Marrow Transplantation (EBMT) Autoimmune Diseases Working Party (ADWP) in 1997. The EBMT database was established and multidisciplinary recommendations were published to advise on selection and management of patients5 ; these have been updated by the EBMT.6,7 Similar developments happened worldwide and there have been a large number of retrospective and prospective studies in a wide range of ADs.8-27 More recently, randomized controlled trials have reported confirming proof of principle in several ADs.28-32 Despite international guidelines and recommendations, the uptake of HSCT in AD has been highly variable, both geographically and in respect to type of AD. Factors operational in this relatively specialized area of HSCT practice are unclear, and there have been only 2 national analyses to date that showed different uptake to each other and the overall EBMT picture.33,34
The EBMT ADWP database has now accumulated >2000 patients dating back over 20 years. The aim of this retrospective analysis was to use the EBMT database to summarize the evolution and trends in the development of HSCT for ADs in Europe and other partner countries outside of Europe. In addition, we aimed to identify factors that influence activity and outcomes, including center experience, accreditation status, and health economics, which have been recently linked with improved outcomes in more general analyses of HSCT.35
Patients and methods
EBMT Registry
The EBMT is a not-for-profit, scientific society representing >600 HSCT centers in Europe and other regions of the world. The mission of the EBMT includes quality improvement supported by the central registration of activity relating to HSCT; since 1986, there have been more than half a million registrations. Data are entered, managed, and maintained in a central database in accordance with legal and regulatory requirements for patient consent, data protection, confidentiality, and accuracy. Quality assurance measures include several independent systems: confirmation of validity of the entered data by the reporting team, annual survey exercises, cross-checking with national registries, and regular in-house and external data audits, which are underpinned by accreditation exercises. All EBMT teams are required to obtain signed informed consent for transfer of anonymized data via standardized generic and disease-specific EBMT minimal essential data forms in accordance with data protection regulations. Per EBMT procedures, this study was approved by the ADWP and selected patients who had received HSCT for an AD since the first registration in 1994.
Since 1994, 247 centers in 40 countries have reported data relating to HSCT in AD. Total transplants were recorded as first, second, or third. Teams were predominantly European and are listed in the supplemental Appendix in alphabetical order by country, city, and EBMT center code. Data composing 8% of the total dataset and submitted by centers in the following 10 non-European countries (based on World Health Organization criteria [www.who.org]) were included in the analyses: Australia, Brazil, Canada, China, Colombia, Jordan, Lebanon, Saudi Arabia, Singapore, and South Africa. To adjust for population, transplant rates per country were also calculated as numbers of first HSCT per million inhabitants. National populations were obtained from Eurostat (http://ec.europa.eu/eurostat/data/database) except for Australia, which was the only non-European country included in this part of the analysis. Patients (112, 5.3%) who had been enrolled on the prospective EBMT-based randomized clinical trials Autologous Stem Cell Transplantation International Scleroderma (ASTIS),29 Autologous Hematopoietic Stem Cell Transplantation In Multiple Sclerosis (ASTIMS),30 and Autologous Stem Cell Transplantation for Crohn's Disease (ASTIC)31 were included in the demographic analyses but excluded from the long-term outcomes analyses.
The impact of accreditation by the Joint Accreditation Committee of the International Society for Cellular Therapy and EBMT (JACIE), which awarded its first accreditation in 2001,36 was investigated according to transplants being performed in centers before or without JACIE accreditation vs after JACIE accreditation, based on the date of JACIE accreditation being awarded (data source: JACIE Office, Barcelona, Spain).
Analysis was also performed to explore the association of recent HSCT activity for AD with socioeconomic and macroeconomic factors as well as the organization of transplant teams in European countries. For this purpose the number of autologous HSCTs performed between 2010 and 2015 standardized for country population was correlated with the Human Development Index (HDI), current health care expenditure (HCE), and team density (ie, the number of transplant teams divided by population). The HDI is commissioned by the United Nations Organization to evaluate a country’s socioeconomic achievements in 3 basic aspects: longevity, knowledge, and standard of living. Values of HDI were obtained from the 2013 Human Development Report (http://hdr.undp.org/sites/default/files/reports/14/hdr2013_en_complete.pdf). HCE is defined as the total annual consumption of health goods and services plus capital investment in health care infrastructure, standardized per country population. It includes spending by both public and private sources. Data on HCE were obtained from the Eurostat (http://appsso.eurostat.ec.europa.eu) for the year 2012. Only countries that reported at least 1 HSCT for an AD in the study period were included in the analysis. Data on HCE were available for 18 of 23 countries. For the most frequent indications (multiple sclerosis [MS], systemic sclerosis [SSc], Crohn disease [CD]) results of autologous HSCT were analyzed with respect to median HDI, HCE, and team density of included countries.
Statistical analysis
Descriptive statistics and graphical display were used to summarize trends in HSCT activity over time, per indication and nationally.
For survival analysis, the primary end points were progression-free survival (PFS), relapse incidence (RI), nonrelapse mortality (NRM), and overall survival (OS). PFS was defined as survival with no evidence of relapse or progression; RI as either relapse or progression; NRM as death without evidence of relapse or progression; and OS as the time from transplantation to death, regardless of the cause. Cumulative incidence functions were used to estimate RI and NRM in a competing risks setting because death and relapse compete with each other. Probabilities of PFS and OS were calculated using Kaplan-Meier estimates. Univariate analyses were performed using the Gray test for cumulative incidence functions and the log-rank test for PFS and OS. The influence of chronological timing of transplant on OS, PFS, RI, and NRM in 5-year “epochs” (ie, 1995-1999, 2000-2004, 2005-2010, and 2011-2015) were analyzed for MS, SSc, and CD. To investigate the impact of center activity, transplant activity was dichotomized around the median into low (<23 HSCT) and high (≥23 HSCT) for autologous HSCT procedures. The impact of overall center experience was also investigated by year of original EBMT center registration for first transplant procedure for AD. Small numbers prevented comprehensive analyses in the allogeneic HSCT group.
Associations of patient and graft characteristics with outcomes were evaluated in adult patients autografted for the 3 main indications (MS, SSc, and CD) by multivariate analysis using Cox proportional hazards model. All tests were 2-sided. The type 1 error rate was fixed at 0.05 for determination of factors associated with time to event outcomes. Spearman R test was used to evaluate the health economic associations. Statistical analyses were performed with SPSS 22 (SPSS Inc./IBM, Armonk, NY) and R 3.2.3 (R Development Core Team, Vienna, Austria) software packages.
Results
Registrations and activity
Between January 1994 and December 2015, there were 2097 transplant procedures in 2056 patients (62% female, 8% pediatric <18 years) registered by 247 participating centers in 40 countries. Among 2097 HSCT procedures, there were 1951 patients undergoing first autologous HSCT, with a median age of 37 years (3-76), and 105 patients (11%) undergoing allogeneic HSCT, with a median age of 12 years (<1-62). Forty-one patients had undergone second or third HSCT procedures. Of the 247 teams, most (75%) restricted their activity to autologous HSCT only, but 48 teams (19%) registered both autologous and allogeneic HSCT and 15 teams (6%) registered allogeneic HSCT only. A total of 112 (5.4%) patients were treated on the EBMT ASTIS, ASTIMS, and ASTIC trials.
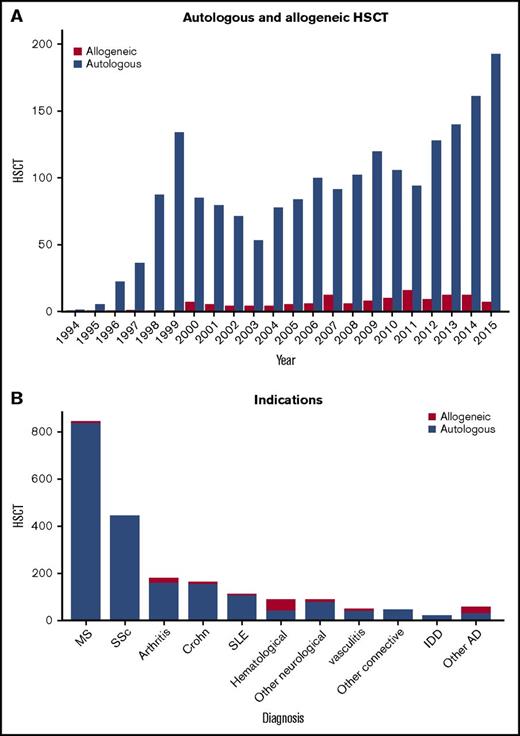
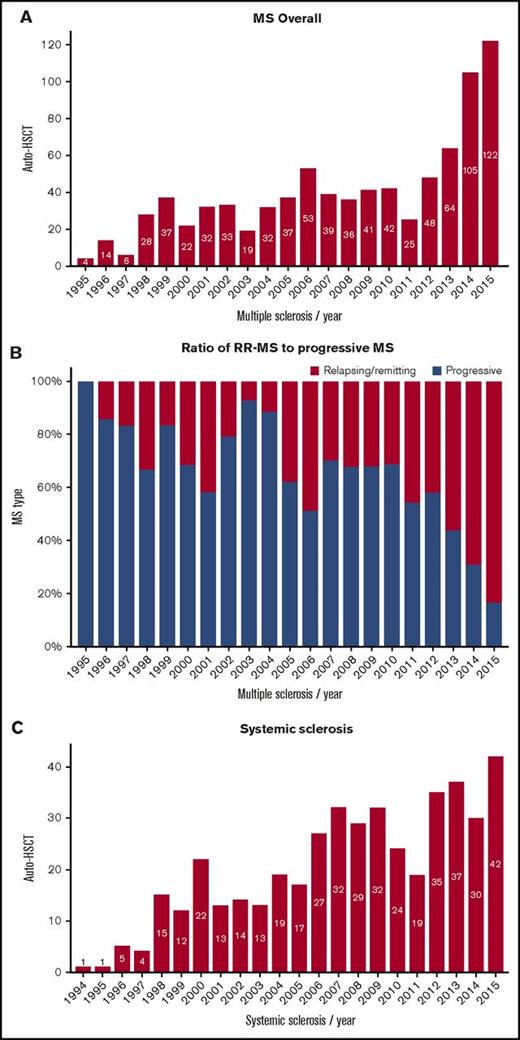
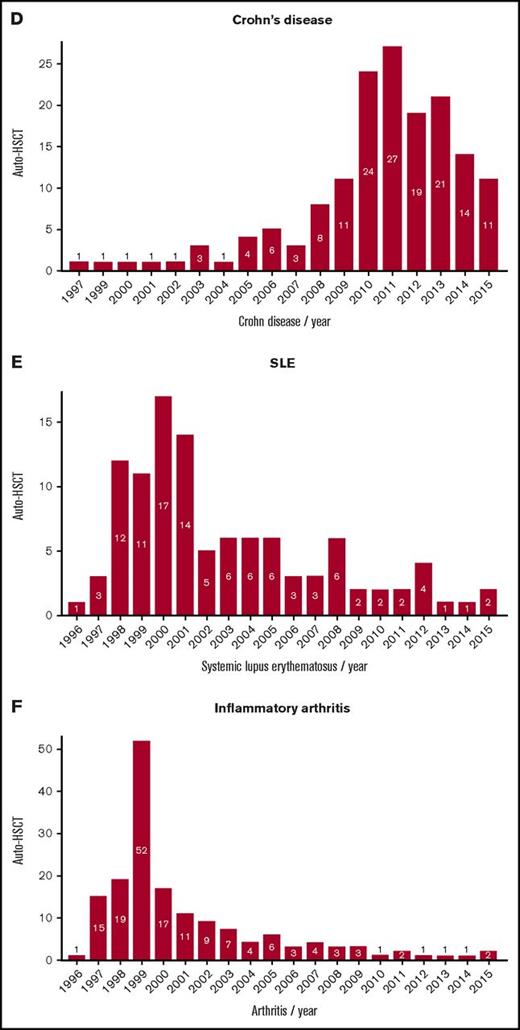
Transplant activity in total and for individual ADs is summarized in Figures 1 and 2. The main indications based on patients treated were MS (n = 839), connective tissue disorders (n = 596), inflammatory arthritis (IA, n = 178), vasculitis (n = 46), inflammatory bowel disease (In = 191), hematological immune cytopenia (n = 97), and IDD (n = 20). Eighty-one patients were treated for other neurological diseases including chronic inflammatory demyelinating polyneuropathy (n = 34), neuromyelitis optica (n = 19), and myasthenia gravis (n = 7). There were 2 peaks of activity, initially in 1999, when IA was the most common indication, then a gradual upward trend from 2006 to 2015, with MS, SSc, and CD, and for which EBMT-based randomized controlled trials had been available, became the most common indications. Annual overall numbers have been increasing in recent years, particularly with MS and SSc, whereas other indications, such as IA and systemic lupus erythematosus (SLE), have diminished considerably.
Trends in activity for HSCT in autoimmune diseases. (A) By autologous and allogeneic HSCT and (B) by indication. IDD, insulin-dependent diabetes.
Trends in activity for HSCT in autoimmune diseases. (A) By autologous and allogeneic HSCT and (B) by indication. IDD, insulin-dependent diabetes.
Trends in activity of autologous HSCT. (A) MS overall, (B) ratio of relapsing remitting (RR)–MS to progressive MS, (C) systemic sclerosis, (D) Crohn disease, (E) SLE, and (F) inflammatory arthritis.
Trends in activity of autologous HSCT. (A) MS overall, (B) ratio of relapsing remitting (RR)–MS to progressive MS, (C) systemic sclerosis, (D) Crohn disease, (E) SLE, and (F) inflammatory arthritis.
National activity
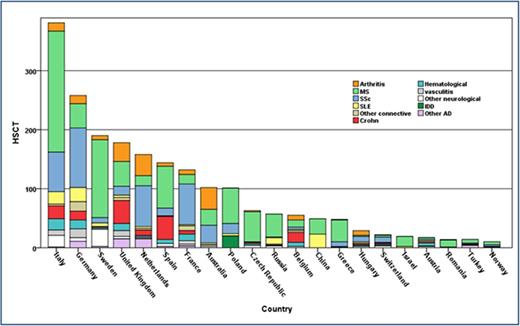
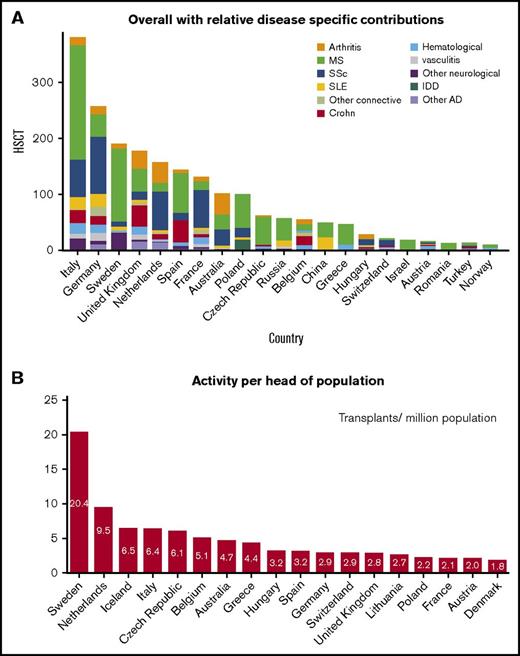
Transplant rates differed substantially among participating European countries. The predominant countries of activity were Italy, Germany, Sweden, the United Kingdom, The Netherlands, Spain, France, and Australia (Figure 3A), which made up 74% of the activity, although some other smaller countries contributed highly based on per head of population (Figure 3B). There was considerable variation in case mix between countries (Figure 3A).
Trends in the activity of HSCT in AD by nation. (A) Overall with relative disease-specific contributions. (B) Activity per head of population.
Trends in the activity of HSCT in AD by nation. (A) Overall with relative disease-specific contributions. (B) Activity per head of population.
In the 2010 to 2015 period, the national transplant rates for autologous HSCT correlated with the values of HDI (Spearman R = 0.55, P = .006). No significant associations were found between the transplant rates and HCE (Spearman R = 0.31, P = .21) or team density per population (Spearman R = 0.28, P = .2).
Outcomes of autologous HSCT and influencing factors
Outcome analysis of the patients undergoing first autologous HSCT, based on 827 for MS, 379 for SSc, 115 for CD, 107 for SLE, 75 for rheumatoid arthritis, 75 for juvenile idiopathic arthritis, 39 for vasculitis, 42 for hematological immune cytopenias, 20 for IDD, and 160 for other indications with a median follow-up of 34 (<1-234) months), showed global 3- and 5-year OS rates of 89% and 86%, PFS of 57% and 49%, RI of 38% and 46%, and NRM of 4.6% and 5.3%.
Outcome according to time periods
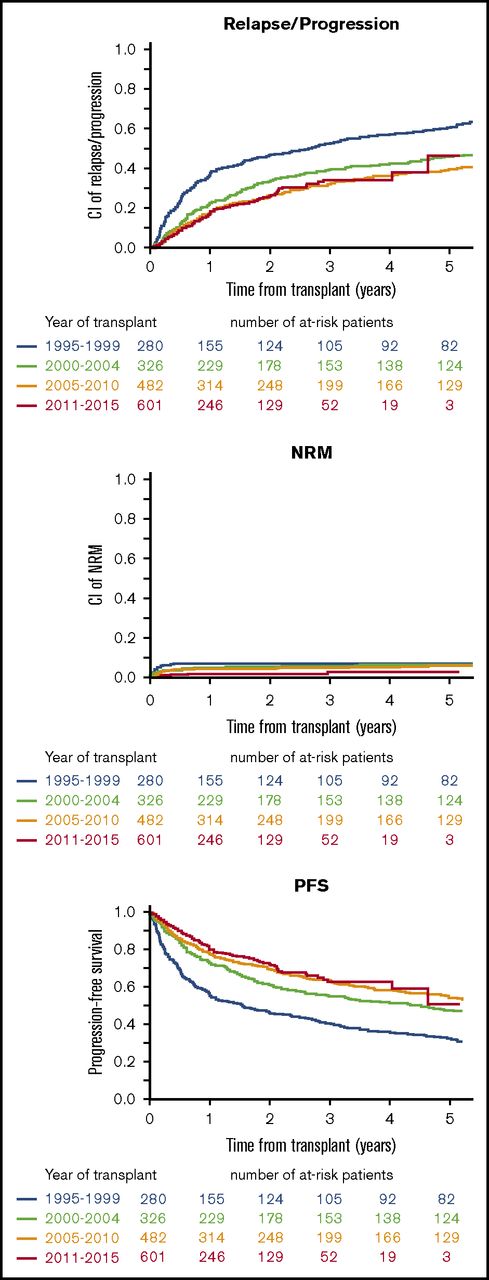
On univariate analysis of outcomes across time epochs (1994-1999, 2000-2004, 2005-2010, and 2011-2015), there was a chronological improvement in PFS (P < 10−5), relapse/progression (P < 10−5), and NRM (P = .01) (Figure 4).
Epoch analysis of trends in incidence of relapse/progression, NRM, and PFS from 1995 to 1999, 2000 to 2004, 2005 to 2010, and 2011 to 2015 (all indications). Data for 100-day NRM and 3-year NRM, RI, PFS, and OS, respectively, were: 1994-1999: 6.4%, 7.1%, 52.2%, 40.6%, and 87%; 2000-2004: 3.7%, 5.6%, 39.3%, 55.1%, and 88.4%; 2005-2010: 3.2%, 4.9%, 32.2% 62.9%, and 89.6%; and 2011-2015: 1.3%, 3%, 34.2% 62.8%, and 90.3%. CI, confidence interval.
Epoch analysis of trends in incidence of relapse/progression, NRM, and PFS from 1995 to 1999, 2000 to 2004, 2005 to 2010, and 2011 to 2015 (all indications). Data for 100-day NRM and 3-year NRM, RI, PFS, and OS, respectively, were: 1994-1999: 6.4%, 7.1%, 52.2%, 40.6%, and 87%; 2000-2004: 3.7%, 5.6%, 39.3%, 55.1%, and 88.4%; 2005-2010: 3.2%, 4.9%, 32.2% 62.9%, and 89.6%; and 2011-2015: 1.3%, 3%, 34.2% 62.8%, and 90.3%. CI, confidence interval.
Outcome according to economic factors
On univariate analysis restricted to autologous HSCT in patients with MS, HCE greater than the median was associated with increased probability of PFS (P = .02) whereas national team density per population greater than the median was associated with reduced RI (P = .002) and increased rate of PFS (P = .004). Among patients with SSc, increased probability of OS (P = .01) and decreased incidence of both early (P = .02) and overall NRM (P = .02) was observed for countries with HCE greater than the median. No associations of outcome with socioeconomic factors and team density were observed for patients with CD, perhaps because of limited numbers (Table 1).
Results of autologous hematopoietic stem cell transplantation according to country socioeconomic factors and transplant team density
| . | N . | RI, % (95% CI) . | NRM, % (95% CI) . | 100 d NRM, % (95% CI) . | PFS, % (95% CI) . | OS, % (95% CI) . |
|---|---|---|---|---|---|---|
| Multiple sclerosis | ||||||
| HDI | ||||||
| ≤Median | 503 | 35.4 (29.9-40.9) | 1.6 (0.7-3.2) | 1.6 (0.7-3.2) | 63 (57.4-68.6) | 95.4 (93.3-97.6) |
| >Median | 226 | 38.5 (29.5-47.3) | 0.5 (0-2.6) | 0.5 (0-2.6) | 61 (52.1-69.9) | 95.5 (91.8-99.3) |
| P | .98 | .55 | .55 | .87 | .27 | |
| HCE | ||||||
| ≤Median | 291 | 46.1 (38.3-53.6) | 2 (0.8-4.5) | 2.1 (0.8-4.5) | 51.8 (44.2-59.5) | 94.8 (91.7-97.9) |
| >Median | 205 | 37.9 (28.5-47.3) | 0 | 0 | 62.1 (52.6-71.6) | 95.5 (91.4-99.7) |
| P | .054 | .21 | .2 | .02 | .59 | |
| Team density | ||||||
| ≤Median | 465 | 42.6 (36.2-48.9) | 1 (0.3-2.4) | 1 (0.3-2.4) | 56.4 (50-62.8) | 96.4 (94.3-98.5) |
| >Median | 264 | 27.5 (21-34.4) | 1.8 (0.6-4.2) | 1.8 (0.6-4.2) | 70.7 (63.9-77.6) | 94.1 (90.8-97.5) |
| P | .002 | .63 | .66 | .004 | .24 | |
| Systemic sclerosis | ||||||
| HDI | ||||||
| ≤Median | 124 | 31 (21.6-40.8) | 10 (5-16.9) | 6.4 (2.8-12.1) | 59 (48.8-69.3) | 79.1 (70.7-87.5) |
| >Median | 209 | 31.1 (23.8-38.7) | 7 (3.9-11.2) | 5.2 (2.7-9) | 6 1.9 (54.1-69.7) | 81.1 (75.3-87) |
| P | .8 | .44 | .44 | .8 | .4 | |
| HCE | ||||||
| ≤Median | 117 | 37.3 (27.1-47.5) | 11.8 (6.4-19.1) | 8.4 (4.1-14.6) | 50.9 (40.3-61.5) | 75.2 (66.4-84) |
| >Median | 154 | 29.3 (20.9-38.1) | 5.8 (2.7-10.7) | 4.2 (1.7-8.5) | 64.9 (55.9-73.9) | 81.5 (74.6-88.5) |
| P | .71 | .02 | .02 | .07 | .01 | |
| Team density | ||||||
| ≤Median | 123 | 30.1 (20.8-40) | 9 (4.3-15.7) | 6.4 (2.8-12.1) | 60.9 (50.6-71.2) | 80.5 (72.3-88.6) |
| >Median | 210 | 31.6 (24.2-39.2) | 7.5 (4.3-11.9) | 5.2 (2.6-9) | 60.9 (53.1-68.7) | 80.4 (74.5-86.4) |
| P | .87 | .79 | .77 | .75 | .93 | |
| Crohn disease | ||||||
| HDI | ||||||
| ≤Median | 60 | 62.8 (45.4-76.1) | 1.7 (0.1-8.2) | 1.7 (0.1-8.2) | 35.5 (20.5-50.4) | 98.3 (95-100) |
| >Median | 41 | 56.5 (31.3-75.6) | 0 | 0 | 43.5 (21.7-65.4) | 97.5 (92.7-100) |
| P | .31 | .44 | .44 | .23 | .87 | |
| HCE | ||||||
| ≤Median | 46 | 60.5 (41-75.3) | 2.2 (0.2-10.1) | 2.2 (0.2-10.1) | 37.3 (20.6-54.1) | 97.8 (93.6-100) |
| >Median | 41 | 56.5 (31.3-75.6) | 0 | 0 | 43.5 (21.7-65.4) | 97.5 (92.7-100) |
| P | .45 | .38 | .38 | .33 | .9 | |
| Team density | ||||||
| ≤Median | 56 | 57.8 (40.5-71.8) | 1.8 (0.1-8.6) | 1.8 (0.1-8.6) | 40.3 (24.9-55.8) | 96.4 (91.6-100) |
| >Median | 45 | 65.6 (39.5-82.5) | 0 | 0 | 34.4 (13.8-55.1) | 100 (100-100) |
| P | .76 | .41 | .41 | .61 | .7 | |
Prognostic factors after autologous HSCT
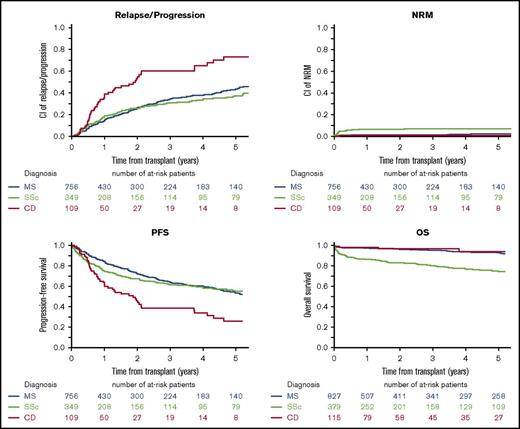
Outcomes (NRM, relapse/progression, PFS, and OS) varied significantly among the 3 most common current indications (ie, MS, SSc, and CD) and are presented graphically in Figure 5. This was confirmed in multivariate analysis of adult patients (Table 2). Other factors independently associated with a better PFS were experience (≥23 transplants for AD, P = .001), learning (time from first HSCT for AD ≥6 years, P = .01), and JACIE accreditation status (P = .02). There was also a very strong influence of age, with significantly lower NRM and better survival in younger patients.
Long-term OS, PFS, cumulative relapse incidence, and NRM following first autologous HSCT in MS, SSc, and CD. Data for 100-day NRM and 3-year NRM, RI, PFS, and OS for each disease were as follows: MS, 1.1% (95% CI, 0.5-2.1) and 1.5% (95% CI, 0.8-2.7), 34.4% (95% CI, 30.1-38.8), 64% (95% CI, 59.6-68.5), and 95.5% (95% CI, 0.80-2.7); SSc, 5% (95% CI, 3.7-7.7), 7.2% (95% CI, 4.7-10.4), 31.1% (95% CI, 25.5-36.7), 61.8% (95% CI, 55.9-67.6), and 80.3% (95% CI, 75.8-84.8); CD, 0.9% (95% CI, 0.1-4.7), 0.9% (95% CI, 0.1-4.7), 60.4% (95% CI, 47.7-70.9), 38.7% (95% CI, 27.2-50.1), and 96.7% (95% CI, 93-100).
Long-term OS, PFS, cumulative relapse incidence, and NRM following first autologous HSCT in MS, SSc, and CD. Data for 100-day NRM and 3-year NRM, RI, PFS, and OS for each disease were as follows: MS, 1.1% (95% CI, 0.5-2.1) and 1.5% (95% CI, 0.8-2.7), 34.4% (95% CI, 30.1-38.8), 64% (95% CI, 59.6-68.5), and 95.5% (95% CI, 0.80-2.7); SSc, 5% (95% CI, 3.7-7.7), 7.2% (95% CI, 4.7-10.4), 31.1% (95% CI, 25.5-36.7), 61.8% (95% CI, 55.9-67.6), and 80.3% (95% CI, 75.8-84.8); CD, 0.9% (95% CI, 0.1-4.7), 0.9% (95% CI, 0.1-4.7), 60.4% (95% CI, 47.7-70.9), 38.7% (95% CI, 27.2-50.1), and 96.7% (95% CI, 93-100).
Relationship among age, year of HSCT, JACIE accreditation status, mean center size, and outcome of autologous HSCT for AD using multivariate Cox analysis
| . | Relapse HR (95% CI) . | NRM HR (95% CI) . | NRM day 100 HR (95% CI) . | PFS HR (95% CI) . | OS HR (95% CI) . |
|---|---|---|---|---|---|
| Age (at transplant) per 10-y period | 1.00 (0.90-1.11) | 1.51 (1.14-2.02) | 1.73 (1.17-2.55) | 1.05 (0.95-1.16) | 1.35 (1.15-1.58) |
| P | .97 | .005 | .006 | .32 | .0002 |
| MS (reference) | 1 | 1 | 1 | 1 | 1 |
| SSc | 0.9 (0.70-1.16) | 3.10 (1.50-6.41) | 3.05 (1.21-7.70) | 1.04 (0.83-1.31) | 3.18 (2.18-4.66) |
| P | .41 | .002 | .018 | .72 | <10−5 |
| CD | 2.42 (1.73-3.39) | 0.82 (0.11-6.36) | 1.08 (0.13-8.80) | 2.32 (1.67-3.22) | 0.68 (0.21-2.21) |
| P | <10−5 | .85 | .94 | <10−5 | .53 |
| ≥23 autologous HSCT for AD (experience) | 0.77 (0.62-0.95) | 0.36 (0.18-0.73) | 0.29 (0.11-0.74) | 0.72 (0.59-0.88) | 0.62 (0.44-0.88) |
| P | .017 | .004 | .010 | .001 | .007 |
| ≥6 y from first HSCT for AD (learning) | 0.78 (0.60-0.97) | 0.55 (0.26-1.16) | 0.35 (0.14-0.89) | 0.74 (0.59-0.93) | 0.89 (0.59-1.34) |
| P | .02 | .12 | .028 | .010 | .58 |
| After JACIE | 0.70 (0.50-0.98) | 0.37 (0.11-1.27) | 0.55 (0.15-1.94) | 0.67 (0.49-0.93) | 0.59 (0.33-1.08) |
| P | .04 | .12 | .35 | .015 | .087 |
| ≥42 autos/y for any indication (mean center size) | 1.03 (0.84-1.27) | 0.95 (0.50-1.80) | 1.26 (0.56-2.85) | 1.03 (0.85-1.26) | 0.90 (0.64-1.27) |
| P | .76 | .88 | .58 | .76 | .54 |
Hazard ratio (HR) <1 = good prognosis.
Autos, autologous HSCTs.
Trends in autologous transplant techniques
With respect to stem cell source, there was a significant trend to increasing use of peripheral blood stem cell (1994-1999, 86.3%; 2000-2004, 92.9%, 2005-2010, 98.2%; and 2011-2015, 99.6%; P < 10−3). Trends in conditioning regimens, subgrouped per previous EBMT guidelines6 (ie, (a) “high intensity,” including total body irradiation or high-dose busulphan-containing regimens, (b) “low intensity,” referring to cytarabine alone, melphalan alone, and fludarabine-based regimens, or (c) “intermediate intensity,” including other combinations, such as carmustine, etoposide, cytarabine, and melphalan, and, in most patients, the combined use of antithymocyte globulin with high-dose cytarabine or other chemotherapy) confirmed significant changes in the intensity of the conditioning regimens used for autologous HSCT over the 4 time epochs, with an increasing use of intermediate intensity regimens in the 3 main indications, MS (P < 10−3), SSc (P < 10−3), and CD (P = .02). Overall, the improvements in outcomes across the time epochs were statistically stronger for patients treated with intermediate intensity regimens (Table 3).
Improvement with 3-y outcomes over time epochs in patients undergoing first autologous HSCT with intermediate intensity conditioning regimens
| . | N . | RI/progression, % (95% CI) . | NRM, % (95% CI) . | 100-d NRM, % (95% CI) . | PFS, % (95% CI) . | OS, % (95% CI) . |
|---|---|---|---|---|---|---|
| 1995-1999 | 140 | 42.8 (34.4-50.9) | 7.2 (3.7-12.3) | 7.2 (3.7-12.3) | 50 (41.7-58.4) | 85.6 (79.8-91.5) |
| 2000-2004 | 199 | 37.3 (30.4-44.2) | 5.8 (3.1-9.7) | 4.7 (2.3-8.4) | 56.9 (49.8-64) | 88.1 (83.6-92.7) |
| 2005-2010 | 470 | 29.1 (24.6-33.8) | 4.9 (3.1-7.3) | 3.9 (2.4-6.1) | 65.9 (61.1-70.7) | 89.1 (86.1-92.1) |
| 2011-2015 | 650 | 33.8 (27.3-40.4) | 1.4 (0.6-2.8) | 1.2 (0.5-2.4) | 64.8 (58.2-71.4) | 93.6 (90.7-96.6) |
| P | .001 | .002 | .002 | <105 | .006 |
Outcomes of allogeneic HSCT
Long-term outcome analysis of the patients undergoing first allogeneic HSCT showed global 3- and 5-year OS rates of 67% and 64%, PFS 59% and 56%, and RI 21% and 24%, respectively. NRM rose from 13% at 100 days and plateaued at 20% at 3 and 5 years. Only univariate analysis was possible because of limited numbers. There was evidence for improvement of OS over the time epochs (2000-2004, 2005-2010, and 2011-2015), better outcomes in patients <18 years in terms of relapse (P = .002), but no effect of center experience (≥2 patients). Detailed analysis of indications was limited by data, although OS was better in arthritis than hematological immune cytopenia (P = .03).
Discussion
This extended report using the EBMT registry confirms that activity in HSCT for severe AD is sustained and increasing, despite the introduction and widespread adoption of biological and other modern therapies in neurology, rheumatology, gastroenterology, and other specialties. The doubling of activity of autologous HSCT procedures between 2011 and 2015 supports the impact of publishing EBMT guidelines6 and of the EBMT ASTIS, ASTIMS, and ASTIC trials,29-31 along with other higher quality data in MS, SSc, and CD.
For the past 15 years, MS has emerged as the major indication, and with the increased evidence base supporting the greatest benefit in the inflammatory phase of disease,37,38 there has been a gradual shift to a major predominance of relapsing-remitting over progressive forms. Despite the relatively high risks of HSCT in SSc, the increasing activity is now supported by 3 randomized controlled trials providing proof of principle over conventional treatment.26,29,32 Contrastingly, in other diseases, particularly IA and SLE, in which biological and other modern therapy has proven highly effective and well tolerated, activity of autologous HSCT has fallen dramatically despite evidence of benefit.8,10,13
Activity has varied considerably between countries, both overall and per head of population, and in relation to specific ADs. The reasons for this are not clear but potentially explained by the relationship between HSCT and disease-specific societies at the national level and other local working partnerships. On a more general level, our analysis supports national activity being related to the socioeconomic status of a country, as reflected by the HDI. This is consistent with previous analyses relating to acute leukemias and general HSCT activity.39,40 However, in contrast to previous reports covering HSCT as a whole, we were unable to demonstrate a significant correlation between transplant rates in European countries and HCE or team density.40,41 Our results suggest that some factors specific to autoimmune diseases may be relevant, such as uptake of HSCT as a potential treatment by disease-specific national societies and communities and health service funding of transplant procedures.
As demonstrated for other diseases, economic factors may influence outcome.41,42 According to results of our univariate analysis for patients with MS and SSc, autologous HSCT performed in countries with lower HCE was associated with increased risk of NRM and inferior PFS rates. Such association of economic factors with outcome in the field of autoimmune diseases requires further investigation.
In support of a learning and experiential curve, there was significant improvement in NRM along with PFS and relapse rate in the epoch analysis. The benefit of center experience is also reflected by improved outcomes in more active centers (≥23) and those with a longer history of performing HSCT for ADs. JACIE accreditation was associated with better PFS and lower relapse rates, supporting better patient selection or other unidentified factors. Refinement of autologous transplant technique with time, with increasing use of peripheral blood stem cell and “intermediate” intensity conditioning regimens (as per current EBMT guidelines6 ) may have contributed, although it was not possible to quantitate the impact of improved supportive care over the past 2 decades using the EBMT registry.
Another major influence is the type of autoimmune disease being transplanted, with significant differences in outcomes among MS, SSc, and CD. NRM at 100 days was markedly different, especially in the major AD indications. In MS and CD, it was significantly lower than with SSc (in which there is often compromise of vital organ function resulting in poor tolerance of HSCT). To improve NRM risk in SSc, the ADWP has recently published recommendations for cardiopulmonary screening as a means of optimizing patient selection.7
The use of allogeneic HSCT remained low throughout the whole period and is largely restricted to pediatric practice, with hematological immune cytopenias as the predominant indication. Unfortunately, the limited numbers prevented detailed analyses of trends and outcomes, although long-term survival outcomes support basic biological differences in the responses of AD to allogeneic and autologous HSCT in terms of cure, with long-term NRM risks of ∼20%, allogeneic HSCT will remain limited and developmental in its application to ADs. Further research using registry data is needed.
We recognize that there are limitations to this type of registry-based analysis, which covers many types of AD. For example, we accept limitations in the recording of responses of individual AD compared with specially designed prospective trials in specific AD. In the current EBMT Guidelines,6 we have highlighted the challenge of applying the usual, mainly oncology-based, response parameters in HSCT (ie, complete response, partial response, relapse/progression, and NRM with associated OS and PFS to AD), where various “bespoke” classifications have been used and there is conventionally a much greater emphasis is on functional and quality of life responses than in oncology. However, in a large aggregated retrospective analysis of this kind, the use of standard HSCT response parameters provides the opportunity for a broad assessment of the impact of HSCT in patients with severe treatment-resistant AD, most of whom were treated on an individualized compassionate basis outside of large clinical trials.
The future of HSCT in autoimmune diseases very much depends on the “dynamic” with alternative treatment options, including the new biological agents. Ongoing development of the field depends on hematologists working closely with other specialists and their respective societies, as well as public health commissioners, to define where HSCT sits in relation to other modern treatments. Even in MS, SSc, and CD, the evidence base for HSCT is still relatively limited, and further prospective studies are required to compare HSCT with evolving modern treatments. Studies are also required to refine conditioning regimens and other aspects of care, which were originally translated from oncological or aplastic anemia practice and agreed by consensus rather than design.43
Late effects of HSCT and nontransplant treatments also need to be considered, including impacts on the endocrine, reproductive, and cardiovascular systems as well as secondary autoimmune diseases and neoplasia.6,44-46
In conjunction with both prospective and registry studies, mechanistic studies have been progressively produced.47-50 The recent publication of guidelines for studies of immune reconstitution studies and biobanking provides the necessary framework for further development of mechanistic studies.51 More standardized approaches to immune monitoring should facilitate correlative studies with outcomes of HSCT and potentially enable biomarkers to be developed to assist with patient selection and treatments.52
As well as long-term efficacy and safety there is also major health economic dynamic between HSCT and standard alternatives in the main autoimmune disease indications. Although some work has been performed in MS and type 1 diabetes,53-55 formal health economic modeling is warranted to fully evaluate the cost-effectiveness of HSCT vs the standard of care in other diseases.
Should there be “Centers of Excellence” where there is both HSCT and specialist expertise working closely in the same hospital? The concept of an experienced team might have benefits not only in terms of transplant skills, but also familiarity with the clinical idiosyncrasies within this patient group. Although it is not generally within the convention and collaborative spirit of the EBMT for individual center activity and outcome data to be published openly, such data are routinely available to national professional societies, health commissioners, and related public health bodies who oversee the provision of HSCT services in each country. The association of improved outcomes in more experienced centers may assist decision-making in commissioning of HSCT in AD on a national level, with consideration of concentrating activity into centers of specialization. In addition, the EBMT and JACIE are currently developing a benchmarking system for center transplant outcomes across all indications.36
In conclusion, HSCT for AD has evolved gradually on the back of preclinical experiments, circumstantial data, sporadic treatments, and small-scale clinical trials to more robust evidence from large database studies and high-quality randomized controlled trials and other trial data. “Implementation science” is now needed to bring the field properly into routine clinical practice alongside alternative treatments and in tandem with clinical science, health economics, and education. Centers of specialization and experience may be required, along with further refinement of transplant techniques. Ultimately, widespread clinical adoption between many specialties will be embedded within appropriately resourced health service delivery.
The full-text version of this article contains a data supplement.
Acknowledgments
The authors acknowledge the support of the contributing centers, their clinical teams, and their data managers in the production of this analysis as listed in the supplemental Appendix.
Authorship
Contribution: J.A.S., D.F., M.B., M.L., S.G., E.M., Z.M., P.B., and R.S. made substantial contributions to the research design, acquisition, analysis, and interpretation of data; T.A., J.B., J.M., M.R., N.M.W., M.K., R.G., E.S., T.K., and K.K. are active members of the European Society for Blood and Marrow Transplantation Autoimmune Diseases Working Party and national links for the main countries contributing to the database; and all authors were involved in drafting the paper, revising it critically, and approval of the submitted and final versions.
Conflict-of-interest disclosure: J.A.S. has received honoraria from Sanofi and Jazz for speaking at educational events. J.B. has received travel support and/or lecture honoraria from Almirall, Biogen, Genzyme a Sanofi Company, Hospira, and Merck Serono, and unconditional research grants from Biogen and Merck Serono. The remaining authors declare no competing financial interests.
A list of the active members of the European Society for Blood and Marrow Transplantation (EBMT) Autoimmune Diseases Working Party (ADWP), EBMT Paediatric Working Party (PWP), and the Joint Accreditation Committee of the International Society for Cellular Therapy (ISCT) and EBMT (JACIE) appears in the online appendix.
Correspondence: John A. Snowden, Department of Haematology, Sheffield Teaching Hospitals NHS Foundation Trust, Royal Hallamshire Hospital, Glossop Road, Sheffield S10 2JF, United Kingdom; e-mail: john.snowden@sth.nhs.uk.

