

Key Points
Pretherapy TMTV is reflective of the FL tumor cell burden within malignant nodes.
Glucose-avid intratumoral T cells influence pretherapy SUVmax in FL.

Data on the prognostic impact of pretherapy 18F-fluorodeoxyglucose–positron emission tomography (FDG-PET) in follicular lymphoma (FL) is conflicting. The predictive utility of pretherapy total metabolic tumor volume (TMTV) and maximum standardized uptake value (SUVmax) on outcome appears to vary between regimens. Chemoimmunotherapies vary in the extent of T-cell depletion they induce. The role of intratumoral T cells on pretherapy FDG-PET parameters is undefined. We assessed pretherapy FDG-PET parameters and quantified intratumoral T cells by multiple methodologies. Low intratumoral T cells associated with approximately sixfold higher TMTV, and FL nodes from patients with high TMTV showed increased malignant B-cell infiltration and fewer clonally expanded intratumoral CD8+ and CD4+ T-follicular helper cells than those with low TMTV. However, fluorescently labeled glucose uptake was higher in CD4+ and CD8+ T cells than intratumoral B cells. In patients with FDG-PET performed prior to excisional biopsy, SUVmax within the subsequently excised node associated with T cells but not B cells. In summary, TMTV best reflects the malignant B-cell burden in FL, whereas intratumoral T cells influence SUVmax. This may contribute to the contradictory results between the prognostic role of different FDG-PET parameters, particularly between short- and long-term T-cell–depleting chemoimmunotherapeutic regimens. The impact of glucose uptake in intratumoral T cells should be considered when interpreting pretherapy FDG-PET in FL.
Introduction
The identification of patients with follicular lymphoma (FL) that is destined to respond poorly to frontline therapy remains elusive.1 To this end, quantifiable pretherapy 18F-fluorodeoxyglucose-positron emission tomography-computed tomography (FDG-PET) imaging parameters have been evaluated to identify such high-risk patients. The parameters include total metabolic tumor volume (TMTV), which gives insight into the burden of the tumor by 3-dimensional quantification encompassing all involved sites, and maximum standardized uptake value (SUVmax), a standardized measure of the highest FDG-uptake within a single lesion. Pooled analyses of predominantly cyclophosphamide, doxorubicin, vincristine, and prednisone+ rituximab (R-CHOP)–treated patients (of whom only a subset received R maintenance) found that increased pretherapy TMTV is a strong predictor of an adverse outcome in FL.2,3 Interestingly, in the same group of treated patients, both a low and high SUVmax have been associated with a reduced progression-free survival (PFS).4,5 However, FDG-PET analysis of the phase 3 GALLIUM study (58% treated by bendamustine induction), in which all patients received anti-CD20 antibody maintenance, found no association with either TMTV or SUVmax.6 Intriguingly, high pretherapy SUVmax was associated with shorter PFS in nonanthracycline-treated (mainly bendamustine or lenalidomide) but not in anthracycline (R-CHOP)–treated patients in another study.7
The predictive utility of a pretherapy T-effector gene signature in patients treated with CHOP/CVP (cyclophosphamide, vincristine, prednisone)-rituximab/obinutuzumab is reversed in patients treated with bendamustine-rituximab (B-R)/obinutuzumab.8 Unlike R-CHOP, B-R causes profound and sustained T-cell depletion.9 Rituximab maintenance after B-R induction may prolong CD4+ T-cell lymphopenia,10 involving reduced production of interleukin-17 and -15, which are critical for survival of CD4+ T-cell memory.11 The extent to which clonally expanded T cells infiltrate the tumor microenvironment (TME) in FL is also prognostic.12 Notably, the TME is distinct from that of other non-Hodgkin and Hodgkin lymphomas, with a high population of CD4+ T-follicular helper cells (TFH).13 Although the FDG-tracer detects cellular glucose-uptake by all viable cells within the tumor site, to our knowledge, the role of intratumoral T cells on pretherapy FDG-PET parameters in FL remains undefined. Potentially, differences in the prognostic impact between SUVmax and TMTV in FL across studies, may in part reflect the differential depletion of glucose-avid intratumoral T cells after exposure to different chemoimmunotherapeutic regimens.
FDG-PET is integral to FL management. In this study, we assessed the relationship of TMTV and SUVmax with intratumoral T cells in FL. The findings have implications for the improved interpretation of FDG-PET metrics in FL, which remains an unmet need in this disease.
Methods
The study was approved by the institutional regulatory board (Metro South Human Research Ethics Committee) and was conducted in concordance with the Declaration of Helsinki. Eighty-three patients with histologically confirmed de novo grade 1 to 3a FL were included (characteristics in Table 1). The consort diagram (supplemental Figure 1) outlines sample testing, which was based solely on availability.
Patient baseline characteristics in the Brisbane and Canberra cohorts
| Brisbane (n = 63) | Canberra (n = 20) | |
|---|---|---|
| Age, y | ||
| Median | 62 | 66 |
| Range | 29-84 | 43-87 |
| >60 | 34 (55) | 14 (67) |
| Sex | ||
| Female | 27 (43) | 12 (60) |
| Male | 36 (57) | 8 (40) |
| Ann Arbor stage | ||
| I-II | 10 (16) | 1 (6) |
| III-IV | 53 (84) | 18 (94) |
| LDH | ||
| Normal | 46 (73) | 10 (53) |
| >ULN | 17 (27) | 9 (47) |
| Hemoglobin, g/dL | ||
| ≥12 | 47 (75) | 16 (80) |
| <12 | 16 (25) | 4 (20) |
| Nodal involvement, n | ||
| ≤4 | 24 (38) | 3 (17) |
| >4 | 39 (62) | 15 (83) |
| Grade | ||
| 1-2 | 55 (87) | 13 (65) |
| 3A | 8 (13) | 7 (35) |
| Ki67 by IHC, % | ||
| <20 | 23 (70) | — |
| ≥20 | 10 (30) | — |
| FLIPI | ||
| 0 | 2 (3) | |
| 1 | 7 (11) | |
| 2 | 25 (40) | 6 (33) |
| 3 | 19 (30) | 8 (44) |
| 4 | 6 (10) | 4 (22) |
| 5 | 4 (6) | — |
| Initial treatment | ||
| R-chemo | 42 (66) | 10 (50) |
| Observation | 15 (24) | 5 (25) |
| O-chemo | 2 (3) | 3 (15) |
| R-mono | 1 (2) | 2 (10) |
| XRT only | 3 (5) | 0 (0) |
| Maintenance therapy | ||
| Yes | 33 (52) | 9 (45) |
| No | 30 (48) | 11 (55) |
Data are expressed as the number (percentage) of patients in the subgroups, unless otherwise stated.
FLIPI, Follicular Lymphoma International Prognostic Index; IHC, immunohistochemistry; LDH, lactate dehydrogenase; maintenance therapy, maintenance anti-CD20 monoclonal antibody therapy; O-chemo, obinutuzumab chemotherapy; R-chemo, rituximab chemotherapy; R-mono, rituximab monotherapy; ULN, upper limit of normal; XRT, radiation therapy.
Pretherapy FDG-PET scans were assessed for SUVmax, TMTV, and total lesion glycolysis (TLG), using customized software (MIM Software, Cleveland, OH).6,14 ,15 Biopsy samples (formalin-fixed, paraffin-embedded tissue and tumor-infiltrating lymphocytes [TILs] from deaggregated nodes) were used for multiplex gene hybridization, immunohistochemistry, T-cell receptor (TCR) repertoire sequencing and flow cytometry as published.12,16 -19 Cryopreserved TILs were used to assess cellular glucose uptake by intratumoral CD4+ T cells, CD8+ T cells, and CD19+ B cells, by using the fluorescently labeled glucose analogue 2-NBDG uptake assay (Abcam).20 The supplemental Methods provides a detailed description.
Results and discussion
Multiplex gene hybridization was used to quantify intratumoral T-cell infiltration in 45 patients with FL and compared with TMTV. T-cell infiltration was calculated by a standardized CD4 and CD8A gene z-score, with T-cellLO defined as quartiles 1 to 3 (n = 34), and T-cellRICH as quartile 4. Patients with a T-cellLO state had a significantly higher TMTV than T-cellRICH (approximately fivefold, using the 41% SUVmax, and approximately sixfold using SUV ≥2.5; Figure 1A-B). TLG was also significantly higher in T-cellLO states (approximately sevenfold; Figure 1C). Next, proportions of clonal (light-chain restricted) B cells and CD4+ and CD8+ T cells were enumerated by flow cytometry in 54 fresh nodal tissues. Those with greater than the median cutoff of FL B cells within tumor biopsy specimens (FL B cellsRICH) had approximately twofold higher TMTV than those with FL B cellsLO (Figure 1D). High Ki67 was also associated with increased TMTV (Figure 1E). However, TMTV was not associated with histological grade (1 and 2 vs 3A) or serum lactate dehydrogenase (supplemental Figure 2). Put together, the results indicate that TMTV reflects the burden of malignant B cells within FL nodes, which explains its inverse association with T-cell infiltration.
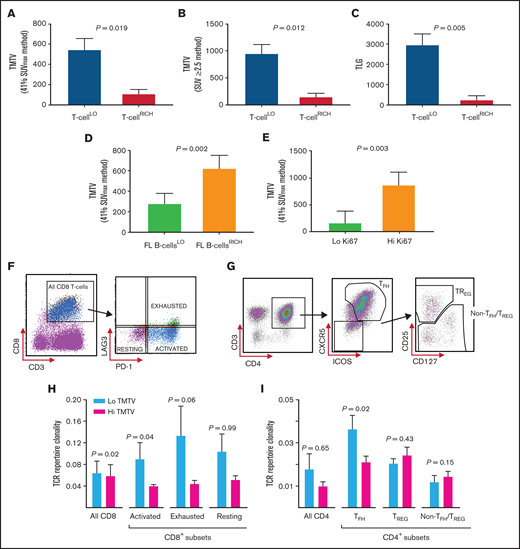
Analyses of the biologic determinants of TMTV in FL. (A) TMTV (in cubic centimeters), determined by 41% SUVmax, in patients with T-cellLO or T-cellRICH infiltrate in the nodes. T-cell infiltrative states were measured by calculating a standardized CD4 and CD8A gene z-score for each sample by multiplex gene hybridization. T-cellLO: quartiles 1-3; n = 34. T-cellRICH: quartile 4; n = 11. (B) TMTV, determined by SUV ≥2.5, in patients with T-cellLO and T-cellRICH tumors. (C) TLG (in grams), in patients with a T-cellLO or T-cellRICH tumor infiltrate. (D) TMTV in patients with a low (FL B cellsLO; n = 27) or high (FL B cellsRICH, n = 27) intratumoral FL B-cell infiltrate. FL B-cell infiltration was quantified by a median cutoff for the percentage of light-chain–restricted CD19+ FL B cells (≤60%), by using flow cytometric quantification of tumor lymphocytes in 54 fresh tissue samples. TMTV was determined by the 41% SUVmax method. (E) TMTV in patients with a low Ki67 expression (<20%; n = 23), and high Ki67 expression (≥20%; n = 10). Ki67 expression was assessed by immunohistochemistry, and a 20% cutoff threshold was chosen, as previously published.25 (F) Gating strategy for CD8+ T-cell subsets obtained from cryopreserved FL TIL samples to allow for the identification of PD-1+LAG3− (activated, ∼58% CD8+ cells), PD-1+LAG3+ (exhausted, ∼18%), and PD-1−LAG3− (resting, ∼24%) intratumoral CD8+ cell subsets by fluorescence-activated cell sorting (FACS). (G) Gating strategy for intratumoral CD4+ T-cell subsets obtained from FL TIL samples to allow for the identification of CXCR5+ICOS+CD4+ TFH cells, and CD25HICD127LOCXCR5−CD4+ TREG and CD4+ non-TFH/TREG subsets within the CXCR5−ICOS− population by FACS. (H) Intratumoral CD8+ (n = 21) and CD8+ cell-subset–specific (n = 14) TCR repertoire clonality, as determined by Simpson’s clonality metric, in patients with a low TMTV (n = 10 for CD8+, and n = 8 for CD8+ subset-specific cells) and those with a high TMTV (n = 11 for CD8+, and n = 6 for CD8+ subset-specific cells). A median TMTV cutoff threshold (268 cm3) was used to distinguish a low from a high TMTV (by the 41% SUVmax method). (I) TCR repertoire clonality in patients with a low TMTV (n = 10) and patients with a high TMTV (n = 11) within the sorted intratumoral CD4+ cell subsets. The Wilcoxon rank-sum test was used for all analyses.
Analyses of the biologic determinants of TMTV in FL. (A) TMTV (in cubic centimeters), determined by 41% SUVmax, in patients with T-cellLO or T-cellRICH infiltrate in the nodes. T-cell infiltrative states were measured by calculating a standardized CD4 and CD8A gene z-score for each sample by multiplex gene hybridization. T-cellLO: quartiles 1-3; n = 34. T-cellRICH: quartile 4; n = 11. (B) TMTV, determined by SUV ≥2.5, in patients with T-cellLO and T-cellRICH tumors. (C) TLG (in grams), in patients with a T-cellLO or T-cellRICH tumor infiltrate. (D) TMTV in patients with a low (FL B cellsLO; n = 27) or high (FL B cellsRICH, n = 27) intratumoral FL B-cell infiltrate. FL B-cell infiltration was quantified by a median cutoff for the percentage of light-chain–restricted CD19+ FL B cells (≤60%), by using flow cytometric quantification of tumor lymphocytes in 54 fresh tissue samples. TMTV was determined by the 41% SUVmax method. (E) TMTV in patients with a low Ki67 expression (<20%; n = 23), and high Ki67 expression (≥20%; n = 10). Ki67 expression was assessed by immunohistochemistry, and a 20% cutoff threshold was chosen, as previously published.25 (F) Gating strategy for CD8+ T-cell subsets obtained from cryopreserved FL TIL samples to allow for the identification of PD-1+LAG3− (activated, ∼58% CD8+ cells), PD-1+LAG3+ (exhausted, ∼18%), and PD-1−LAG3− (resting, ∼24%) intratumoral CD8+ cell subsets by fluorescence-activated cell sorting (FACS). (G) Gating strategy for intratumoral CD4+ T-cell subsets obtained from FL TIL samples to allow for the identification of CXCR5+ICOS+CD4+ TFH cells, and CD25HICD127LOCXCR5−CD4+ TREG and CD4+ non-TFH/TREG subsets within the CXCR5−ICOS− population by FACS. (H) Intratumoral CD8+ (n = 21) and CD8+ cell-subset–specific (n = 14) TCR repertoire clonality, as determined by Simpson’s clonality metric, in patients with a low TMTV (n = 10 for CD8+, and n = 8 for CD8+ subset-specific cells) and those with a high TMTV (n = 11 for CD8+, and n = 6 for CD8+ subset-specific cells). A median TMTV cutoff threshold (268 cm3) was used to distinguish a low from a high TMTV (by the 41% SUVmax method). (I) TCR repertoire clonality in patients with a low TMTV (n = 10) and patients with a high TMTV (n = 11) within the sorted intratumoral CD4+ cell subsets. The Wilcoxon rank-sum test was used for all analyses.
T cells proliferate in response to antigenic stimulation into clonally expanded populations.21 Therefore, glucose metabolism may differ because of the degree of clonal expansions within T-cell compartments, reflected in differential TMTV. There are currently no data on the relationship between T-cell clonality in specific T-cell subsets and TMTV in FL. In 21 FL TILs, sorted into CD8+ T-cell (Figure 1F), TFH cell, regulatory T-cell (TREG), and non-TFH/TREG CD4+ T-cell (Figure 1G) subsets, TCR sequencing showed that large T-cell clones predominantly resided in the CD8+ T-cell population (mean clonality index [CIx], 0.067; ∼33% of all T cells). T-cell clonality was intermediate in TFH cells (CIx, 0.029; ∼30% of all T cells), low in TREG (CIx, 0.022; ∼7%), and lowest in non-TFH/TREG cells (CIx, 0.013; ∼31%). Importantly, there was modest enrichment of expanded TFH and CD8+ T-cell clones in low TMTV states (Figure 1H-I). Further interrogation of the intratumoral CD8+ T-cell population suggested that the clonal expansions were primarily driven by activated, rather than exhausted or resting, CD8+ T-cell subsets (Figure 1H). These findings require validation in larger, independent cohorts.
To evaluate the relative contribution of intratumoral B and T cells to TMTV, 2-NBDG was used to determined cellular glucose uptake in TILs (Figure 2A). The CD8+ and CD4+ T cells had significantly higher glucose uptake than did the CD19+ B cells (Figure 2B). However, given that CD19+ B cells contribute approximately two-thirds of the total lymphocyte population, it was the B cells that contributed the most to overall glucose uptake (Figure 2C). This further supports our initial finding that TMTV is reflective of the burden of the malignant population. Notably, cellular metabolism of TILs may be altered by cryopreservation and subsequent thawing. Experiments in fresh TILs are needed to confirm our findings.
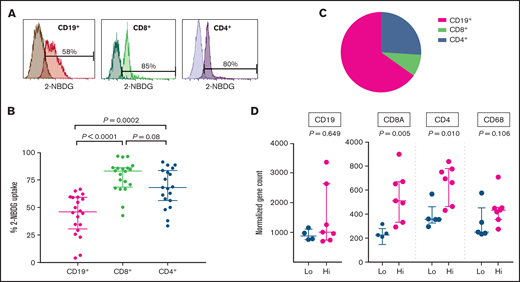
Assessment of cellular glucose uptake within intratumoral lymphocyte subsets and determinants of SUVlesional. (A) Representative 2-NBDG uptake of intratumoral CD19+, CD8+, and CD4+ cells, by flow cytometry. 2-NBDG, a fluorescently tagged FDG analogue, was used to determine cellular glucose uptake. Darker shades represent negative controls. There was a strong correlation between intratumoral CD19+ cells and light-chain–restricted monoclonal CD19+ FL tumor cells (Spearman r = 0.97; P < .0001), and hence intratumoral CD19+ cells were representative of FL B cells. (B) Combined results from 20 FL TIL samples of 2-NBDG uptake within intratumoral CD19+, CD8+, and CD4+ cells. (C) Percentage lymphocyte contribution to overall glucose uptake after normalizing for the fraction of CD19+, CD8+, and CD4+ live cells within each of the FL TILs. Average live cell infiltration: CD19+ cells, ∼64%; CD8+ cells, ∼4%; and CD4+ cells, ∼18%. (D) Twelve patients with prebiopsy FDG-PET scans had SUVmax obtained from their subsequently excised lymph node (SUVlesional). SUVlesional values were categorized into a low and high state using a mean cutoff threshold (mean SUVlesional, 6.5). Lymphocyte (CD19, CD8A, and CD4) and macrophage (CD68) gene infiltration was assessed within subsequently excised lymph node tissue samples by multiplex gene hybridization. Gene counts are reported according to the prebiopsy SUVlesional state. The Wilcoxon rank-sum test was used for all analyses.
Assessment of cellular glucose uptake within intratumoral lymphocyte subsets and determinants of SUVlesional. (A) Representative 2-NBDG uptake of intratumoral CD19+, CD8+, and CD4+ cells, by flow cytometry. 2-NBDG, a fluorescently tagged FDG analogue, was used to determine cellular glucose uptake. Darker shades represent negative controls. There was a strong correlation between intratumoral CD19+ cells and light-chain–restricted monoclonal CD19+ FL tumor cells (Spearman r = 0.97; P < .0001), and hence intratumoral CD19+ cells were representative of FL B cells. (B) Combined results from 20 FL TIL samples of 2-NBDG uptake within intratumoral CD19+, CD8+, and CD4+ cells. (C) Percentage lymphocyte contribution to overall glucose uptake after normalizing for the fraction of CD19+, CD8+, and CD4+ live cells within each of the FL TILs. Average live cell infiltration: CD19+ cells, ∼64%; CD8+ cells, ∼4%; and CD4+ cells, ∼18%. (D) Twelve patients with prebiopsy FDG-PET scans had SUVmax obtained from their subsequently excised lymph node (SUVlesional). SUVlesional values were categorized into a low and high state using a mean cutoff threshold (mean SUVlesional, 6.5). Lymphocyte (CD19, CD8A, and CD4) and macrophage (CD68) gene infiltration was assessed within subsequently excised lymph node tissue samples by multiplex gene hybridization. Gene counts are reported according to the prebiopsy SUVlesional state. The Wilcoxon rank-sum test was used for all analyses.
Finally, we assessed SUVmax. TMTV is a volumetric assessment, whereas SUVmax is a measure of highest FDG avidity. Therefore, the contribution of the TME to SUVmax may differ from that of TMTV. To accurately assess the difference, we identified a subset of patients with FDG-PET imaging before their diagnostic FL biopsy, from which we obtained SUVlesional (ie, SUVmax within the subsequently excised node) values. After excisional biopsy, we assessed immune gene infiltration by multiplex gene hybridization and cellular glucose uptake and compared the results with the paired SUVlesional value. Those with high SUVlesional values had significantly higher CD4 and CD8A, but not CD19 gene expression (Figure 2D). Unsurprisingly (as macrophages make up only a small percentage of the TME),12 there was no association with CD68. There was a trend toward a positive correlation between CD4+, but not CD8+ or CD19+, cellular glucose uptake and SUVlesional (supplemental Table 1). These results demonstrate that intratumoral T cells play an important role in SUVmax of individual FL lesions. Intratumoral T-cell spatial heterogeneity, with TFH cells particularly pronounced, is an established feature of FL22,23 and may influence SUV variability between lesions to contribute to the inconsistent prognostic efficacy of SUVmax. It may also influence the potential inability of pretherapy SUVmax to predict subsequent histological transformation.24
In conclusion, our study suggests that intratumoral T cells differentially influence pretherapy FDG-PET parameters and can affect the predictive utility of FDG-PET in patients with FL who are treated with different chemoimmunotherapy regimens that vary in the extent of T-cell depletion that they induce. How chemotherapy-free immunomodulatory and/or checkpoint blockade therapies influence glucose-uptake in intratumoral T cells to affect interim and end-of-therapy FDG-PET parameters in FL is another avenue to be explored.
Acknowledgments
The visual abstract was created with Biorender.com. No writing assistance was used in the production of the manuscript.
This work was supported by a Haematology Society of Australia and New Zealand and Leukaemia Foundation scholarship (K.N.); the Leukaemia Foundation, the Mater Foundation, and the National Health and Medical Research Council (M.K.G.); and the Translational Research Institute FACSymphony A5 Reagent Support Fund which supported panel development. The Translational Research Institute is supported by the Australian Government.
Authorship
Contribution: K.N., S.-C.L., and P.L. contributed to the study design, performed the experiments and collected and analyzed the data; M.B.S., J.G., L.M.d.L., D.S., M.S., H.T., J.W.D.T., S.-J.H., A.H., and D.C. performed experiments and contributed to data interpretation; S.J., R.J.B., and D.T. provided patient samples, collected data and contributed to data interpretation; C.K. and J.T. contributed to data analysis and interpretation; M.K.G. designed the project and contributed to patient samples and data analysis and interpretation; and all authors were involved in writing the manuscript.
Conflict-of-interest disclosure: D.T. has received research funding, honoraria and has held an advisory board membership from Amgen; honoraria and speakers bureau and advisory board membership for Janssen; honoraria for Novartis; honoraria, speakers’ bureau, and advisory board membership for Roche; and honoraria for Takeda. M.K.G. has received honoraria and travel support from Roche and honoraria from Janssen, Merck, Amgen, and Gilead. The remaining authors declare no competing financial interests.
Correspondence: Karthik Nath, Level 7, Translational Research Institute, Brisbane, QLD 4102, Australia; e-mail: karthik.nath@uqconnect.edu.au; and Maher K. Gandhi, Level 7, Translational Research Institute, Brisbane, QLD 4102, Australia; e-mail: maher.gandhi@mater.uq.edu.au.

