Key Points
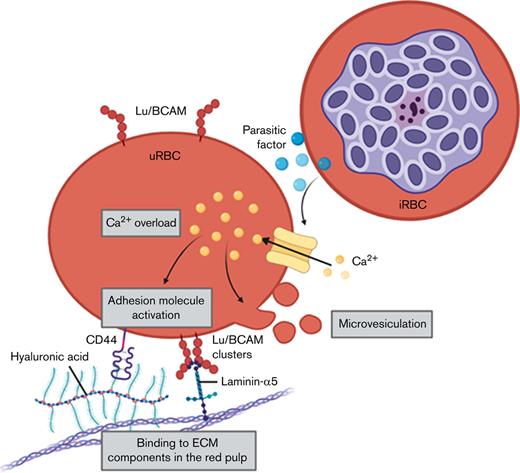
High intracellular calcium levels in uRBCs are associated with Lu/BCAM activation, which mediates its adherence to laminin-α5.
Laminin-α5–adherent uRBCs are sensitive to hemolysis and phagocytic clearance.
Abstract
Severe malarial anemia (SMA) is the main cause of malaria-associated infant mortality in malaria endemic countries. One major factor that contributes to SMA is the accumulation of uninfected red blood cells (uRBCs) in the spleen. We report the activation of adhesion molecules Lutheran/basal cell adhesion molecule (Lu/BCAM) and CD44 on uRBCs from Plasmodium falciparum in vitro cultures and patients with malaria that mediates adherence to the splenic extracellular matrix (ECM) components laminin-α5 and hyaluronic acid (HA), respectively. This tight ECM-adhesion molecule interaction was associated with elevated intracellular Ca2+ levels, increased shedding of microvesicles, and Lu/BCAM clustering on altered uRBCs. Moreover, we observed that a soluble parasite-derived factor promoted the adhesive phenotype of uRBCs, as the incubation of RBCs with filtered malaria-conditioned medium reproduced the same adhesive effect in malaria culture–derived uRBCs. Eventually, Lu/BCAM and CD44 activation facilitate the adherence to ECM components of the red pulp, resulting in the enhanced splenic retention of uRBCs. Our results suggest a novel adhesion molecule–dependent mechanism that augments malaria-induced anemia.
Introduction
Despite the declining trend in malaria cases, malaria remains a global health burden responsible for ∼0.5 million deaths worldwide. Children under the age of 5 are the most vulnerable group and account for 60% of all malaria-associated deaths.1 The high malaria mortality rates among infants can be attributed to severe malarial anemia (SMA),2 which is caused by impaired erythropoiesis,3-9 co-infections,10-13 and malnutrition.10,14 In addition, the degradation of uninfected red blood cells (uRBCs) plays a crucial role in SMA, as 90% of RBC loss can be ascribed to the loss of uRBCs.15-17 In fact, according to the mathematical model calculated by Jakeman et al,18 a mean of 8.5 uRBCs are destroyed per infected red blood cell (iRBC), which further emphasizes the implications of enhanced uRBC clearance in disease severity. Thus, dissecting the molecular mechanism that drives the accumulation and destruction of uRBCs in the spleen is key to fully unraveling the pathophysiology caused by SMA.
The main function of the human spleen in malaria, according to common understanding, is to filter senescent and damaged RBCs from the circulation19; however, its role, in the light of recent knowledge, appears to be even more complex than first thought, with regard to its capacity to harbor viable iRBCs associated with chronic malaria.20 Laminin-α5 and hyaluronic acid (HA) are extracellular matrix (ECM) components enriched in the splenic red pulp21-24 that can interact with Lu/BCAM25 and CD4426 on RBCs, respectively. Both RBC adhesion molecules are activated throughout RBC ageing, which is associated with the gradual loss of membrane sialic acid.26,27 Moreover, constitutive Lu/BCAM activation has been reported in sickle cell disease,28 hereditary spherocytosis,29 and polycythemia vera,30 implying a pivotal role for Lu/BCAM in the clearance of pathologically defective RBCs.31 We report the Ca2+-induced activation of adhesion molecules on uRBCs from malaria cultures and patients with malaria, thereby facilitating the increased interaction of the cells with ECM components highly expressed in the spleen and potentially leading to their hemolysis and clearance by splenic macrophages. A similar process was recently described for senescent RBCs.32 Thus, our results suggest a novel mechanism for the enhanced splenic retention of uRBCs that eventually contributes to severe anemia in malaria.
Materials and methods
Plasmodium falciparum in vitro culture
We cultured Plasmodium falciparum strain NF54 according to Trager and Jensen33 with RPMI 1640 medium+HEPES (N-2-hydroxyethylpiperazine-N′-2-ethanesulfonic acid)+l-glutamine (Gibco, Waltham, MA) and supplemented with 25 mM HEPES, 15 μM hypoxanthine, 2 mg/mL glucose, 7.5% NaHCO3, 2 μg/mL gentamicin (all from Sigma-Aldrich, St Louis, MO), and 10% heat-inactivated human serum and a gas mix of 5% CO2, 2% O2, and 93% N2.
Conditioned-medium samples
Heparinized venous blood was obtained from healthy adult volunteers from The Netherlands who provided informed consent. Blood studies were approved by the Medical Ethics Committee of Sanquin Research and performed in accordance with the 2018 Declaration of Helsinki. RBCs were isolated by centrifugation of whole blood at 1000 rpm for 5 minutes and washed in RPMI 1640 medium+l-glutamine. Samples were then incubated overnight at 37°C in conditioned medium obtained from malaria cultures, which were supernatant filtered through 0.2-μm pore size Whatman filters (GE Healthcare Life Sciences, Chicago, IL).
Patient samples
EDTA-treated blood (2 mL) was collected from patients with acute malaria (<5 years of age; n = 6) at the Centre de Recherches Médicales de Lambaréné (CERMEL), in a malaria endemic region in Gabon.34 Control samples were obtained from age-matched healthy individuals (n = 5) from the same area. The study was approved by the CERMEL ethics committee and was conducted in accordance with the Declaration of Helsinki.
Sample preparation for flow cytometry and flow assay
RBC flow assay
RBC adhesion to laminin-α5 and HA was assessed by applying 0.5 μg recombinant laminin-511 (BioLamina, Sundyberg, Sweden) or 2.5 mg/mL HA (Sigma-Aldrich) diluted in HEPES buffer (132 mM NaCl, 20 mM HEPES, 6 mM KCl, 1 mM MgSO4, 1.2 mM K2HPO4, and 1 mM Ca2+) through passive absorption on uncoated Ibidi μ-slides0.4 or ibiTreat μ-slides0.4 in flow chambers (Ibidi, Gräfelfing, Germany). Adhesion and rolling frequency were visualized by EVOS microscopy (ThermoFisher, Waltham, MA) and LSM 510 META/TIRF (Carl Zeiss Microimaging, Jena, Germany) and analyzed by Vision4D (Arivis, Rostock, Germany) at a flow rate of 0.2 dyn/cm. The blocking of CD44 and HA interaction was mediated via 18 μg/mL anti-CD44 antibody (Invitrogen, Carlsbad, CA). Anti-hLu/BCAM (2 μg/mL) blocked Lu/BCAM (R&D Systems, Minneapolis, MN) and laminin-α5 interaction. CM RBCs were treated with 25 μM BAPTA-AM (Sigma-Aldrich) overnight, to test the effect of Ca2+ chelation on laminin-α5 adherence to uRBCs. Heat inactivation of the malaria-conditioned medium at 56°C for 1 hour was performed to further characterize the altering of the adhesion capacity of the uRBCs by the parasite-derived soluble factor.
Time course of Ca2+ permeability in RBCs and generation of uRBC ghosts
Fluo-4-stained RBCs (0.5 × 10⁶; 1 μM; Invitrogen) were added to microscopic chambers (Nunc Laboratory-Tek Chambered Coverglass; ThermoFisher Scientific, Waltham, MA) coated with 0.5 μg recombinant laminin-511 (BioLamina, Sundyberg, Sweden) for 2 hours at 37°C. IRBCs were stained with 1 μg/mL Hoechst (Sigma, Spruce). Ionomycin (Sigma-Aldrich) treated RBCs (5 μM for 30 minutes at 37°C) were used as a positive control for increased intracellular Ca2+ levels. Ca2+ permeability was visualized with Observer Z1 (Zeiss, Oberkochen, Germany) taking frames of a defined area in the microscopic chamber every 5 minutes for 21 hours. Images were analyzed by ZEN blue image analysis software (Zeiss) to determine mean fluorescence intensities for Fluo-4 and for the quantification of translucent spherical Hoechst-negative uRBC ghosts.
Flow cytometry, Imagestream, antibodies, and reagents
Flow cytometric analysis was performed on an LSRII+HTS cytometer, and data were analyzed by FACSDiva software (BD Biosciences, Franklin Lakes, NJ). RBC membrane adhesion proteins were visualized on an Amnis ImageStream Imaging Flow Cytometer, and the results were analyzed with IDEAS 6.3 image analysis software (Luminex. Austin, TX). Adhesion molecule expression was measured with 2 μg/mL anti-hLu/BCAM (R&D Systems) and anti-CD44 FITC (1:5; Diaclone, Besançon, France). Mouse isotype control IgG1 (Alexa Fluor 488 conjugated; 1:100) was obtained from Invitrogen, and goat isotype control (20 μg/mL) was purchased from R&D Systems). Conjugated secondary antibody rabbit anti-goat (20 μg/mL Alexa Fluor 488) was purchased from Invitrogen. RBCs were stained with 1 μM Fluo-4 (Invitrogen) to assess intracellular Ca2+ levels. Infected RBCs were identified by 1 μg/mL of the DNA dye Hoechst (Sigma-Aldrich).
Phagocytosis of ghosts
To induce formation of ghost RBCs, 0.5 × 10⁶ RBCs were incubated with magnetic cell sorting–enriched trophozoites overnight at 37°C on laminin-511–coated (0.5 μg; BioLamina, Sundyberg, Sweden) microscopic chambers (Nunc Laboratory-Tek Chambered Coverglass; ThermoFisher Scientific). uRBCs were labeled with Celltrace carboxyfluorescein diacetate succinimidyl ester (ThermoFisher Scientific), and iRBCs were stained with 1 μg/mL Hoechst (Sigma, Spruce). Monocytes were isolated from peripheral blood mononuclear cells (PBMCs) from healthy donors by density gradient centrifugation with Percoll (Pharmacia). Monocytes were isolated from PBMCs by using CD14 MicroBeads (Miltenyi Biotec, Bergisch Gladbach, Germany) magnetic cell sorting labeling technology. CD14+ monocytes and 10% active normal human serum (AB+, pooled from 5 healthy donors) was then added to the overnight-incubated RBCs. Phagocytosis was visualized with Observer Z1 (Zeiss) taking frames every 0.5 minutes of a defined area on the microscopic chamber under a ×40 oil objective for 1 hour.
Statistical analysis
Data were analyzed with Prism 8 for Windows (GraphPad Software, La Jolla, CA). Measurements are presented as the standard error of mean (SEM) of each variable of at least 3 independent experiments. Differences in median values between experimental groups were assessed by Wilcoxon matched-pairs signed-rank test or Mann-Whitney test. Correlation between 2 variables was analyzed by Pearson’s correlation coefficient.
Results
Activation of uRBC adhesion molecules
The impaired uRBC rheology caused by the deposition of parasite-derived antigens on uRBCs,37-41 malaria heme products,42 and malaria-induced variations of metabolic substrates43,44 has been linked to splenic RBC sequestration. Moreover, Lu/BCAM activation of senescent, stored, and dehydrated RBCs has been associated with RBC turnover,26,27,45,46 but not studied in the context of SMA.
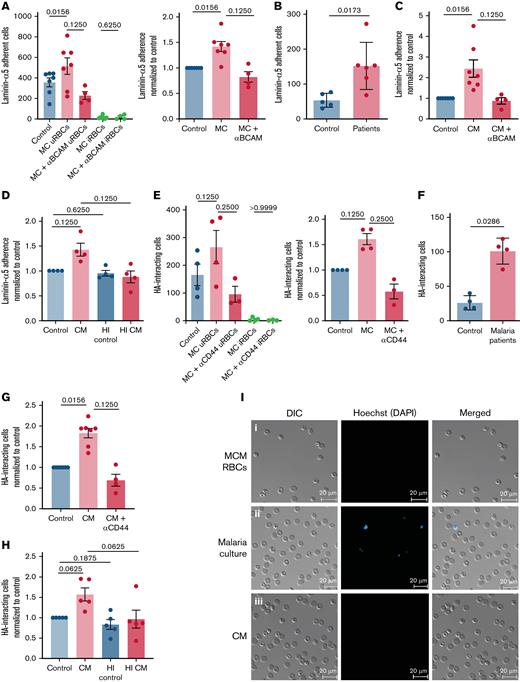
By testing the adherence of uRBCs from a P. falciparum (laboratory strain NF54) in vitro culture to the splenic ECM component laminin-α5 under flow conditions, we wanted to assess the adherence capacity of malaria-altered uRBCs. We observed an increased overall binding of uRBCs from the malaria cultures in contrast to RBCs incubated in the culture medium (Figure 1A,I). This interaction was mediated via Lu/BCAM on RBCs, as Lu/BCAM blocking antibodies abrogated the laminin-α5 interaction (Figure 1A; supplemental Figure 1A). Consistent with the in vitro observations, uRBCs from samples from patients with malaria showed increased laminin-α5 binding when compared with healthy control samples (Figure 1B; supplemental Figure 1B). By incubating RBCs in the malaria culture–conditioned medium, we found that a direct interaction between iRBCs and uRBCs was not necessary for the induction of adherence to laminin-α5, indicating that a soluble parasite-derived factor contributed to this Lu/BCAM dependent adhesive phenotype (Figure 1C,I). Interestingly, this factor appeared to be heat labile, given that incubating RBCs with 56°C preheated conditioned medium reduced its adhesive capacity to control levels (Figure 1D; supplemental Figure 1C). To evaluate the interaction of uRBCs with another ECM constituent highly expressed in the splenic red pulp,21 we assessed the rolling and tethering of malaria culture–derived uRBCs on HA-coated μ-slides under flow. An increased CD44-mediated interaction to HA was noted in uRBCs from malaria culture (Figure 1E; supplemental Figure 1D) and patients with malaria (Figure 1F), as well as, in RBCs incubated in conditioned medium (Figure 1G; supplemental Figure 1E). This effect was reversed when the conditioned medium was heat treated (Figure 1H; supplemental Figure 1F), thus implying that an iRBC-derived soluble heat-labile factor induces the in vivo and in vitro adhesive phenotype of uRBCs.
Adhesion molecule activation observed in malaria-altered uRBCs. (A) Laminin-α5 adherence was assessed by passing RBCs incubated in culture medium (control) and P. falciparum in vitro cultures (MC) over laminin-α5–coated Ibidi μ-slides. Lu/BCAM-mediated adhesion was tested by Lu/BCAM blocking antibody (MC+Lu/BCAM). Mean ± standard error of the mean (SEM); n = 4-7 (left). Cells were stained with the DNA dye Hoechst to distinguish iRBCs from uRBCs. Laminin-α5 adhesion frequency of MC-derived uRBCs was normalized to control RBCs (right). (B) RBCs from age-matched controls (n = 5) and patients with malaria (n = 6) were stained with Hoechst for iRBC detection and tested for laminin-α5 adherence. Mean ± standard deviation (SD); Mann-Whitney test. (C) RBCs exposed to malaria-conditioned medium (CM) overnight were assessed for Lu/BCAM-mediated laminin-α5 adherence. Mean ± SEM; n = 4-7. (D) RBCs incubated with heat-treated (1 hour, 56°C) (HI CM) were passed over laminin-α5 coated μ-slides, to determine the heat stability of the laminin adhesion–inducing factor in CM. Mean ± SEM, n = 4. (E) Quantification of HA interaction was performed by passing RBCs derived from control and MC conditions on HA-coated μ-slides. CD44-mediated interaction was assessed by CD44 blocking antibody. The frequency of HA interaction of uRBCs was normalized to control RBCs. iRBCs were stained with Hoechst. Mean ± SEM, n = 3-4. (F) Frequency of HA interaction of uRBCs in patients with malaria was compared with those from age-matched controls. Samples were stained with Hoechst for iRBC-uRBC distinction. Mean ± SD; n = 4; Mann-Whitney test. (G) CD44 mediated HA interaction of CM-exposed RBCs was assessed by passing CM RBCs and CD44-blocked CM RBCs over HA-coated μ-slides. HA-rolling of treated cells were normalized to control RBCs. Mean ± SEM; n = 4-7. (H) Heat instability of the factor that mediates HA interaction was tested under flow conditions with RBCs incubated with HI CM. Mean ± SEM, n = 5. (I) Microscopy images of laminin-α5 adherent control RBCs (i), malaria culture RBCs (ii), and CM-exposed RBCs (iii). Hoechst staining (blue) indicates iRBCs. Images were taken under a ×40 oil-immersion objective. Bars represent 20 μm. Wilcoxon matched-pairs signed-rank test, unless stated otherwise. The error bar denotes SEM or SD.
Adhesion molecule activation observed in malaria-altered uRBCs. (A) Laminin-α5 adherence was assessed by passing RBCs incubated in culture medium (control) and P. falciparum in vitro cultures (MC) over laminin-α5–coated Ibidi μ-slides. Lu/BCAM-mediated adhesion was tested by Lu/BCAM blocking antibody (MC+Lu/BCAM). Mean ± standard error of the mean (SEM); n = 4-7 (left). Cells were stained with the DNA dye Hoechst to distinguish iRBCs from uRBCs. Laminin-α5 adhesion frequency of MC-derived uRBCs was normalized to control RBCs (right). (B) RBCs from age-matched controls (n = 5) and patients with malaria (n = 6) were stained with Hoechst for iRBC detection and tested for laminin-α5 adherence. Mean ± standard deviation (SD); Mann-Whitney test. (C) RBCs exposed to malaria-conditioned medium (CM) overnight were assessed for Lu/BCAM-mediated laminin-α5 adherence. Mean ± SEM; n = 4-7. (D) RBCs incubated with heat-treated (1 hour, 56°C) (HI CM) were passed over laminin-α5 coated μ-slides, to determine the heat stability of the laminin adhesion–inducing factor in CM. Mean ± SEM, n = 4. (E) Quantification of HA interaction was performed by passing RBCs derived from control and MC conditions on HA-coated μ-slides. CD44-mediated interaction was assessed by CD44 blocking antibody. The frequency of HA interaction of uRBCs was normalized to control RBCs. iRBCs were stained with Hoechst. Mean ± SEM, n = 3-4. (F) Frequency of HA interaction of uRBCs in patients with malaria was compared with those from age-matched controls. Samples were stained with Hoechst for iRBC-uRBC distinction. Mean ± SD; n = 4; Mann-Whitney test. (G) CD44 mediated HA interaction of CM-exposed RBCs was assessed by passing CM RBCs and CD44-blocked CM RBCs over HA-coated μ-slides. HA-rolling of treated cells were normalized to control RBCs. Mean ± SEM; n = 4-7. (H) Heat instability of the factor that mediates HA interaction was tested under flow conditions with RBCs incubated with HI CM. Mean ± SEM, n = 5. (I) Microscopy images of laminin-α5 adherent control RBCs (i), malaria culture RBCs (ii), and CM-exposed RBCs (iii). Hoechst staining (blue) indicates iRBCs. Images were taken under a ×40 oil-immersion objective. Bars represent 20 μm. Wilcoxon matched-pairs signed-rank test, unless stated otherwise. The error bar denotes SEM or SD.
Ca2+-associated hemolysis of adherent uRBCs
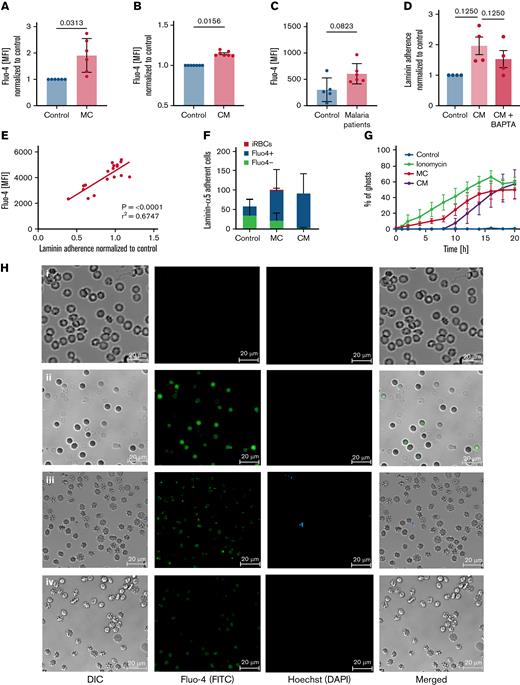
One commonality among senescent and damaged RBCs is their increased permeability for Ca2+, which has been related to splenic clearance.47,48 Intracellular Ca2+ overload triggers several RBC degradation signals, including the regulation of structural integrity and cytoskeletal stability of RBCs.49-52 Recent results from our laboratory linked intracellular Ca2+ overload with the activation of Lu/BCM and CD44.53 By using the cell-permeant Ca2+ binding dye Fluo-4, we wanted to determine intracellular Ca2+ levels in uRBCs, as the level could activate Lu/BCAM. We detected elevated intracellular Ca2+ levels in uRBCs from malaria cultures (Figure 2A), RBCs exposed to conditioned medium (Figure 2B), and in uRBCs derived from patients with malaria (Figure 2C) when compared with control samples. To confirm that intracellular Ca2+ levels are associated with the activated Lu/BCAM-laminin-α5 interaction, we added BAPTA-AM, a cell-permeant Ca2+ chelator, to conditioned medium RBCs. Upon the restriction of intracellular Ca2+ by BAPTA-AM, the binding capacity of conditioned RBCs to laminin-α5 decreased (Figure 2D), suggesting a Ca2+-dependent mechanism for the adhesion of malaria-altered uRBCs to splenic ECM components.
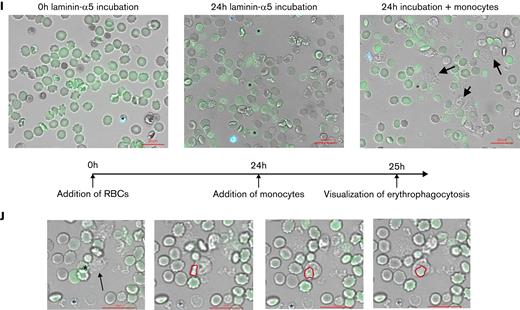
Laminin-α5–adherent uRBCs are characterized by elevated intracellular Ca2+levels. (A) Intracellular Ca2+ levels of malaria culture–derived uRBCs (MC) normalized to control RBCs (control). Mean ± standard error of the mean (SEM); n = 6. (B) Intracellular Ca2+ levels of RBCs incubated in malaria conditioned medium (CM) normalized to control RBCs (control). Mean ± SEM; n = 7. (C) Intracellular Ca2+ levels of uRBCs derived from patients with malaria and age-matched control. Mean ± standard deviation (SD); n = 5-6; Mann-Whitney test. (D) Normalized laminin-α5 adherence of RBCs exposed to CM, with or without BAPTA treatment. Mean ± SEM, n = 4. (E) Mean fluorescence intensities (MFI) of Fluo-4 from malaria culture uRBCs (y-axis) were plotted against laminin-α5 adherence normalized to that of control RBCs (x-axis; n = 18). (F) Fluo-4–stained RBCs from control-, MC-, and CM-incubated RBCs were passed over laminin-α5–coated Ibidi μ-slides at a flow rate of 0.2 dyn/cm. Laminin-α5–bound RBCs were quantified and analyzed for Fluo-4 positivity by Arivis Vision 4D image analysis software. iRBCs were assessed by Hoechst staining. Mean ± SEM, n = 3-6. (G) uRBC ghosts were identified as spherical translucent Hoechst-negative cells and quantified over the course of 20 hours. Mean ± SEM; n = 4. (H) Ca2+ permeability of control RBCs (i), ionomycin-treated RBCs (ii), malaria cultured RBCs (iii), and RBCs incubated in malaria CM (iv) after 8 hours of experimental measurement. RBCs were stained for intracellular Ca2+ by Fluo-4 (green) and Hoechst (blue) for iRBC detection. (I) Representative microscopy images of RBCs incubated with iRBCs on laminin-α5–coated microscopic chambers at 0 hours of laminin-α5 incubation. Monocytes (arrows) were added after a 24-hour laminin-α5 incubation to carboxyfluorescein diacetate succinimidyl ester–stained RBCs (green), hemolyzed uRBCs (∗) and Hoechst-stained iRBCs (blue). (J) Phagocytosis of hemolyzed uRBCs (∗) by unstained monocytes (arrow) when co-incubated with iRBCs on laminin-α5–coated microscopic chambers. Red outlines show uRBC uptake by monocytes. Images in panels H, I, and J were obtained under a ×40 oil-immersion objective. Bars represent 20 μm. Wilcoxon matched-pairs signed-rank test, unless stated otherwise. Error bars denote SEM or SD.
Laminin-α5–adherent uRBCs are characterized by elevated intracellular Ca2+levels. (A) Intracellular Ca2+ levels of malaria culture–derived uRBCs (MC) normalized to control RBCs (control). Mean ± standard error of the mean (SEM); n = 6. (B) Intracellular Ca2+ levels of RBCs incubated in malaria conditioned medium (CM) normalized to control RBCs (control). Mean ± SEM; n = 7. (C) Intracellular Ca2+ levels of uRBCs derived from patients with malaria and age-matched control. Mean ± standard deviation (SD); n = 5-6; Mann-Whitney test. (D) Normalized laminin-α5 adherence of RBCs exposed to CM, with or without BAPTA treatment. Mean ± SEM, n = 4. (E) Mean fluorescence intensities (MFI) of Fluo-4 from malaria culture uRBCs (y-axis) were plotted against laminin-α5 adherence normalized to that of control RBCs (x-axis; n = 18). (F) Fluo-4–stained RBCs from control-, MC-, and CM-incubated RBCs were passed over laminin-α5–coated Ibidi μ-slides at a flow rate of 0.2 dyn/cm. Laminin-α5–bound RBCs were quantified and analyzed for Fluo-4 positivity by Arivis Vision 4D image analysis software. iRBCs were assessed by Hoechst staining. Mean ± SEM, n = 3-6. (G) uRBC ghosts were identified as spherical translucent Hoechst-negative cells and quantified over the course of 20 hours. Mean ± SEM; n = 4. (H) Ca2+ permeability of control RBCs (i), ionomycin-treated RBCs (ii), malaria cultured RBCs (iii), and RBCs incubated in malaria CM (iv) after 8 hours of experimental measurement. RBCs were stained for intracellular Ca2+ by Fluo-4 (green) and Hoechst (blue) for iRBC detection. (I) Representative microscopy images of RBCs incubated with iRBCs on laminin-α5–coated microscopic chambers at 0 hours of laminin-α5 incubation. Monocytes (arrows) were added after a 24-hour laminin-α5 incubation to carboxyfluorescein diacetate succinimidyl ester–stained RBCs (green), hemolyzed uRBCs (∗) and Hoechst-stained iRBCs (blue). (J) Phagocytosis of hemolyzed uRBCs (∗) by unstained monocytes (arrow) when co-incubated with iRBCs on laminin-α5–coated microscopic chambers. Red outlines show uRBC uptake by monocytes. Images in panels H, I, and J were obtained under a ×40 oil-immersion objective. Bars represent 20 μm. Wilcoxon matched-pairs signed-rank test, unless stated otherwise. Error bars denote SEM or SD.
Furthermore, elevated intracellular Ca2+ levels correlated positively with an increasing laminin-α5 adherence (Figure 2E), supporting the role of Ca2+ in splenic uRBC retention. In fact, most of the laminin-α5–adherent RBCs were positive for the Ca2+-binding dye (Figure 2F). We furthermore detected a gradual increase in Ca2+ permeability in samples exposed to iRBCs and conditioned medium (Figure 2H; supplemental Figure 2D). As reported by Klei et al,32 we observed the Ca2+ positive and laminin-α5–bound cells to become echinocytic (Figure 2H) and eventually form ghosts by rupturing (Figure 2G; supplementary Video 1). This process appears to be more rapid and augmented in uRBCs incubated with parasites in contrast to control RBCs (supplementary Videos 1 and 2). To investigate whether the parasite-induced uRBC ghosts would be efficiently cleared by phagocytes, we incubated RBCs with iRBCs overnight on laminin-α5–coated microscopic chambers to induce the formation of ghosts. When adding monocytes to this system after the overnight ghost induction, we noted an augmented ingestion of ghosts in contrast to intact uRBCs (Figure 2I-J). Collectively, our results suggest that parasite-mediated Ca2+ accumulation enhances the Lu/BCAM-laminin-α5 interaction by altering RBC morphology, which exaggerates hemolysis and links malaria-induced Ca2+ permeability in uRBCs to their splenic accumulation and ultimate degradation.
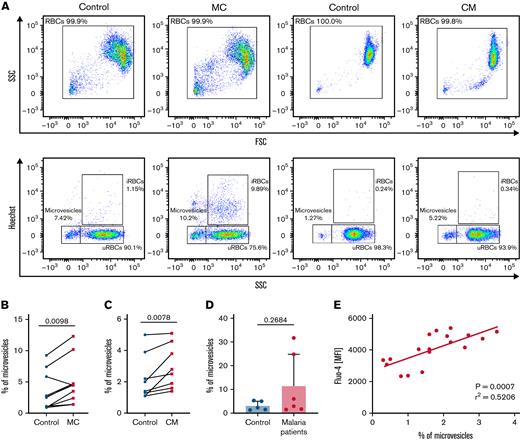
RBC vesiculation has been associated with the accumulation of intracellular Ca2+ by the activation of calpains.54 As a consequence of calpain activation, cytoskeletal remodeling occurs,55 mediating membrane blebbing56 and subsequently, cell shrinkage.45,57 Therefore, determining the shedding of microvesicles by parasite-altered uRBCs could associate the previously described Ca2+ permeability and modified RBC morphology with the increased adherence to ECM components. We found an increased rate of microvesiculation in both malaria cultures and cells from conditioned medium (Figure 3A-C), compared with controls. Consistent with the in vitro data, the increased shedding of microvesicles was also detected in samples from patients with malaria (Figure 3D). Moreover, we found a significant correlation between high levels of intracellular Ca2+ and the shedding of microvesicles (Figure 3E) in uRBCs from malaria culture. These results imply that, in addition to intracellular Ca2+ accumulation, parasite-altered RBCs are further characterized by the potential impairment of RBC rheology by increased microvesiculation.
Increased vesiculation of MC uRBCs and condition medium–exposed RBCs is associated with laminin-α5 interaction. (A) Microvesicles were characterized as Hoechst-negative cells corresponding to a low side scatter (SSC) and were quantified in control, malaria culture (MC), and conditioned-medium (CM) samples. Selected fluorescence-activated cell sorting (FACS) plots are representative of 8 to 10 biological replicates. (B) Flow cytometric quantification of microvesicles in control RBCs (control) and in MC RBCs. n = 8. (C) Percentage of microvesicles in control RBCs (control) and in CM-exposed RBCs. n = 8. Wilcoxon matched-pairs signed rank test. (D) Percentage of microvesicles in samples from patients with malaria and age-matched controls. Mean ± SD; n = 5-6; Mann-Whitney test. (E) Mean florescence intensities (MFI) of Fluo-4–stained uRBCs from CM-incubated RBCs (y-axis) were plotted against the percentage of microvesicles (x-axis; n = 18); 95% confidence interval, 0.3841-0.8890.
Increased vesiculation of MC uRBCs and condition medium–exposed RBCs is associated with laminin-α5 interaction. (A) Microvesicles were characterized as Hoechst-negative cells corresponding to a low side scatter (SSC) and were quantified in control, malaria culture (MC), and conditioned-medium (CM) samples. Selected fluorescence-activated cell sorting (FACS) plots are representative of 8 to 10 biological replicates. (B) Flow cytometric quantification of microvesicles in control RBCs (control) and in MC RBCs. n = 8. (C) Percentage of microvesicles in control RBCs (control) and in CM-exposed RBCs. n = 8. Wilcoxon matched-pairs signed rank test. (D) Percentage of microvesicles in samples from patients with malaria and age-matched controls. Mean ± SD; n = 5-6; Mann-Whitney test. (E) Mean florescence intensities (MFI) of Fluo-4–stained uRBCs from CM-incubated RBCs (y-axis) were plotted against the percentage of microvesicles (x-axis; n = 18); 95% confidence interval, 0.3841-0.8890.
Ca2+-induced Lu/BCAM clustering on uRBCs
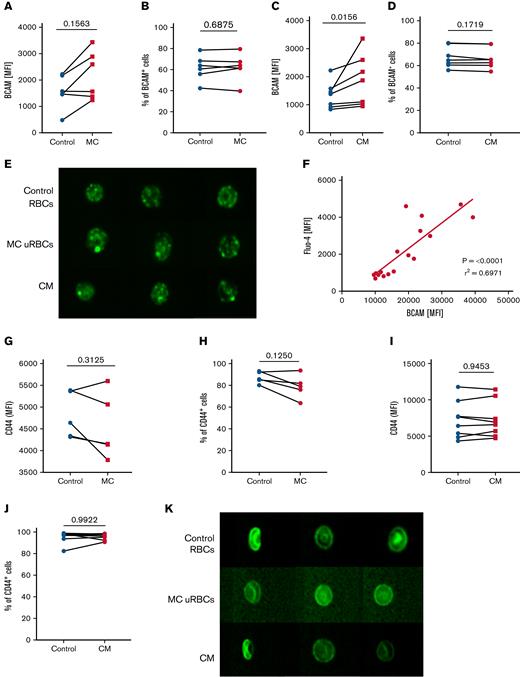
Considering that impaired rheology and membrane loss caused by vesiculation could affect the activation of adhesion molecules on uRBCs, we first wanted to determine whether the Lu/BCAM–laminin-α5 interaction is dependent on the surface levels of Lu/BCAM by comparing Lu/BCAM levels of uRBCs from malaria culture and RBCs from conditioned medium to levels in control uRBCs. In both cases, uRBCs bound more anti-BCAM antibodies than control RBCs (Figure 4A,C). However, the percentage of RBCs that express Lu/BCAM remained unaffected in the nonnucleated RBCs (Figure 4B,D), suggesting that the enhanced Lu/BCAM levels arise from an increased antibody detection possibly related to conformational changes of the Lu/BCAM protein itself. To visualize the pattern of Lu/BCAM surface expression in malaria-altered uRBCs on a single-cell level, we applied imaging flow cytometry and detected the clustering of Lu/BCAM in malaria-cultured uRBCs and RBCs exposed to conditioned medium (Figure 4E) suggesting that the strong fluorescent Lu/BCAM signal detected by flow cytometry (Figure 4A,C) derived from antibody accumulation on the Lu/BCAM clusters. Remarkably, the high levels of Lu/BCAM correlated with elevated intracellular Ca2+ levels associating the Ca2+-induced microvesiculation with the clustering of Lu/BCAM (Figure 4F).
Lu/BCAM clusters are present on malaria altered uRBCs. (A) Surface expression of Lu/BCAM on control RBCs (control) and malaria culture–derived uRBCs (MC). Data represent the mean fluorescence intensities (MFI) of control RBCs and MC uRBCs. n = 6. (B) Percentage of Lu/BCAM+ RBCs in control RBCs and MC-derived uRBCs. n = 6. (C) Surface expression of Lu/BCAM on control RBCs and RBCs exposed to CM. The data represent the MFI values of control RBCs and CM RBCs. n = 7. (D) Percentage of Lu/BCAM+ RBCs in control RBCs and CM-exposed RBCs. n = 6. (E) Imagestream analysis was performed to visualize surface expression of Lu/BCAM (green) on control RBCs, uRBCs derived from malaria culture (MC uRBCs), and RBCs exposed to CM (magnification ×60). (F) MFIs of Fluo-4–stained uRBCs from MC (y-axis) were plotted against the surface expression of Lu/BCAM (x-axis). n = 16. (G) Surface expression of CD44 on control RBCs (control) and MC-derived uRBCs. Data represent the MFIs of control RBCs and MC uRBCs. n = 5. (H) Percentage of CD44+ RBCs in control RBCs and MC-derived uRBCs. n = 5. (I) Surface expression of CD44 on control RBCs and CM RBCs. Data represent the MFIs of control RBCs and CM RBCs. n = 8. (J) Percentage of CD44+ RBCs in control RBCs and CM-exposed RBCs. n = 8. (K) Representative images of CD44 (green) stained control RBCs, uRBCs from malaria culture (MC uRBCs) and RBCs exposed to malaria CM visualized by imaging flow cytometry (magnification ×60). Wilcoxon matched-pairs signed-rank test.
Lu/BCAM clusters are present on malaria altered uRBCs. (A) Surface expression of Lu/BCAM on control RBCs (control) and malaria culture–derived uRBCs (MC). Data represent the mean fluorescence intensities (MFI) of control RBCs and MC uRBCs. n = 6. (B) Percentage of Lu/BCAM+ RBCs in control RBCs and MC-derived uRBCs. n = 6. (C) Surface expression of Lu/BCAM on control RBCs and RBCs exposed to CM. The data represent the MFI values of control RBCs and CM RBCs. n = 7. (D) Percentage of Lu/BCAM+ RBCs in control RBCs and CM-exposed RBCs. n = 6. (E) Imagestream analysis was performed to visualize surface expression of Lu/BCAM (green) on control RBCs, uRBCs derived from malaria culture (MC uRBCs), and RBCs exposed to CM (magnification ×60). (F) MFIs of Fluo-4–stained uRBCs from MC (y-axis) were plotted against the surface expression of Lu/BCAM (x-axis). n = 16. (G) Surface expression of CD44 on control RBCs (control) and MC-derived uRBCs. Data represent the MFIs of control RBCs and MC uRBCs. n = 5. (H) Percentage of CD44+ RBCs in control RBCs and MC-derived uRBCs. n = 5. (I) Surface expression of CD44 on control RBCs and CM RBCs. Data represent the MFIs of control RBCs and CM RBCs. n = 8. (J) Percentage of CD44+ RBCs in control RBCs and CM-exposed RBCs. n = 8. (K) Representative images of CD44 (green) stained control RBCs, uRBCs from malaria culture (MC uRBCs) and RBCs exposed to malaria CM visualized by imaging flow cytometry (magnification ×60). Wilcoxon matched-pairs signed-rank test.
However, neither CD44 clustering nor alterations in the CD44 epitope expression were detected in uRBCs (Figure 4H-K), implying that there is a different mechanism of CD44 activation, as described for Lu/BCAM. Based on our observations, we hypothesized that Ca2+-associated clustering of Lu/BCAM augments binding to laminin-α5, thereby, promoting splenic sequestration and destruction.
Discussion
In this study, we investigated the splenic retention of malaria-altered uRBCs by focusing on the interaction of RBC adhesion molecules with red pulp ECM components. Both ex vivo (patients with malaria) and in vitro (malaria cultures) data showed a strong association of increased Ca2+ permeability with laminin-α5 adherence, increased microvesiculation, and altered adhesion molecule surface presentation on uRBCs. All of these factors eventually facilitated the destruction of spleen-retained uRBCs, ultimately, contributing to severe anemia.
Perturbed deformability and adhesion molecule activation of senescent, stored, and dehydrated RBCs have been associated with RBC turnover.26,27,45,46 Recent results from our laboratory linked the Gardos-channel–mediated activation of Lu/BCAM and CD44 on dehydrated RBCs to their increased adherence to laminin-α5 and HA.53 Both ECM proteins are abundantly expressed in the splenic red pulp21,23,58,59 and are prone to interact with RBC ghosts, which are efficiently degraded by red pulp macrophages.32,60 Based on this novel insight, we investigated the adhesive properties of uRBCs derived from malaria cultures and patients with malaria and found an increased interaction with laminin-α5 and HA when compared with their respective controls. This effect was notably marked by elevated intracellular Ca2+ levels that can initiate PS exposure,55,61 membrane blebbing, and microvesiculation62,63 followed by cell shrinkage and RBC dehydration via Gardos-channel activation.64 The enhanced microvesiculation detected among in vitro cultures and patients with malaria confirmed initial studies identifying microvesicles in P. falciparum–infected individuals,65-67 in vitro cultures,68-71 and in murine malaria models.72,73 These studies demonstrate the correlation of microvesiculation with disease severity and particularly in dissecting its role during cerebral malaria65,66,74 in cell-cell communication between parasites,68,70 and immune responses.71,72 Another key observation when focusing on the malaria-induced impairment of uRBCs in vitro and in vivo is the reduced deformability of such cells.43,75,76 The perturbed rheological property of RBCs can be related to their membrane loss by microvesiculation.63,77 When determining the deformability of conditioned-medium RBCs, we could indeed distinguish such cells from control samples because of their reduced deformability, (supplementary Figure 3) implying that malaria-induced microvesiculation promotes RBC shrinkage, as reported by Nuchsongsin et al42 and Totino et al.57
Because the RBC transmembrane adhesion molecule Lu/BCAM78 is directly linked to the cytoskeleton via spectrin79 and could therefore be affected by Ca2+-mediated alterations of the uRBC cytoskeleton, we further assessed the surface levels and localization of Lu/BCAM. We detected increased MFI levels of BCAM, which eventually associated with BCAM clustering on the uRBC membrane. Upon PKA-mediated phosphorylation, Lu/BCAM can dissociate from the spectrin network,28,79,80 forming clusters that then facilitate strong binding to the ECM glycoprotein laminin.81 This interaction is dependent on GpC-associated sialic acids, as they inactivate Lu/BCAM through conformational changes.27 Even though we did not observe the gradual loss of GpC in malaria culture–derived uRBCs and conditioned medium–exposed RBCs (data not shown), the cluster formation of Lu/BCAM (Figure 4E) and the high MFI levels of Lu/BCAM (Figure 4A) supported the concept of Lu/BCAM cluster–mediated laminin-α5 adherence.79,81,82 Moreover, these clusters can promote the exposure of a novel epitope for Lu/BCAM-antibodies indicated by the high MFI levels.
Nunomura et al49 proposed a model for a Ca2+-mediated ankyrin binding to the cytoplasmic domain of CD44, which induces a conformational change in CD44 and results in the binding to HA.49 This model indeed supports our current finding of Ca2+-associated increased CD44-HA interaction and hints at a glycophorin C–independent mechanism of CD44 activation. However, the role of sialic acids in Lu/BCAM and CD44 activation in malaria-altered uRBCs needs further investigation to confirm its contribution to the uRBC-ECM interaction.
We also detected a pronounced Ca2+-associated hemolysis of laminin-α5–bound uRBCs. The strong constitutive binding to laminin-α5 combined with the augmented osmotic fragility initiated by intracellular Ca2+-accumulation therefore results in spherocytic hemolysis83 of malaria-altered uRBCs. Such hemolyzed RBCs are subsequently cleared by phagocytes, enabling the spleen-sustained viable iRBCs to evade splenic degradation.20 We found the constant interaction with laminin-α5, which is indispensable in the human red pulp, to be essential for the formation of translucent spherical-shaped ghosts. RBCs incubated with iRBCs, and conditioned medium were profoundly prone to hemolysis with continuous exposure to laminin-α5. Ghosts are rapidly ingested by macrophages,32,60 a highly abundant cell type in the spleen during malaria infection,84-86 during which monocytes are constantly recruited to the spleen, replenishing exhausted macrophages85,86 and causing splenomegaly84,87 and disorganization of the splenic architecture.87 During severe malaria infection, the splenic red pulp is congested with uRBCs,87 recruited monocytes, and resident red pulp macrophages.84-86 Such splenic phagocytes may be potentially exhausted from degrading retained uRBCs, which would enable iRBCs to escape splenic clearance and eventually enhance the parasite’s survival. Moreover, the erythrophagocytosis of ghosts is dependent on supplementation of active human serum, which may be associated with complement binding, thereby enhancing macrophage activation and hemolysis in P. falciparum malaria.88 Thus, the implied sequence of events is first binding to laminin-α5–bound RBCs, then hemolysis, and finally the subsequent phagocytosis by splenic macrophages.
Collectively, our results describe a novel mechanism linking the activation of adhesion molecules in malaria-altered uRBCs to enhanced splenic retention and destruction. This work may provide a basis for future strategies to treat malaria-induced anemia by using a calcium antagonist for disrupting the adhesion molecule interaction with splenic ECM components. Calcium antagonists were previously subjected to antimalarial treatment89-93; however, the treatment focused on the parasite development89,91-93 or the effect on chloroquine resistance90,94 and left the impact on uRBCs unexplored. Nevertheless, initial results by Cabrales et al95 showed that nimodipine, a calcium channel inhibitor, reduces the pathological manifestations of cerebral malaria in a murine model. Therefore, additional studies on the influence of calcium channel blocking or calcium antagonists on extravascular hemolysis are needed.
Acknowledgments
The authors thank all the patients and their families for participating in the study; the following CERMEL staff for collecting patient material: Brice Nzigou Mombo, Frederique Mbang Abba, Lia Betty Dimessa Mbanga, and Malik Azeez Akinosho; and Arivis (Rostock, Germany) for providing us with Arivis Vision 4D for our image analysis.
This work was supported by a contribution from the Center of Tropical Medicine and Travel Medicine, Amsterdam University Medical Centers, that covered field work expenses and transport of the samples. J.J.D. was funded by the Europeans Union Horizon 2020 research and innovation program under grant agreement 675115 (RELEVANCE) (R.v.B). The funders had no role in study design, data collection and analysis, decision to publish, or preparation of the manuscript.
Authorship
Contribution: R.v.B. and M.P.G. conceived the project; J.J.D. performed and analyzed the results of the experiments, designed the figures, and wrote the manuscript; B.M.B. and Z.D. performed the experiments; S.A.M.B., R.Z.-M., W.F.N.-N., G.M.-N., and M.P.G. organized the field work and enrolled the patients; T.R.L.K., T.W.K., and S.E. supervised the work; R.v.B. supervised the writing and edited the manuscript; and all authors contributed to and endorsed the final version of the manuscript.
Conflict-of-interest disclosure: The authors declare no competing financial interests.
Correspondence: Robin van Bruggen, Department of Molecular Hematology, Sanquin Research and Landsteiner Laboratories, Plesmanlaan 125, 1066 CX Amsterdam, The Netherlands; e-mail: r.vanbruggen@sanquin.nl.
References
Author notes
For original data, please contact the corresponding author (r.vanbruggen@sanquin.nl). The original data of the flow assays in Figure 1C-D,G-H may be found in supplemental Figure 1. The original data for flow cytometry analysis, of intracellular calcium-levels, depicted in Figure 2A-B,D, may be found in supplemental Figure 2.
The full-text version of this article contains a data supplement.

