TO THE EDITOR:
Relapsed/refractory B-cell acute lymphoblastic leukemia (B-ALL) remains a leading cause of cancer-related death in children.1,2 Despite an extensive understanding of leukemia-intrinsic drivers of disease relapse,3 the role of the leukemia microenvironment in promoting leukemic blast survival remains unclear.4 To address this, we and others have shown B-ALL blasts significantly remodel the immune microenvironment composition, particularly increasing representation of nonclassical monocytes (ncMono; CD14–CD16+) within the leukemia-associated myeloid compartment.5-7 Previous studies suggest classical monocytes give rise to ncMonos8,9 that can then act, in part, to maintain vascular endothelial integrity,10 however, the specific function of ncMonos in B-ALL pathogenesis remains unclear. Furthermore, we demonstrated that high monocyte abundance in peripheral blood (PB) at initial diagnosis was associated with an inferior outcome in both adults and children with B-ALL. These initial studies used single cell RNA-sequencing analysis on a small cohort of patients with diagnosis, remission, and relapse B-ALL biospecimens; however, we did not analyze individuals who achieved prolonged disease remission and relied on total monocyte abundance as a surrogate marker of ncMono. To validate the association of ncMono in a much larger cohort of B-ALL diagnosis samples, we examined the relationship between bone marrow (BM) and PB ncMono, and to specifically study the prognostic impact of ncMono, we performed high-parameter flow cytometry on primary matched B-ALL diagnosis BM and PB from children enrolled in the Children’s Oncology Group (COG) protocols. All subjects provided informed consent for the banking and future research use of these specimens in accordance with the Declaration of Helsinki and the regulations of the institutional review boards of all participating institutions.
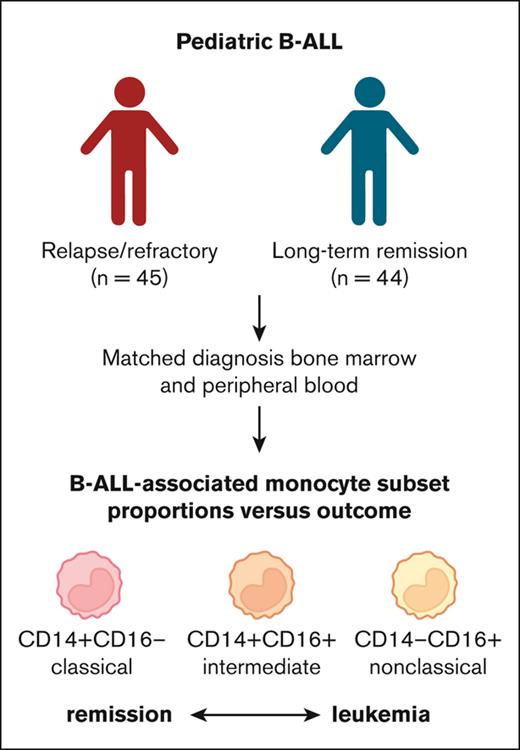
Diagnostic samples (matched PB and BM for each individual patient) from 57 patients who relapsed and 57 patients who remained in long-term remission (remission >4 years from diagnosis) from the COG cell bank were selected using an unmatched case-control design and subsequently analyzed along with additional banked remission BM samples from New York University Langone Health Medical Center (n = 4) as controls. All patients and/or their parents provided informed consent for the use of clinical samples. We designed an antibody panel to identify human monocytic subpopulations (eg, CD45+CD56–CD14+CD16– classical [cMono] and CD45+CD56–CD14–CD16+ ncMono), as well as pan-hematopoietic markers (CD45), B cells (CD19, CD22, CD10), and T/NK/granulocytes cells (CD3, CD56, CD66b) (supplemental Figure 1). We noted higher CX3CR1 expression in CD16+ monocyte subsets as a secondary validation of ncMono.8 Following careful examination of all raw flow data, we only included those samples with clear demarcation of cell types and >100 000 cells analyzed, which resulted in a total cohort of 45 patients who relapsed and 44 that remained in long-term remission. The exclusion of these samples did not lead to changes in clinical demographic comparisons (supplemental File 1).
To determine the prognostic impact of ncMono (as a percentage of myeloid-enriched cells, defined as CD45+CD19–CD10–CD22–CD56–CD3–CD66b–), we performed a univariate, nonparametric Wilcoxon rank sum test to compare monocyte abundances between patients who relapsed and those in long-term remission. In addition, we performed multivariate logistic regression analysis of remission/relapse status with adjustment for age, sex, central nervous system (CNS) status, National Cancer Institute (NCI) risk, genetic subtype, white blood count (WBC) at diagnosis, and end of induction (EOI) minimal residual disease (MRD). Notably, we were unable to determine absolute monocyte subset counts based on WBC count because of the absence of polymorphonuclear cells in mononuclear preparations used for flow cytometry analysis.
The clinical and laboratory characteristics of these samples are shown in supplemental Table 1. Given our request for specimens from patients who had both BM and PB samples banked at diagnosis, our sample set was enriched for patients with high-risk NCI in both cohorts, which was driven by a high WBC at diagnosis, as noted by the similar WBC median of >60 K cell/uL in both cohorts. Despite this, age <10 years was associated with a remission outcome (P = .00305) consistent with known poor outcome in older patients.11 We found that patients who relapsed had a higher EOI MRD (>0.01) than those in the remission cohort, consistent with an increasingly poor outcome for patients with ALL with positive EOI MRD12 (supplemental Table 1). Conversely, our cohort did not show statistically significant differences between the groups based on sex, CNS status, or genetic subtype (supplemental Table 1), possibly because of the relatively small number of samples.
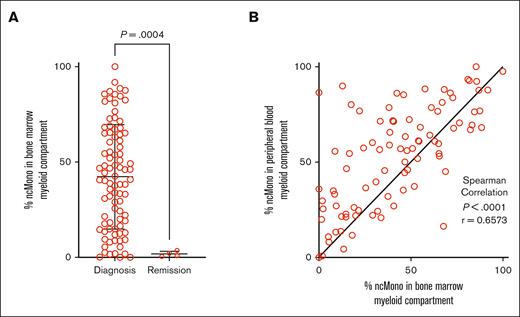
To validate the relationship between monocyte differentiation state and leukemia, we first compared the relative abundance of leukemia-associated monocyte subpopulations—specifically, CD14+CD16– cMono, CD14+CD16+ intermediate, and CD14–CD16+ ncMono—using leukemic and remission biospecimens. Here, we identified a significant increase in the proportion of ncMono within the leukemia-associated myeloid compartment (CD45+CD19–CD10–CD22–CD56–CD3–CD66b–) in patients with diagnostic BM when compared with remission BM control samples (median [95% confidence interval of difference], 40.83% vs 1.54%, [–65.29 to –12.62]; P = .0004), which showed a dominant proportion of CD14+CD16– classical monocytes (median 87.19%) (Figure 1A). We also found a significant correlation between the proportion of nonclassical monocytes in PB and BM (Spearman r = 0.657, 95% confidence interval, [0.516-0.764]; P < .0001) (Figure 1B). These findings validate our previous studies underscoring the enrichment of leukemia-associated monocytes in the myeloid immune microenvironment of leukemia biospecimens when compared with healthy and/or remission BM controls.5-7
Proportion of ncMono within the leukemia-associated myeloid cell-enriched compartment of patient samples. (A) Mann-Whitney U test demonstrating a significantly increased proportion of ncMono within the leukemia-associated myeloid compartment (CD45+CD19–CD10–CD22–CD56–CD3–CD66b–) of patient diagnostic BM samples (n = 89) compared with remission BM control samples (n = 4). (B) The proportion of ncMono within the leukemia-associated myeloid compartment of PB samples significantly correlated with that in BM samples using Spearman correlation.
Proportion of ncMono within the leukemia-associated myeloid cell-enriched compartment of patient samples. (A) Mann-Whitney U test demonstrating a significantly increased proportion of ncMono within the leukemia-associated myeloid compartment (CD45+CD19–CD10–CD22–CD56–CD3–CD66b–) of patient diagnostic BM samples (n = 89) compared with remission BM control samples (n = 4). (B) The proportion of ncMono within the leukemia-associated myeloid compartment of PB samples significantly correlated with that in BM samples using Spearman correlation.
Multivariate analysis of the association between monocyte subpopulation abundance and patient outcome highlighted a significantly higher abundance of ncMono in the PB of patients who relapsed when compared with those in long-term remission (Table 1, median interquartile range, 60.94% [36.49-80.27] vs 54.40% [24.26-68.14]; P = .038), with a corresponding trend via univariate analysis (P = .089). We observed this pattern in the matched patient BM samples; however, it did not reach statistical significance (Table 1, median interquartile range, 44.32% [17.61-61.13] vs 39.55% [17.32-65.18]; P = .544) despite the significant correlation between BM and PB (Figure 1B). We examined the association between ncMono abundance and EOI MRD but did not find any significant association (supplemental Table 2). Further analysis of our previously published pediatric B-ALL cohort stratified by PB absolute monocyte counts (AMC)7 revealed that patients with low-AMC and high-AMC showed significant differences in sex, WBC, NCI risk, CNS status, genetic subtype, and EOI MRD, thus limiting comparisons with our current findings (supplemental Table 3).
Comparisons of monocyte abundances in BM and PB between the remission (n = 44) and relapse (n = 45) cohorts
| % Myeloid compartment (median IQR) . | Remission (n = 44) . | Relapse (n = 45) . | P value (univariate) . | P value (multivariate) . |
|---|---|---|---|---|
| PB | ||||
| CD14+CD16– | 31.18 (14.92-49.11) | 23.41 (11.59-48.85) | 0.148 | .113 |
| CD14+CD16+ | 9.02 (5.23-17.67) | 10.68 (4.97-13.81) | 0.715 | .240 |
| CD14–CD16+ | 54.40 (24.26-68.14) | 60.94 (36.49-80.27) | 0.0887 | .038 |
| BM | ||||
| CD14+CD16– | 49.88 (23.30-72.27) | 41.63 (23.89-66.30) | 0.667 | .374 |
| CD14+CD16+ | 7.84 (3.81-12.12) | 8.31 (2.86-16.67) | 0.905 | .600 |
| CD14–CD16+ | 39.55 (17.32-65.18) | 44.32 (17.61-61.13) | 0.685 | .544 |
Univariate analysis: The nonparametric Wilcoxon rank sum test (2-tailed) was used to compare the monocyte abundances between remission and relapse.
Multivariate analysis: logistic regression of the response outcome (relapse vs remission) on monocyte abundances (2-tailed Wald test) was used to assess the association between monocyte abundances and response with adjustment of potential confounding factors including age, sex, CNS status, NCI risk, genetic subtype, and WBC level at diagnosis, and EOI MRD.
IQR, interquartile range. Bold indicates P value < 0.05.
Overall, our results validated the distinctive remodeling of leukemia-associated monocyte subpopulations in pediatric B-ALL cases. We found that B-ALL-associated ncMono proportions in the PB, but not the BM, at B-ALL diagnosis were associated with patient treatment outcomes, albeit with high variability. Therefore, the lack of prognostic significance of BM ncMono proportions and the extensive variation among patients limits the use of ncMono differentiation state as a robust biomarker for B-ALL relapse.
Acknowledgments: The authors thank the support of the Children’s Oncology Group and the facilities of the University of Colorado Anschutz Medical Campus and the New York University School of Medicine. M.T.W. received funding support from the National Institutes of Health/National Cancer Institute (NIH/NCI) 1K22CA258520-01. W.L.C. received grants from NIH/NCI (R01CA140729 and R01CA260028) and the Perlmutter Cancer Center (P30 CA016087). W.L.C. and I.A. received funding support from Curing Kids Cancer. G.P.C.Y. received funding from the Pediatric Cancer Foundation (fellowship training grant) and Hyundai Hope On Wheels (Impact Award). Graphical abstract was created with BioRender.com.
Contribution: G.P.C.Y., N.A.E., I.A., W.L.C., and M.T.W. designed the study; G.P.C.Y., N.A.E., and M.T.W. performed the flow cytometry experiments and analysis; Y.Z., J.H., T.M.C., and M.E.S. performed biostatistical analyses; J.M.S., C.A., E.D., D.T.T., K.R.R., and E.A.R. contributed to the interpretation and discussion; G.P.C.Y., N.A.E., I.A., W.L.C., and M.T.W. wrote and revised the manuscript; I.A., W.L.C., and M.T.W. supervised the study; and all authors reviewed and approved the final version of the manuscript.
Conflict-of-interest disclosure: The authors declare no competing financial interests.
Correspondence: Matthew T. Witkowski, Department of Pediatrics University of Colorado, Anschutz Medical Campus, Aurora, CO 80045; e-mail: matthew.witkowski@cuanschutz.edu.
References
Author notes
Flow cytometry data files are publicly available through the Open Science Framework (Identifier: DOI 10.17605/OSF.IO/GUJAX).
Data are available on request from the corresponding author, Matthew T. Witkowski (matthew.witkowski@cuanschutz.edu).
The full-text version of this article contains a data supplement.


