Key Points
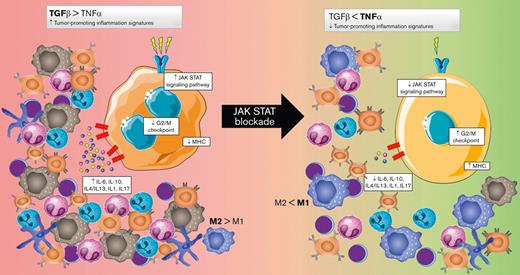
CSF3R is identified as a biomarker of JAK/STAT constitutive activation in Hodgkin and Reed-Sternberg cells.
JAK/STAT blockade activates the G2/M checkpoint and MHC pathways and downregulates all the tumor-promoting inflammation signatures.
Abstract
Constitutive activation of the JAK/STAT pathway is a common phenomenon in classic Hodgkin lymphoma (cHL). The clinical potential of anti-JAK/STAT therapy is being explored in early-stage clinical trials. Notwithstanding, very little information is available about the complex biological consequences of this blockade. Here, we investigated the effects of JAK/STAT pharmacological inhibition on cHL cell models using ruxolitinib, a JAK 1/2 inhibitor that induces apoptosis by concentration- and time-dependent mechanisms. An unbiased whole-transcriptome approach identified expression of the anti-GCSF receptor (CSF3R) as a potential surrogate biomarker of JAK/STAT overactivation. In addition, longitudinal gene expression analyses provided further mechanistic information about pertinent biological pathways involved, including 37 gene pathways distributed in 3 main clusters: cluster 1 was characterized by upregulation of the G2/M checkpoint and major histocompatibility complex-related clusters; 2 additional clusters (2 and 3) showed a progressive downregulation of the tumor-promoting inflammation signatures: JAK/STAT and interleukin 1 (IL-1)/IL-4/IL-13/IL-17. Together, our results confirm the therapeutic potential of JAK/STAT inhibitors in cHL, identify CSF3R as a new biomarker, and provide supporting genetic data and mechanistic understanding.
Introduction
Classic Hodgkin lymphoma (cHL) is a B-cell–derived lymphoid malignancy characterized by the clonal proliferation of Hodgkin and Reed-Sternberg (HRS) cells1,2 diluted in a characteristic inflammatory tumor microenvironment (TME) that is biologically and clinically significant in this disease.3,4 Observational data and evidence favor the general idea that genomic lesions occurring early in the neoplastic HRS clone lead to aberrant activation of signaling pathways and transcription factors, which fosters the induction of specific secretory profiles of growth factors, chemokines, and cytokines that together give rise to and shape the TME.5
The overactivation of the JAK/STAT signaling pathway is an almost universal feature of cHL, along with NF-κB activation.6 Constitutive activation of the pathway may be the consequence of JAK2 activation/overexpression secondary to 9p24.1 genomic amplification,7,8 activating mutations in molecules, such as STAT3 and STAT6,9-13 or inactivating mutations and deletions in SOCS1-negative or PTPN1-negative regulators.14,15 In addition, around 30% of the patients are infected by Epstein-Barr virus (EBV), which also contributes to the constitutive activation of the JAK/STAT pathway.16
Several cytokines and chemokines stimulate the HRS cells by recognizing JAK1-/JAK2-bound receptors.17-20 This persistent activation of the JAK/STAT signaling pathway is also related to the suppression of antitumor immunity and tumor-promoting inflammation that characterize the TME.4,21
We9,10 and others11,22-27 have previously proposed that the JAK/STAT signaling pathway could be a rational therapeutic target in cHL because of its common constitutive activation. Ruxolitinib (INCB18424) is a potent and selective JAK1/2 inhibitor that is being developed for clinical use to treat intermediate- or high-risk myelofibrosis.28 This drug has also demonstrated some activity in preliminary clinical trials in patients with cHL with very advanced disease.29-31 However, only very limited data are available about the molecular mechanisms and consequences of this blockade.
Here, we adopted a whole-transcriptome approach and carried out time-course experiments to identify the molecular mechanisms underlying JAK/STAT inhibition. Our results confirmed the cytotoxic efficacy and specificity of ruxolitinib in several cHL-derived cell models and identified the expression of the anti-GCSF receptor (CSF3R) as a potential surrogate biomarker of JAK/STAT overactivation. In addition, JAK/STAT blockade was found to induce dramatic changes that affect ∼20% of the whole transcriptome. Unsupervised bioinformatic analyses identified 37 significant gene pathways, distributed in 3 major clusters: a first cluster of gene sets that concurrently change from being depressed to having increased expression, mostly including upregulation of the G2/M checkpoint and activation of major histocompatibility complex (MHC)–related clusters; and 2 clusters with inverse profiles, from overactivation to progressively repressed, characterized by most of the tumor-promoting inflammation signatures. Taken together, these changes represent a global reversion of the main characteristics of the malignant phenotype of the HRS cells, provide a mechanistic explanation, and suggest some potential biomarkers for JAK/STAT blockade.
Methods
Cell lines and primary tumor samples
For in vitro studies, we included L-591, L-428, L-540, L-1236, and KM-H2 cHL-derived cell lines. DoHH2 (derived from GCB-type diffuse large B-cell lymphoma) and HeLa (epithelial) cell lines were also included as negative controls. Cell lines were obtained from the German Collection of Microorganisms and Cell Cultures (DSMZ, Braunschweig, Germany). All the cell lines were authenticated by short tandem repeat profiling in the Spanish National Cancer Center (CNIO) Genomics Unit. Cells were cultured in RPMI-1640 medium (GIBCO, Grand Island, NY) supplemented with 10% fetal bovine serum, 5% streptomycin, 5% L-glutamine, and 5% amphotericin B (Sigma, St Louis, MO). Cells were grown at 37°C in 5% CO2.
Paraffin-embedded cell line pellets were prepared with approximately 108 cells, washed with phosphate-buffered saline, centrifuged, and fixed with buffered formalin (4%).
Tissue microarrays (TMAs) were constructed using formalin-fixed, paraffin-embedded lymph node samples from 140 patients with confirmed diagnoses of cHL, as described elsewhere.32 Samples and clinical data were retrieved from the files of the MDACC Madrid Biobank in accordance with the technical and ethical procedures of the Spanish National Biobank Network, including anonymization processes and having obtained informed consent according to the declaration of Helsinki. Approval was obtained from the Clinical Research Ethical Committee (protocol number 372-19). The clinical parameters of the patients are provided in supplemental Table 1.
In vitro assays
To assay cell toxicity, the cell lines were incubated with or without ruxolitinib (HY-50856; MedChem, Monmouth Junction, NJ). In addition, cells were treated with doxorubicin and dimethyl sulfoxide as positive and negative controls, respectively, and to eliminate the nonspecific vehicle signals. After a range of incubation times, cell viability was quantified by AlamarBlue reagent (Bio-Rad, Hercules, CA) and the EPOCH microplate spectrophotometer (BioTek, London, United Kingdom), following the manufacturers’ instructions. The half-maximal inhibitory concentration (IC50) was determined as described elsewhere.33
Western blotting and real-time polymerase chain reaction (RT-PCR)
Whole cell line lysates were prepared after 24 hours of treatment by following RIPA’s protocol and using a set of protease inhibitors: NaOH, NaF, protease inhibitor cocktail (1:100), and β-glycerophosphate (Sigma). Protein concentrations were measured using the BCA Pierce protein test kit (Thermo Fisher Scientific, Waltham, MA), following the manufacturer's instructions. Equal amounts of protein from each sample were electrophoresed on sodium dodecyl sulfate-polyacrylamide gel electrophoresis gels and transferred to PVDF membranes (Millipore, Burlington, MA). Proteins were detected by immunoblotting with the following antibodies: STAT3 (124H6; Cell Signaling, Danvers, MA), P-STAT3 (Y705, Cell Signaling), STAT6 (D-1; Santa Cruz Biotechnology, Dallas, TX), P-STAT6 (Tyr601, Cell Signaling), STAT5 (D206Y, Cell Signaling), and P-STAT5 (Y694, Cell Signaling). Glyceraldehyde-3-phosphate dehydrogenase (Sigma) was used as a loading control. Subsequently, the membranes were washed in TBS-T buffer (50 mM tris(hydroxymethyl)aminomethane-HCl pH 7.6, 150 mM NaCl, 0.1% Tween 20) and incubated with anti-mouse or anti-rabbit (NA934V and NXA93IV; GE Healthcare, United Kingdom) secondary antibodies for 45 minutes at room temperature, then incubated with the development reagent (ECL Plus, Thermo Scientific), and revealed with the ChemiDoc XRS image analyzer (Bio-Rad).
Quantitative RT-PCR analysis to quantify the relative level of CSF3R expression was performed using a commercial TaqMan probe with a dye label (FAM) (Hs01114420_m1; Thermo Fisher Scientific). Total RNA was extracted from frozen cell pellets using TRIzol reagent.
Apoptosis and cell-cycle analyses
For apoptosis and cell-cycle analyses, we compared cHL-derived cell lines that were untreated or treated with ruxolitinib at the IC50 concentration. After the different treatment periods (24 and 48 hours), the cells were stained with Annexin APC (Thermo Scientific) and propidium iodide, then analyzed using a BD FACSCalibur flow cytometer (Becton Dickinson Biosciences, Erembodegem-Aalst, Belgium).
CSF3R transfection experiments
L-428 cells were transfected by electroporation with 8 μg plasmid DNA and 1.3 × 10⁶ cells in 400 μL of OPTIMEN (Gibco) using a Gene-pulser Xcell device (Bio-Rad) at 280 V and 950 μF conditions for 1 to 2 seconds. The cells were plated in 2 p24-well plates, and geneticin antibiotic (Gibco) was added at a concentration of 0.2 μg/μL 2 days after the electroporation. Ten days later, the colonies were isolated and tested by immunocytochemistry. Positive colonies were cloned by limited dilution and retested by immunocytochemistry using an anti-Myc monoclonal antibody (CNIO). The plasmid vector (PCMV6-hCSF3R-Myc-DDK–tagged) used for L-428 transfections was obtained from Origene (CAT#: RC208790; Origene, Rockville, MD).
Gene expression (GE) analysis
Whole-transcriptome expression assays were performed using SurePrint G3 Human GE arrays 8×60K v2 (Agilent Technologies, Santa Clara, CA), profiling ∼32 000 transcripts. Briefly, 200 ng of total RNA was isolated from all the untreated cell lines and after 6, 12, 24, and 48 hours of drug incubation with ruxolitinib at the IC50 doses. Reverse transcription and cDNA labeling with Cy3-CTP were carried out according to the manufacturer’s instructions. Scanning, quantification, and data normalization were done using a G4900DA SureScan Microarray Scanner System and Feature Extraction v12.0 (Agilent Technologies). Experimental replicates were done using the KM-H2 cell line, which revealed perfect concordance between them.
For initial GE analyses and unsupervised hierarchical clustering, data files generated by the Agilent Feature Extraction Software were imported into the Subio Platform (Subio Inc., Kagoshima, Japan).
CSF3R immunohistochemistry (IHC), protein quantification, and multiplexed immunofluorescence (mIF)
Expression of the anti-CSF3R protein was assessed by IHC as a potential surrogate of JAK/STAT overactivation. We used cytospin preparations from cHL-derived cell cultures and primary cHL tumor samples using TMAs containing duplicated cores from selected areas, enriched in HRS cells. Cytospin slides and TMA sections were stained with a primary anti-CSF3R rabbit polyclonal antibody (OriGene Technologies, Rockville, MD) diluted at 1/100, using a heat-induced epitope retrieval protocol buffered by tris(hydroxymethyl)aminomethane or EDTA at pH 9, with the BOND RX automated stainer system (Leica Biosystems, Buffalo Grove, IL).
For quantitative IHC analyses in cell lines, we compared untreated cells with cells after 24 hours of ruxolitinib treatment. Briefly, 200 μL of the cell suspensions, containing around 106 cells per mL, were cytospun on slides fixed with 96% ethanol and immunostained with anti-CSF3R. We generated digital images with an Aperio CS2 image capture device (Leica Biosystems) at 20× magnification and customized the Aperio Cytoplasm Algorithm to adjust the detection of CSF3R staining. Positivity (NPositive/NTotal pixels) was measured in 5 randomly selected regions of interest for each cell line.
TMAs were qualitatively scored manually by 2 of the authors (S.F. and J.L.S.), with positive cases being considered to be those with any CSF3R expression in clearly recognizable HRS cells. CSF3R expression in granulocytes was used as an internal positive control in all evaluable cases. Quantification was not considered as this was intended to be a descriptive subanalysis.
To confirm the distribution of CSF3R cells in primary tumors, mIF was assayed in 4 representative cHL samples using Akoya’s TSA-Opal Multiplex kit (Akoya Biosciences, Marlborough, MA), according to the manufacturer’s guidelines, and a BOND RX automated stainer. Briefly, 5 μm formalin-fixed, paraffin-embedded tissue sections were consecutively incubated with anti-CSF3R rabbit polyclonal antibody (1/100), anti-CD30, and anti-PAX5 (Leica Biosystems), with a previous heat-induced epitope retrieval protocol. Each primary Ab was followed by incubation with TSA fluorophores Opal 520, Opal 570, and Opal 620, respectively, and final nuclear counterstaining with 4′,6-diamidino-2-phenylindole. For each antibody, staining parameters were first optimized using single chromogenic IHC and monoplexed IF on tonsil and reactive lymph node sections.
Statistics
Results of cell toxicity experiments were statistically analyzed, graphs were plotted, and IC50 values were calculated using GraphPad Prism 7 (GraphPad Software, Inc., La Jolla, CA). Correlations between individual biomarkers and dichotomous clinical variables were analyzed using the Pearson χ2 test. Two-way analysis of variance comparisons of means were used for continuous independent variables. Statistical significance was concluded for values of P < .05.
Gene-set enrichment analysis (GSEA) was done using the software developed by the Broad Institute.34 The untreated cell phenotype was compared with cells treated for 24 hours in each cell model. GSEA was carried out using the desktop version, applying the default settings, and using 1000 permutations between gene sets.
Because GSEA only allows pairwise comparisons, and given the genetic heterogeneity and complexity of the time-course experiments, we analyzed longitudinal GE data at the gene-set level using the Time-course Gene Set Analysis (TcGSA) package, as previously described.35 The method uses linear mixed-effects models to identify gene sets with significant variation in expression over time, taking into account the potential heterogeneous expression within the gene sets. The TcGSA package for R Studio (R Studio, Boston, MA) is available from the CRAN repository: https://cran.r-project.org/web/packages/TcGSA. Unsupervised hierarchical clustering was carried out and graphs plotted in R Studio.
For both TcGSA and GSEA, an identical gene set (.gmt) file was generated from the Broad Institute’s Molecular Signatures database v6.0 (MSigDB).36 We selected 135 canonical pathways from the BioCarta, Kyoto Encyclopedia of Genes and Genomes, and Reactome repositories that were related to B-cell and T-cell lymphomas, myeloid leukemias, general hallmarks of cancer, and immune regulation. Full information about the gene sets and their annotations is listed in supplemental Table 2.
GSEA analyses of L-428 and L-1236 cell lines treated with 5-Aza-dC/decitabine were performed using data from public repositories (https://www.ncbi.nlm.nih.gov/geo/query/acc.cgi?acc=GSE86068).37
Results
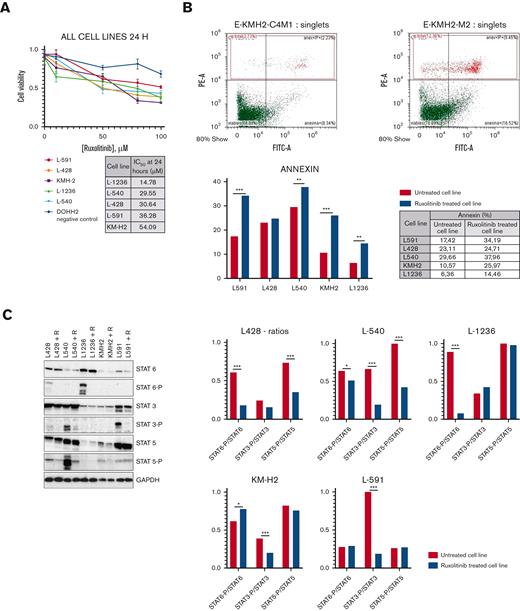
Consistent with the results of a previous report,29 cell toxicity experiments confirmed the efficacy of the JAK/STAT blockade in all the HRS cell lines (Figure 1A), wherein cell death by apoptosis was induced in a dose- and time-dependent manner (Figure 1B; supplemental Figure 1A) with only minor differences in IC50 values. All the cell lines were characterized by 1 or several activating genetic lesions in the pathway, as described previously.10,14,38
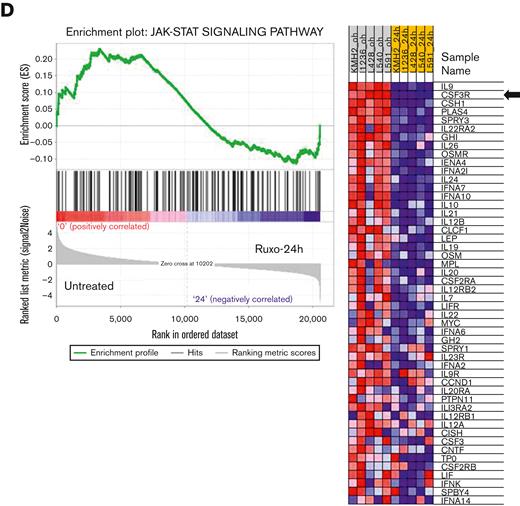
Cell toxicity experiments. (A) Growth curves of cHL lines under ruxolitinib treatment. The table indicates IC50 values at 24 hours. All experiments were done at least in triplicates. (B) KM-H2 cell line as a representative model. Percentage of apoptotic cells (% annexin V+) before (left panel) and after ruxolitinib treatment (right panel). Representative images from all cell lines are available in supplemental Figure 1. (C) JAK/STAT pathway inhibition confirmed by WB: all cHL–derived cell lines showed similar levels of STAT proteins in treated and untreated cell lines, and significant reduction in p-STATs after ruxolitinib treatment. Representative figure from experiments carried out in triplicates. Histograms (right) show phosphorylated STAT/total STAT ratios in each model. (D) GSEA: the JAK/STAT pathway is one of most prominent gene sets downregulated after ruxolitinib treatment. Left: enrichment plot comparing untreated vs ruxolitinib-treated (24 hours) phenotypes; right: heat map showing the genes that contribute most to the enrichment score (nominal P < .01; FDR < 0.05) (two-way ANOVA: ∗∗P < .05; ∗∗∗P < .001). ANOVA, analysis of variance; FDR, false discovery rate; WB, Western blotting.
Cell toxicity experiments. (A) Growth curves of cHL lines under ruxolitinib treatment. The table indicates IC50 values at 24 hours. All experiments were done at least in triplicates. (B) KM-H2 cell line as a representative model. Percentage of apoptotic cells (% annexin V+) before (left panel) and after ruxolitinib treatment (right panel). Representative images from all cell lines are available in supplemental Figure 1. (C) JAK/STAT pathway inhibition confirmed by WB: all cHL–derived cell lines showed similar levels of STAT proteins in treated and untreated cell lines, and significant reduction in p-STATs after ruxolitinib treatment. Representative figure from experiments carried out in triplicates. Histograms (right) show phosphorylated STAT/total STAT ratios in each model. (D) GSEA: the JAK/STAT pathway is one of most prominent gene sets downregulated after ruxolitinib treatment. Left: enrichment plot comparing untreated vs ruxolitinib-treated (24 hours) phenotypes; right: heat map showing the genes that contribute most to the enrichment score (nominal P < .01; FDR < 0.05) (two-way ANOVA: ∗∗P < .05; ∗∗∗P < .001). ANOVA, analysis of variance; FDR, false discovery rate; WB, Western blotting.
Although we observed intrinsic variability in the preferential usage of STAT6, STAT3, and STAT5 proteins in the different cell models, as previously described,25 Western blotting analysis of the variation in STATs phosphorylation levels confirmed the direct effect on the JAK/STAT pathway (Figure 1C). Thus, p-STAT6 reduction was more noticeable in L-428 and L-1236, p-STAT3 reduction was evident in L-540 and L-591, and p-STAT5 reduction was more evident in L-428 and L-540.
Given the complexity of the JAK/STAT pathway and the large number of transcriptionally regulated genes,39 we adopted a whole-transcriptome approach to identify relevant biological changes. As expected, initial GE profiles revealed massive transcriptional changes, with substantial (more than threefold) and significant differences in more than 5000 genes (supplemental Figure 2). This means that the changes affect more than 18% of the whole transcriptome (mean value for the 5 cell lines, range 16.5%-23.8%, as a global comparison between 0 and 48 hours) and that there are great variations between the different cell models and between intermediate time points. Most of the significant changes involved the downregulation of genes.
We used both GSEA and TcGSA to better understand this genomic complexity and to carry out insightful data analysis and interpretation of the results within the context of biological systems. As expected, one of the signatures most prominently downregulated after ruxolitinib treatment is the JAK/STAT pathway itself, identified by TcGSA and GSEA, as an additional validation of the overall results (Figure 1D; supplemental Table 3).
As surrogate biomarkers of the JAK/STAT constitutive activation in HRS cells, leading-edge analyses identified the core members that contribute most to the enrichment score.34 It is of note that CSF3R, which codes for a cell-surface receptor protein usually only expressed by granulocytes and hematopoietic progenitors in bone marrow, is the second most representative gene of the pathway. All the other top-ranked genes code for secreted proteins (chemokines and cytokines) (Figure 1D). CSF3R expression was confirmed by RT-PCR analysis in all cell lines.
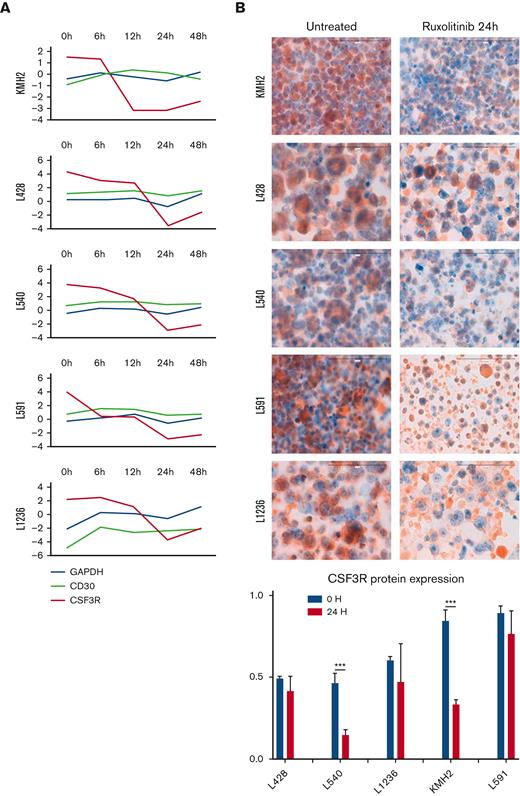
To the best of our knowledge, there have been no previous reports of the aberrant expression of CFS3R in cHL or any other B-cell malignancy. In addition, CSF3R has STAT-binding sites in its promoter regions,40 making this gene a rational JAK/STAT target. Thus, we detected CSF3R protein expression by IHC in all the cHL-derived cell lines using cytospin preparations and paraffin-embedded cell line blocks (Figure 2B; supplemental Figure 3). There was a marked reduction in the level of CSF3R messenger RNA expression and a variable reduction of the CSF3R protein in all the cell lines after ruxolitinib treatment (Figure 2A-B), and functional experiments confirmed lower ruxolitinib toxicity in CSF3R-transfected cells (supplemental Figure 4).
Downregulation of CSF3R expression. (A) CSF3R GE changes over time (log2-fold change) in cHL-derived cell lines compared with 2 different controls: GAPDH and CD30 (TNFRSF8). (B) CSF3R protein expression measured by IHC (cytospin preparations) to compare untreated (left) with ruxolitinib-treated (right) cell lines. The histogram illustrates the pattern of IHC quantification (two-way ANOVA: ∗∗∗P < .001). ANOVA, analysis of variance.
Downregulation of CSF3R expression. (A) CSF3R GE changes over time (log2-fold change) in cHL-derived cell lines compared with 2 different controls: GAPDH and CD30 (TNFRSF8). (B) CSF3R protein expression measured by IHC (cytospin preparations) to compare untreated (left) with ruxolitinib-treated (right) cell lines. The histogram illustrates the pattern of IHC quantification (two-way ANOVA: ∗∗∗P < .001). ANOVA, analysis of variance.
Because activating CSF3R mutations are highly prevalent in some myeloid neoplasms (chronic neutrophilic leukemia, atypical chronic myeloid leukemia, and some cases of acute myeloid leukemia [AML]),40,41 we confirmed the absence of CSF3R mutations and/or genetic rearrangements in all cHL cell lines using a targeted gene panel and next-generation sequencing (Oncomine Myeloid Research Assay, Thermo Fisher Scientific; results not shown).
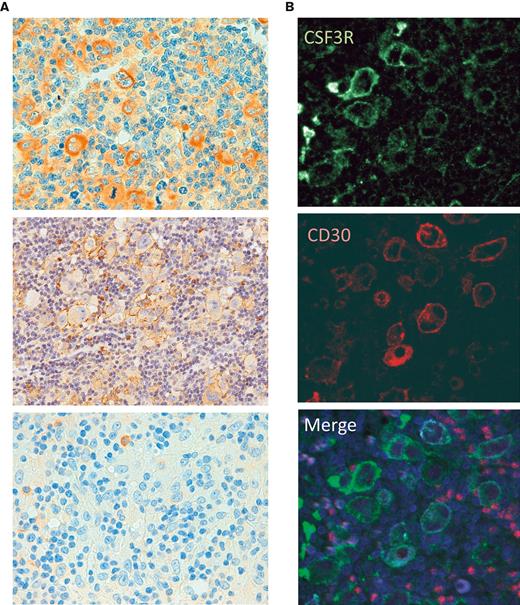
In addition, we detected CSF3R protein expression by IHC in 85% of the cHL primary tumors (89 of the 105 evaluable cases, considering the integrity and representativity of the tissue cores on the TMAs and using the presence of CSF3R expression in granulocytes as an internal control). Most cases displayed distinct protein expression in a significant number of HRS cells (Figure 3). In addition, CSF3R expression by the HRS cells in primary tumors was confirmed by mIF (Figure 3C).
CSF3R protein expression in primary tumors. (A) Representative examples of CSF3R in HL primary tumors, with strong, faint, and negative IHC expression. (B) mIF for CSF3R (green) and CD30 (red).
CSF3R protein expression in primary tumors. (A) Representative examples of CSF3R in HL primary tumors, with strong, faint, and negative IHC expression. (B) mIF for CSF3R (green) and CD30 (red).
In this series of patients, we found no significant correlation between CSF3R expression and most clinical end points: cHL subtype, gender, stage, prognostic score (IPS), and therapeutic response. We found CSF3R expression to be more frequent only in younger patients with cHL (supplemental Table 1).
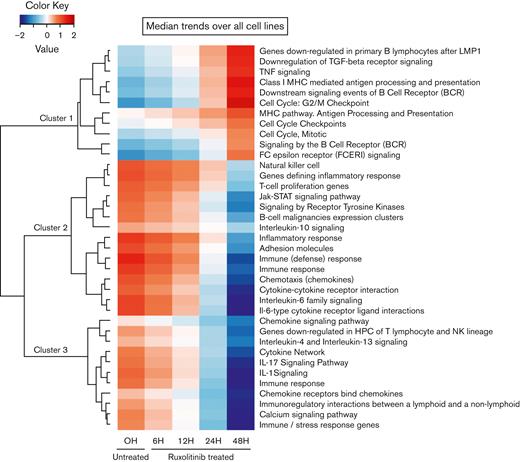
Because our experimental approach was essentially based on time-course experiments, longitudinal GE data were analyzed using TcGSA (Figure 4; supplemental Table 3). We identified 37 significant pathways, which were grouped into 3 main clusters. Cluster 1 was characterized by marked activation of common downregulated features of the cHL, including the G2/M checkpoint, several MHC-related gene sets, a group associated with B-cell receptor signaling, and proinflammatory cytokine pathways (downregulation of transforming growth factor [TGF]-β and activation of tumor necrosis factor [TNF]). The overall results were consistent with the functional reversion of relevant phenotypic hallmarks of the HRS cells. To confirm that the observed variations in the gene sets were mainly because of JAK/STAT inhibition compared with unspecific changes induced by apoptosis, we analyzed the GE profiles of L-428 and L-1236 cell lines treated with 5-Aza-dC/decitabine, 2 apoptosis-inducing drugs (supplemental Figure 6) that modulate the pathways in completely different ways.
TcGSA. Unsupervised clustering of significant gene sets (nominal P < .05). The heatmap illustrates the dynamic trends of gene sets over time (supplemental Table 3).
TcGSA. Unsupervised clustering of significant gene sets (nominal P < .05). The heatmap illustrates the dynamic trends of gene sets over time (supplemental Table 3).
Most cHL-derived cell lines had a larger hyper-G2/M fraction at later times, consistent with G2/M checkpoint activation (supplemental Figure 1B). In contrast, L-591, the only EBV-associated cell line,42 had a reduced G2/M fraction, indicating that other mechanisms must be induced and regulated by EBV.16
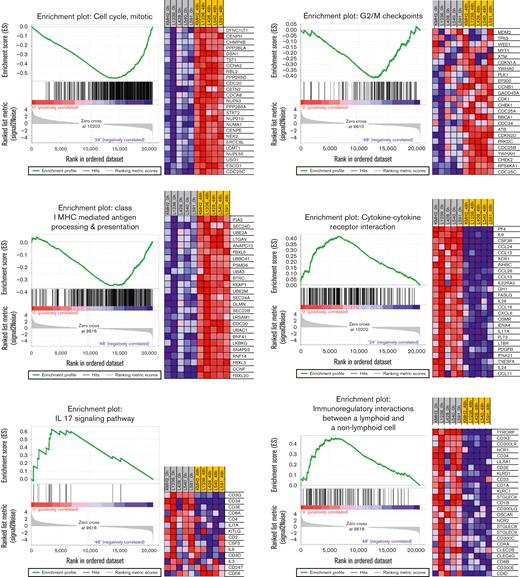
In contrast, clusters 2 and 3 were mostly related to the downregulation of TME remodeling signatures, including nearly all protumoral networks usually overexpressed in cHL tumors,4 especially the JAK/STAT pathway itself, but also the interleukin 4 (IL-4)/IL-13, IL-1, IL-6, and IL-17 pathways. The TcGSA results were confirmed by GSEA, which revealed significant variation in representative gene sets (Figure 5).
GSEA of representative gene sets (left) and heat maps with the most significant genes (right) (P < .01, FDR < 0.1). FDR, false discovery rate.
GSEA of representative gene sets (left) and heat maps with the most significant genes (right) (P < .01, FDR < 0.1). FDR, false discovery rate.
Discussion
The biological mechanism of JAK/STAT pathway activation involves tyrosine phosphorylation, dimerization, nuclear translocation, binding to specific DNA response elements, recruitment of coactivators or corepressors, and transcriptional induction or repression of target genes.21 In each cell model, 7 STAT transcription factors positively and negatively regulated the expression of a vast array of genes whose identification remains far from complete. As might be expected, we were able to show how the blockade of the pathway induced massive transcriptional changes, which affected more than 18% of the whole transcriptome in this model. Our results are also consistent with those in a recent report about cutaneous T-cell lymphoma cells treated with a STAT6-specific inhibitor,39 which yielded similarly complex results and several clusters of cytokines and chemokines among the most downregulated genes.
Here, we identify 3 functional clusters that are significantly altered by the JAK/STAT blockade in cHL-derived cell lines. The composition of these clusters suggests that pharmacological intervention in this pathway not only induces cell death by apoptosis but also has complex biological consequences that reverse and neutralize the main features of the malignant phenotype of the HRS cells. Cell lines are probably not entirely representative of cHL primary tumors, so many of our results and functional interpretations require further validation in primary tumors.
Cluster 1 comprises gene sets usually suppressed in HRS cells43,44: antigen processing and presentation by MHC, activation of the G2/M checkpoint,32,45 and activation of some antitumor immunity-related signatures, such as downregulation of TGF-β signaling and/or upregulation of TNF signaling.46
Clusters 2 and 3 are mostly related to TME remodeling, including downregulation of the JAK/STAT pathway itself, but also IL-6 or IL-10 signatures and the IL-4/IL-13- and IL-1/IL-17-associated cytokine networks, which mostly represent tumor-promoting signals in cHL.17,26,47-49
The concurrent reversal of many aberrant cytokine networks that usually maintain tumor-promoting signals from the TME is striking. Thus, it might be expected that the concurrent inversion of TGF-β/TNF signaling associated with the downregulation of IL-4/IL-13 and IL-1/IL-17 would be synergistic in reprogramming tumor-associated macrophages and might cause them to shift from M2-like to M1-like phenotypes.50-52 Although the macrophage polarization gradient is more complex than the classic M1 and M2 binary classification, environmental changes may cause macrophages to shift from M1 to M2, or vice versa, or to a hybrid of the 2 cells, highlighting the great plasticity of macrophages and their dependence on the surrounding environment. It is also well known that immune-suppressive cytokines like IL-10 and TGF-β secreted by the HRS cells may be responsible for cytotoxic T-cell inhibition and the induction of fibrosis.53
Taken together, our results support the use of JAK/STAT blockade in combination with other rational agents targeting synergistic pathways, such as PD-L1 inhibitors,43 anti-CD30 therapy,54 or even conventional chemotherapeutic drugs.55 Early-stage clinical trials recently evaluated ruxolitinib as a therapeutic option for relapsed/refractory cHL,29,31 and showed some limited activity in monotherapy. An obvious drawback of these preliminary observations is the lack of previous patient selection or the use of bona fide biomarkers other than 9p24/JAK2 amplification testing in a subset of cases. Our results suggest that inhibition of JAK2 combined with blockade of the PD-1 pathway are rational complementary therapeutic targets for cHL. Formal in situ validation of our data would require additional analyses of longitudinal tumor samples in future clinical trials.
Here, we identify aberrant expression of CSF3R in cHL-derived cell lines and HRS cells in primary tumors as an additional surrogate biomarker of JAK/STAT activation. CSF3R codes for the receptor of granulocyte colony-stimulating factor, a cytokine that controls the production, differentiation, and function of granulocytes (reviewed in Panopoulos and Watowich56). Oncogenic CSF3R mutations are highly prevalent and specific to chronic neutrophilic leukemia and atypical chronic myeloid leukemia.40,41 They can induce JAK/STAT pathway activation in some AMLs.57,58 Recently, several germ line CSF3R variants have been shown to be associated with an increased risk of developing both myeloid and lymphoid malignancies, including cHL.59 HRS cells release many growth factors, such as M-CSF (CSF-1), and can express other related receptor tyrosine kinases, such as CSF1R.60
Recurrent somatic mutations in the CSF3R gene have recently been identified in some AML subsets (CEBPA-mutated).58,61 Consistent with our results, these tumors revealed a uniform and specific sensitivity to JAK inhibitors in double CEBPA/CSF3R mutant leukemia cells, indicating a general sensitization of JAK/STAT signaling when CSF3R-activating mutations arise. Nevertheless, it remains unclear how the aberrant expression of CSF3R and JAK/STAT signaling are connected. To clarify, this would require an exhaustive functional analysis of relationships and regulations.
So far, there are no data about somatic mutations in the CFS3R gene or abnormal expression in cHL or any other B-cell lymphomas. In addition to the JAK/STAT pathway, overactivation by STAT6 and STAT3 mutations, or the recurrent 9p24.1 genomic aberrations, other mechanisms, such as the 1p34 genomic changes reported in cHL and other B-cell lymphomas,62 could result in CSF3R expression and are therefore worth exploring. Here, CSF3R expression is usually patchy and heterogeneous in primary HRS cells and in cell lines, similar to what is usually observed for CD15 expression in this tumor. CD15 is another well-known aberrant myeloid marker of HRS cells, expressed in around 60% to 70% of cHL cases. Here, we noted that CD15 and CSF3R expression in primary HRS cells and in cHL-derived cell lines is usually heterogeneous and does not always overlap. This phenomenon could be related to the complex genetic mechanisms involving aberrant assembly of transcription factors. Previously reported aberrant CSF3R expression in other B-cell neoplasms, its association with genetic lesions of the JAK/STAT pathway, and its relationship with other IHC markers of constitutive JAK/STAT overactivation63,64 need to be investigated further in larger series of tumors.
Overall, our results confirmed that JAK/STAT blockade is a rational therapeutic target for cHL and identified expression of CSF3R as a surrogate biomarker of JAK/STAT overactivation. Among the myriad biological consequences, we identified significant activation of the G2/M checkpoints and MHC pathways and downregulation of most of the tumor-promoting inflammation signatures, suggesting a global reversal of many relevant phenotypic features of this malignancy. The potential synergies of anti-JAK/STAT signaling therapy in cHL need to be explored and clinical validation sought.
Acknowledgments
The authors acknowledge the MD Anderson Biobank and the Spanish Biobank Network, supported by the ISCIII, for their invaluable help with tumor samples and TMAs. The authors also thank Javier Suela, from NIMGenetics, for his invaluable assistance with the gene expression analyses.
This work was supported by the Instituto de Salud Carlos III (ISCIII), cofunded by the European Regional Development Fund/European Social Fund (PI19/00083), Ministerio de Economía, Industria y Competitividad (MINECO) (CIBERONC CB16/12/00291), Dirección General de Universidades e Investigación Consejería de Educación e Investigación de la Comunidad de Madrid (B2017/BMD-3778), and a Roche Foundation Research Grant; V.M. is a recipient of an iPFIS predoctoral fellowship from ISCIII-AES-2020 (FI20/00184).
The funders had no role in the study design, data collection and analysis, decision to publish, or preparation of the manuscript.
Authorship
Contribution: S.F. designed the study, performed the research, and wrote the manuscript; J.L.S., E.D., A.C., and A.M. performed the research; L.M. and G.R. performed the transfection experiments; M.E. and C.M. collected clinical data; S.F., V.M., S.P., and M.L. analyzed and interpreted data and carried out the statistical analysis; J.F.G. designed the study, analyzed and interpreted the data, funded the research, and wrote the manuscript; and all authors critically reviewed and approved the manuscript.
Conflict-of-interest disclosure: The authors declare no competing financial interests.
Correspondence: Juan F. García, Pathology Department, MD Anderson Cancer Center Madrid, Calle Arturo Soria 270, 28033 Madrid, Spain; e-mail: jfgarcia@mdanderson.es.
References
Author notes
Gene expression data are deposited in Gene Expression Omnibus under accession number GSE185818.
Data are available on request from the corresponding author, Juan F. Garcia (jfgarcia@mdanderson.es).
The full-text version of this article contains a data supplement.

