TO THE EDITOR:
Reference ranges for hematological measurements among healthy individuals are essential for accurate interpretation of testing results and clinical decision making.1 The Duffy-null white blood cell (RBC) antigen phenotype [Fy(a-b-)] is associated with lower absolute neutrophil counts (ANCs) compared with individuals with a Duffy-positive phenotype.2 This phenotype results from homozygous carriage of the benign rs2814778-C genetic variant, which disrupts an erythroid-specific promoter, causing loss of the Duffy antigen on the surface of RBCs, and has a high frequency among populations of African ancestries (in African-American subjects, carriage rates can be >60%) and some Middle Eastern populations.3-10
Uncertainty around expected neutrophil counts among individuals of Black race can lead to inaccurate clinical decision making and contribute to health care inequities, including suboptimal medication dosing and excessive diagnostic testing as a result of low ANC.11-16 Ascertaining the Duffy-null RBC genotype or phenotype as a part of the evaluation of neutropenia could improve clinical decision making if expected ANC reference ranges for those with and without the phenotype were established. We describe the distribution of cell counts for the CC genotype (Duffy null) and the CT/TT genotypes among individuals of Black race identified through the Vanderbilt University Medical Center electronic health record–linked DNA biobank resource (BioVU). This study was approved by the Vanderbilt University Medical Center Institutional Review Board.
The final study population comprised 3739 participants without a hematological malignancy and with at least one white blood cell (WBC) or ANC measurement collected during a health maintenance examination. The median age was 36 years, 26% were <18 years old, and 64% were female. There were 2437 participants (65%) with the CC genotype and 1302 (35%) with the CT/TT genotype. Participants with the CC genotype were slightly older (37 vs 35 y) and more likely to be female (66% vs 60%; supplemental Table 1).
Based on an individual’s first available measurement, the median WBC count was 7.0 × 10³ cells per μL and ANC was 3800 cells per μL. Participants with the CC genotype had lower median WBC counts (6.4 vs 8.2 × 10³ cells per μL; difference, 1.8 [95% confidence interval, 1.5-2.0] × 103 cells per μL) and ANC counts (3270 vs 4830 × 103 cells per μL; difference, 1560 [95% confidence interval, 1,384-1,732] cells per μL) than those with the CT or TT (CT/TT) genotypes (supplemental Figure 1). Participants with the CC genotype were also more likely to have an International Classification of Diseases–based clinical billing code of “neutropenia” or “decreased WBC count.” Among participants <18 years of age, the odds ratio of having a neutropenia diagnosis was 7.7 (95% confidence interval, 3.2-20.9), compared with 2.02 (95% confidence interval, 1.4-3.07) for older participants. Counts modestly decreased with increasing age (supplemental Figure 2).
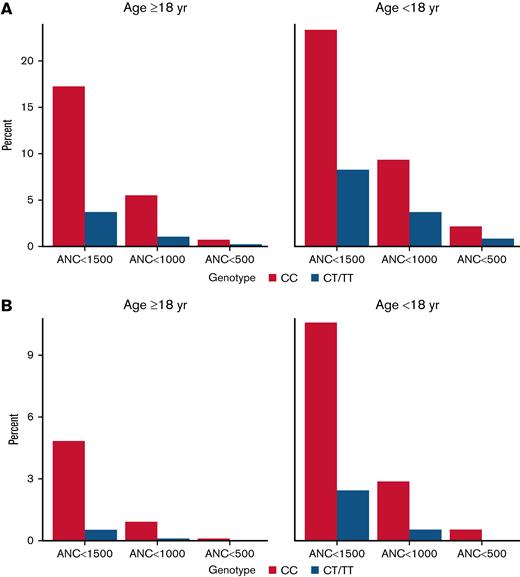
Participants with the CC genotype were more likely to have a measured ANC value lower than commonly recognized clinical thresholds, with 17.3% of adult patients with the CC genotype exhibiting an ANC <1500 cells per μL, 5.5% having an ANC <1000 cells per μL, and 0.8% with an ANC <500 cells per μL. In contrast, among adults with the CT/TT genotype, 3.8%, 1.1%, and 0.2% had a measurement lower than these respective thresholds (Figure 1A). For participants <18 years of age with CC genotype, 23.4%, 9.4%, and 2.2% had ANC values <1500, <1000, or <500, respectively, compared with 8.3%, 3.7%, and 0.8%, respectively, among those with CT/TT genotypes. A similar pattern was seen when examining the first documented ANC value by genotype (Figure 1B) and across more granular age groups (supplemental Figure 3). Results by individual genotype are presented in supplemental Figure 4.
Histograms showing the proportion of participants whose lowest (A) and first (B) ANC measurements were lower than select thresholds, stratified by age. ANC thresholds represent cells per μL.
Histograms showing the proportion of participants whose lowest (A) and first (B) ANC measurements were lower than select thresholds, stratified by age. ANC thresholds represent cells per μL.
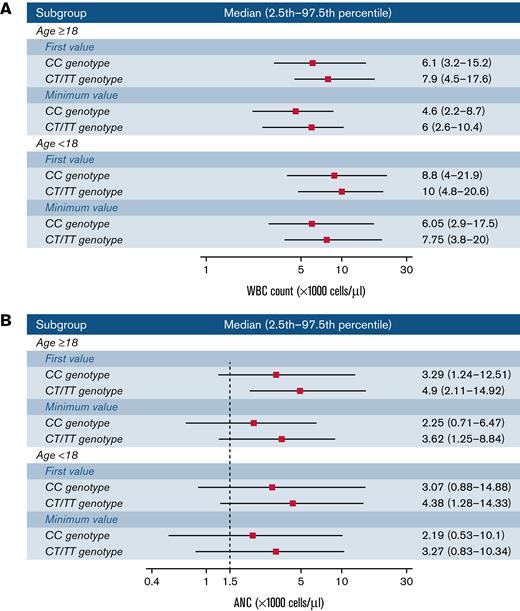
The observed ranges (2.5th to 97.5th percentile) for participants with the CC genotype were lower than those with the CT/TT genotypes for both WBC counts and ANC (Figure 2). For instance, among adults, the percentile range based on first ANC measurements was 1239 to 12 510 cells per μL for the CC genotype vs 2107 to 14 920 cells per μL for the CT/TT genotypes. ANC ranges based on a participant’s lowest measurements were 711 to 6470 and 1250 to 8841 for the CC and CT/TT genotypes, respectively. Ranges for other age subgroups and individual genotype strata are presented in supplemental Figure 5.
Observed ranges for WBC counts (A) and ANC (B) by age group and genotype. Ranges are based on the first or minimum measurement for each participant. The median, 2.5th, and 97.5th percentile thresholds correspond to the overall distribution of values within the indicated population subset.
Observed ranges for WBC counts (A) and ANC (B) by age group and genotype. Ranges are based on the first or minimum measurement for each participant. The median, 2.5th, and 97.5th percentile thresholds correspond to the overall distribution of values within the indicated population subset.
Lower average WBC counts among individuals of African vs European ancestries is well established.17-20 The lower WBC counts among individuals of African ancestry has sometimes led to a generalization that individuals of Black race have “low” WBC counts, colloquially described as “benign ethnic neutropenia.”21,22 Delineation of the molecular basis of this phenomenon has demonstrated that only the subset of individuals who carry the Duffy-null (CC) RBC genotype are expected to have lower counts. However, despite awareness of the Duffy phenotype, a lack of well-defined genotype-specific reference ranges contributes to uncertainty in the interpretation of laboratory measurements and consequent health inequities that disproportionately impact individuals of Black race.
These results highlight that an ANC value lower than the common clinical threshold for neutropenia (<1500 cells per μL) is common among participants with the Duffy-null RBC genotype,22 especially among younger individuals. Furthermore, >5% of these individuals have an ANC <1000 cells per μL. When we examined first measured ANC values, 4.8% of adults with the Duffy-null RBC genotype had an ANC <1500 cells per μL, compared with 0.5% of adults with the other genotypes. These values are comparable to findings reported from African-ancestry populations from the UK Biobank, in which the respective percentages were 5.1% vs 0.3%.23
The current clinical guidelines for evaluating neutropenia include collecting a careful clinical history and physical examination, investigating for signs of infection, and serial monitoring of ANC (≥2 values usually 3-6 months apart) and markers of inflammation such as C-reactive protein. If ANC values remain stable, and in the absence of concerning symptoms, a diagnosis of stable neutropenia may be inferred. However, a race-based inference that the etiology of the neutropenia is the Duffy-null RBC genotype will often be inaccurate.24 We believe that this decision model would be improved if a neutropenia evaluation included measurement of the Duffy-null RBC phenotype/genotype and values were interpreted in the context of genotype-specific reference ranges. This could reduce repeated laboratory testing among those with the Duffy-null RBC genotype and would more promptly and accurately identify those individuals without the Duffy-null RBC genotype for whom a low ANC would not be anticipated based on their genotype.
There are limitations to this study. Even though measurements were collected in conjunction with billing activity related to a routine health maintenance examination, participants could have had symptoms or other findings that prompted an examination of blood counts. In particular, routine laboratory testing is less commonly pursued among younger individuals in the absence of clinical concerns. Although we excluded individuals with a history of malignancy and other diseases that could impact leukocyte counts, disease reporting can be incomplete in biobank data resources.25 There were insufficient data to examine relevant secondary findings such as immature granulocyte fractions.
In summary, for adults with the CC genotype, the lower limit (2.5th percentile) of the ANC distribution is likely between 711 and 1239 cells per μL, compared with 1250 and 2110 cells per μL for the CT/TT genotypes. These reference points may assist providers in determining whether further clinical evaluations are warranted among individuals with low neutrophil count measurements.
Acknowledgments: The authors thank the staff and participants of the BioVU study for their contributions.
This work was supported by National Institutes of Health (NIH) R01 GM130791 (J.D.M.), R01 GM132204 (S.L.V.D), and NHGRI T32 HG008341 (M.B.). Vanderbilt University Medical Center’s BioVU is supported by institutional funding, private agencies, and federal grants. These include NIH-funded Shared Instrumentation Grant S10RR025141; and Clinical Translational Science Award (CTSA) grants UL1TR002243, UL1TR000445, and UL1RR024975. Genomic data are also supported by investigator-led projects that include U01HG004798, R01NS032830, RC2GM092618, P50GM115305, U01HG006378, U19HL065962, and R01HD074711; and additional funding sources listed at https://victr.vumc.org/biovu-funding/.
Contribution: J.D.M. contributed to the study design and data acquisition; J.D.M. and M.B. conducted the analyses and wrote the manuscript; S.L.V.D., S.C.B., C.P.C., and A.L.D. provided scientific guidance and suggestions; and all authors contributed to the final article.
Conflict-of-interest disclosure: The authors declare no competing financial interests.
Correspondence: Jonathan D. Mosley, Department of Medicine and Department of Biomedical Informatics, Vanderbilt University Medical Center, 1285 Medical Research Building IV, Nashville, TN 37232; e-mail: jonathan.d.mosley@vumc.org.
References
Author notes
The online version of this article contains a data supplement.


