Key Points
scRNA-seq data can be used to infer the presence of the major cytogenetic alterations in MM.
Single-cell B-cell receptor profiling along with copy number and transcriptome analysis improves functional dissection of myeloma subclones.
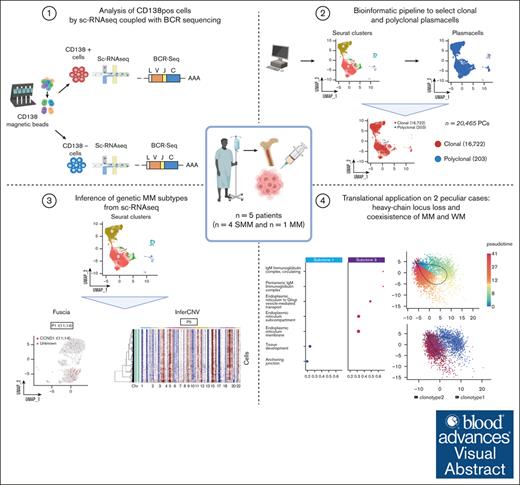
Visual Abstract
Smoldering multiple myeloma (SMM) is an asymptomatic plasma cell (PC) neoplasm that may evolve with variable frequency into multiple myeloma (MM). SMM is initiated by chromosomal translocations involving the immunoglobulin heavy-chain locus or by hyperdiploidy and evolves through acquisition of additional genetic lesions. In this scenario, we aimed at establishing a reliable analysis pipeline to infer genomic lesions from transcriptomic analysis, by combining single-cell RNA sequencing (scRNA-seq) with B-cell receptor sequencing and copy number abnormality (CNA) analysis to identify clonal PCs at the genetic level along their specific transcriptional landscape. We profiled 20 465 bone marrow PCs derived from 5 patients with SMM/MM and unbiasedly identified clonal and polyclonal PCs. Hyperdiploidy, t(11;14), and t(6;14) were identified at the scRNA level by analysis of chimeric reads. Subclone functional analysis was improved by combining transcriptome with CNA analysis. As examples, we illustrate the different functional properties of a light-chain escape subclone in SMM and of different B-cell and PC subclones in a patient affected by Wäldenstrom macroglobulinemia and SMM. Overall, our data provide a proof of principle for inference of clinically relevant genotypic data from scRNA-seq, which in turn will refine functional annotation of the clonal architecture of PC dyscrasias.
Introduction
Multiple myeloma (MM) is a plasma cell (PC) malignancy usually preceded by an asymptomatic expansion of clonal bone marrow (BM) PCs categorized as monoclonal gammopathy of undetermined significance or smoldering MM (SMM).1-4 Although chromosomal translocations involving the immunoglobulin heavy-chain (IgH) locus or hyperdiploidy are considered as MM founding events, secondary events acquired in the context of clonal heterogeneity represent a hallmark of subsequent MM evolution.5 More recently, advances in genomic studies showed how progressive and non-progressive cases can be recognized at the molecular level already in asymptomatic stages6-11 and how the genomic landscape shows evidence of subclonality at MM diagnosis and after treatment.12-16 More than gene mutations, copy number alterations (CNAs) and structural variants contribute to MM evolution as recently highlighted by whole-genome sequencing and whole-exome sequencing studies.10,14-16
Single-cell RNA sequencing (scRNA-seq) allows for the dissection of cellular heterogeneity during the evolution of the disease.17,18 Genomic events have a transcriptional correlate in MM,19 and the wealth of information provided by scRNA-seq could be exploited to infer information on IGH translocations,20 CNAs,21 and gene mutations22 that could be biologically and clinically relevant along with transcriptomic data.
Given the complex and intertwined geno-transcriptomic landscape of MM, we aimed at exploring a comprehensive molecular analysis of scRNA-seq data. Through sequencing of the V(D)J regions of the heavy (IGH) and light (IGK and IGL) chains of the B-cell receptor (BCR) and with a combination of different pipelines, we developed a workflow that generates detailed quantitative functional maps of single-cell geno-transcriptomic states across MM samples. The potential translational application of this analysis is detailed in 5 samples, providing for each an accurate inference of genomic features from RNA-seq data and high-resolution data on single-cell heterogeneity with potential implications for disease evolution at the clinical level.
Materials and methods
Sample collection and cell preparation
Primary BM samples from 5 patients affected by SMM (n = 4) and MM (n = 1) were collected at the Hematology Department of Fondazione IRCCS Ca' Granda Ospedale Maggiore Policlinico (Milan, Italy), between 2020 and 2022, in accordance with International Myeloma Working Group criteria. Detailed workflow is described in supplemental Materials and Methods.
Single-cell library preparation and sequencing
The scRNA-seq libraries were prepared using the 10x Genomics Chromium system (10x Genomics), following the manufacturer instructions for the Single Cell 5' Reagent kits v1.1 (10x Genomics; catalog no. PN-1000165) and Chromium Single-cell V(D)J Enrichment (10x Genomics; catalog no. PN-1000016) protocols (CG000207 Rev B). Details for library preparation and sequencing parameters are described in supplemental Materials and Methods.
Preprocessing and batch correction of scRNA-seq datasets
Cells with <200 and >3000 expressed features and expressing >5% of mitochondrial genes were filtered out. Immunoglobulin genes were removed as well. DoubletFinder (v2.0.4) was used to identify and remove putative doublets in each dataset, with the core statistical parameters (nExp, pN, and pK) determined automatically using the recommended settings for each sample.23 Automatic cell assignment was performed using a published BM annotated atlas from Seurat R package (github.com/satijalab/Seurat). The clonotype information from the scV(D)J-seq was added to the Seurat metadata to identify cells bearing the clonal V(D)J rearrangement or polyclonal V(D)J rearrangements. We then integrated the datasets using the RPCA reduction,24-26 and finally, we proceeded with Seurat standard workflow (v 4.4.0) to analyze the combined datasets. Pipeline parameters are described in supplemental Materials and Methods.
Identification of IGH translocations with Fuscia
We successfully detected chimeric transcript with “Fuscia” from barcoded scRNA-seq (https://github.com/ding-lab/fuscia).20 The software flags transcripts with reads bearing the same cellular barcode and unique molecular identifier that map to different positions on the reference genome. Those “chimeric transcripts” can be strongly associated with translocations. Parameters are described in supplemental Materials and Methods.
InferCNV
We were able to identify chromosomal CNAs in tumor scRNA-seq data with the inferCNV tool (v.1.18.1) on R (inferCNV of the Trinity CTAT project; https://github.com/broadinstitute/inferCNV), also defining subclones in each tumor sample analyzed. Pipeline parameters are described in supplemental Materials and Methods.
clusterProfiler
Differential expressed gene analyses were performed by means of clusterProfiler R package (v. 4.10.1).27 To obtain enriched gene ontology, we used gseGO function with the following parameters: .1 as P value cutoff and Benjamini-Hochberg P adjusted and plotted with DotPlot function.
Pseudotime trajectory inference analysis
The slingshot package was applied to perform the sc-pseudotime inference analysis.28 Unsupervised clusters of cells were generated to uncover the global structure and then this structure was converted into “pseudotime” smooth lineages represented by 1-dimensional variables.
Pseudotime workflow is described in supplemental Materials and Methods.
Single-cell Wäldenstrom macroglobulinemia signature generation
The transcriptomic signature derived from Bagratuni et al.,29 (#GSE235723) was used to generate a specific Wäldenstrom macroglobulinemia (WM) signature. After filtering steps and doublets removal (R package v. 2.0.4), the annotated memory B cells were defined to compute a specific gene expression: (1) using the “wilcoxauc” R function to compare WM memory B cells with healthy donor (HD) cells; and (2) to define a signature of genes significantly upregulated in the WM’s cells (P adjusted < 0.01; log2FC > 1.5). Then, the signature was inferred in our data set, using the “add_module_score” Seurat function.
Cell cycle score estimation
Seurat package's CellCycleScoring function was applied, to assign a G1, S or G2/M phase score at each cell, using the expression levels of known marker genes for each phase. Cell cycle phases were integrated into downstream analysis together with clonotypes information. Relative frequencies of cell cycle phases for the 2 dominant clonotypes of P1 were calculated, and a χ2 test was applied. A bar chart was generated using the R package ggplot2 (v.3.4.4) to visualize the relative frequencies of cell cycle phases for the 2 dominant clonotypes of P1.
This study was approved by the local ethics committee (949/21), and all patients signed written consent in accordance with the Declaration of Helsinki.
Results
Single-cell transcriptional profiles reveal CD138+ cells heterogeneity across patients with MM
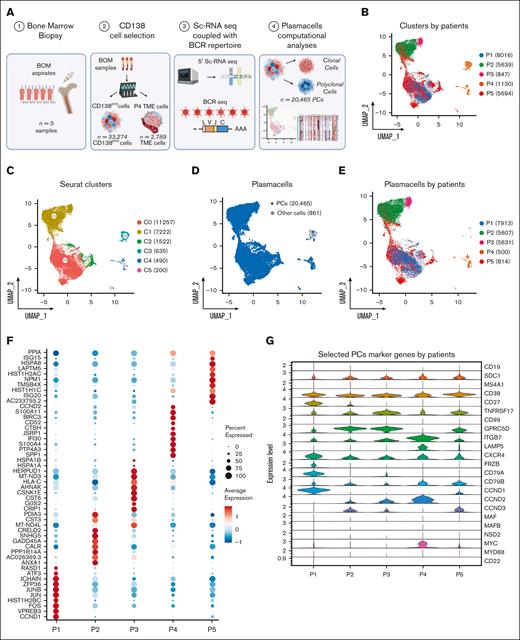
We performed scRNA-seq experiments combined with BCR-sequencing on 33 274 cells isolated from n = 5 BM aspirates of patients affected by SMM (n = 4) or newly diagnosed MM (n = 1; Figure 1A). After quality control and filtering, the final integrated dataset consisted of 21 326 cells (supplemental Figure 1A-D), characterized by a total of 87 839 features, with a median of 17 977 features per sample. Two batches of fresh (n = 7671) and frozen (n = 13 655) cells were integrated by the standard Seurat pipeline, and the Harmony algorithm was applied to prevent any batch effect (supplemental Figure 1E-F). By projecting cells onto a 2-dimensional uniform manifold approximation and projection (UMAP) plot, we observed that most cells from single patients formed separate clusters (Figure 1B). For unsupervised clustering analysis, we interrogated different resolution levels starting from 0.01, defining 0.1 as the optimal level. This revealed 6 clusters (Figure 1C) that only partially overlapped with the patient’s clusters. Using an automated cell assignment method, we identified plasmablasts (n = 20 465 [95.96%]), CD14/CD16 monocytes (n = 618 [2.89%]), B cells (n = 43 [0.2%]), or T cells (n = 171 [0.8%]; supplemental Figure 1G). The remainder of 29 cells (0.13%) included natural killer cells, megakaryocytes, hematopoietic stem cells, red blood cells, granulocyte/monocyte progenitor cells, and dendritic cells (Figure 1D). Therefore, magnetic bead-based enrichment worked at purity levels ranging from 95% to 99% except in patient P4, which was represented by cluster 4 (C4) and C5 mainly. Here, the C4, representing 54% and 69% of the total cells of the patient, was represented mainly by CD14/CD16 monocytes and T cells, indicating low purity (Figure 1D-E). Interestingly, PCs from patients showed different patterns of differential marker genes, highlighting the heterogeneity of the cohort of patients (Figure 1F). Finally, the expression of a panel of selected PC marker genes is shown by violin plots represented in Figure 1G. Here, CCND1 and CCND3 upregulation was observed in samples P1 and P2 with t(11;14) and t(6;14), respectively, as confirmed by fluorescence in situ hybridization (FISH). However, CCND3 as well as CCND2 expression was observed across patients and genetic subgroups. ITGB7, a well-known30 MM high-risk marker, was highly expressed in most samples.
The landscape of SMM and MM PCs at single-cell resolution. (A) Overview of cohort of SMM and MM patients and experimental setup of the study, including CD138 sorting of PCs, 5' scRNA-seq coupled with BCR profiling and bioinformatic pipelines. (B-C) UMAP representation of analyzed cells by patients and by Seurat clusters. (D-E) Selection of PCs after cell assignment (D) and clustering of PCs by patients (E). (F) Dot plot of top 10 marker genes by patients. (G) Violin plot showing the normalized expression levels of 23 representative selected marker genes across the 5 patients.
The landscape of SMM and MM PCs at single-cell resolution. (A) Overview of cohort of SMM and MM patients and experimental setup of the study, including CD138 sorting of PCs, 5' scRNA-seq coupled with BCR profiling and bioinformatic pipelines. (B-C) UMAP representation of analyzed cells by patients and by Seurat clusters. (D-E) Selection of PCs after cell assignment (D) and clustering of PCs by patients (E). (F) Dot plot of top 10 marker genes by patients. (G) Violin plot showing the normalized expression levels of 23 representative selected marker genes across the 5 patients.
Profiling of BCR repertoire and transcriptomic markers of clonality
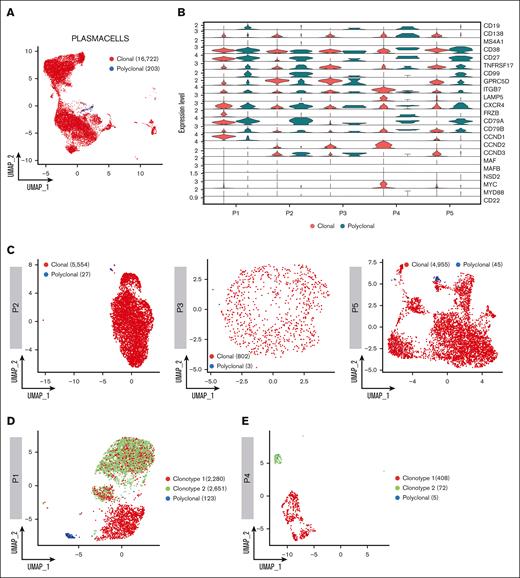
Leveraging single–cell BCR immune repertoire information, 20 465 PCs were investigated, of which 16 722 cells were deemed as clonal and 203 as polyclonal, for subsequent phenotype and clonotype integration (Figure 2A). Overall, our data show that CD138-enriched samples in patients with SMM and MM can carry a substantial number of admixing polyclonal PCs, ranging from 0.51% to 2.62%. Overall, the analysis of clonal vs polyclonal PCs in our cohort highlighted common themes such as the increased expression of GPRC5D and downregulation of CD27 markers in neoplastic PCs as well as patient-specific levels of the ITGB7 integrin in polyclonal PCs. Furthermore, CD19 and CD99 expression specifically identified polyclonal PCs, whereas the clonal counterpart was defined by frizzled related protein (FRZB) and other cyclins genes (Figure 2B). A detailed analysis of clonal and polyclonal cells by BCR analysis (Figure 2C-E) also led to unexpected results; in each of patients P1 and P4, 2 clonal BCR clonotypes were identified. In P1, characterized by a t(11;14) translocation, 5054 (63.86%) of 7913 PCs had an identified V(D)J rearrangement. Of these, 2280 (45.11%) and 2651 cells (52.45%) belonged to 2 distinct, albeit related, clonotypes. Clonotype 1 showed a clonal rearrangement of both the heavy and light chains, whereas clonotype 2 shared the same light-chain sequence but had no heavy-chain rearrangement, suggestive of a “light-chain escape.” Consistently, transcriptomic analysis showed that both clonotypes overexpressed CCND1 (Figure 2F), suggesting they both carried the t(11;14) translocation and were 2 subclones of the same disease. Interestingly, the 2 clonotypes also differed in marker gene expression, because only clonotype 1 showed higher CD20 and MYC expression. Conversely, in P4 the 2 clonotypes, composed of 408 and 72 cells, respectively, segregated far from each other. In retrospect, P4 was found to carry 2 different serum monoclonal proteins, IgA/k and IgM/k, suggesting the 2 clonotypes belonged to different neoplastic conditions, namely SMM and WM, respectively. Indeed, here, clonotype 1 showed overexpression of GPRC5D, CCND2, LAMP5, ITGB7, MYC and CD38, consistent with a MM profile. Clonotype 2 expressed mostly CD27 and CD99, suggesting a WM origin (Figure 2G). This suggests our approach may help refine the study of clonal PCs and may add resolution to the assessment of subclonality. Indeed, the biological causes underlying subclonal clustering would not have been revealed without BCR analysis.
Clonotype assignment across patients. (A) UMAP representing the overall of 5 patients’ BCR profiling, in which clonal and polyclonal cells are represented by red and blue dots, respectively. (B) Violin plot showing the normalized expression levels of representative selected marker genes in clonal and polyclonal cells of each patient. (C) UMAP color coded for clonal and polyclonal cells (red and blue dots, respectively) of P2, P3 and P5 patients. (D-E) Dominant clonotypes of P1 and P4 patients represented by UMAP. Dominant clonotypes are represented by red and green dots and the polyclonal cells by blue dots. (F-G) Violin plots showing the expression levels of PCs representative selected marker genes across the clonotypes of P1 and P4 patients, respectively.
Clonotype assignment across patients. (A) UMAP representing the overall of 5 patients’ BCR profiling, in which clonal and polyclonal cells are represented by red and blue dots, respectively. (B) Violin plot showing the normalized expression levels of representative selected marker genes in clonal and polyclonal cells of each patient. (C) UMAP color coded for clonal and polyclonal cells (red and blue dots, respectively) of P2, P3 and P5 patients. (D-E) Dominant clonotypes of P1 and P4 patients represented by UMAP. Dominant clonotypes are represented by red and green dots and the polyclonal cells by blue dots. (F-G) Violin plots showing the expression levels of PCs representative selected marker genes across the clonotypes of P1 and P4 patients, respectively.
Inference of genetic MM subtypes from scRNA-seq
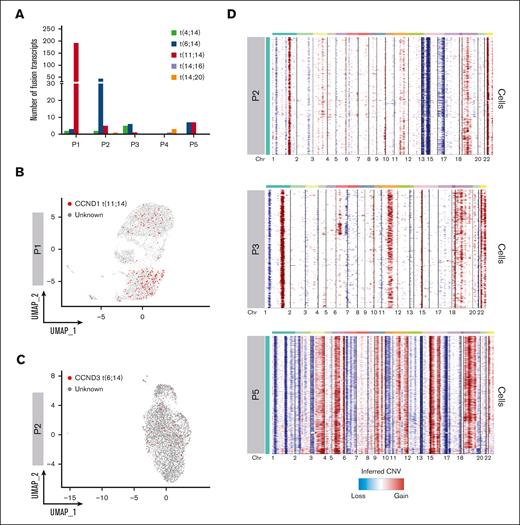
We asked whether we could leverage scRNA-seq data to identify IGH translocation and CNAs at the single-cell level. To map IGH translocations, we used the Fuscia tool.20 Fuscia called few fusion events of different nature across all patients, even in cases with negative FISH results, suggesting there is a baseline noise in the algorithm. However, a specific signal clearly stood out in FISH-translocated cases (Figure 3A). Indeed, we used this “surrogate genetic evidence” by Fuscia to confirm that both dominant BCR clonotypes of sample P1, characterized by the overexpression of CCND1 (Figure 2B,F), derived from a t(11;14) bearing cell. 2.5% of overall cells showed a fusion event, of which 89% belonging to clonotype 1 and 11% to clonotype 2 (Figure 3B). In addition, IGH::CCND3 fusion events were mapped in sample P2 showing high CCND3 expression, demonstrating a t(6;14) (Figure 3C). Fuscia was more a specific tool than a sensitive one, and the number of translocated cells is clearly underestimated. However, this is a promising tool for qualitative assessment of the presence of IGH translocations at the sample level. InferCNV was applied to detect CNAs (Figure 3D). As expected, we found a pattern consistent with hyperdiploidy in non-translocated samples. We observed gains of chromosomes (chrs) 3, 11, 19, and 22 and losses of chrs 1p, 13, and 14 in patient P2. Gains of chrs 1q, 11, 15, 18, 19, and 22 and losses of chr 1p in patient P3. The most complex profile was found in P5, characterized by gains of chrs 3, 5, 7, 9, 15, 19, and 21. Moreover, P5 harbored a clonal 17p loss and chr 11 gain, which was associated with a high expression of CCND1 in the absence of t(11;14). Lastly, not all trisomies were shared by all PCs in each sample, because, for example, chr 19 gain was absent in a fraction of clonal PCs in P2 and P5. Overall, based on these results, we can argue that the simultaneous dissection of the clonal V(D)J rearrangements along with the detection of fusion transcripts, as surrogate for IGH translocations, and CNAs characterization would represent a feasible strategy to correctly define the World Health Organization (WHO) MM subtype and would allow for the dissection of small rare subclones, for example in those cases in which IGH translocations and hyperdiploidy coexist.
Geno-transcriptomic inference of MM subtypes by scRNA-seq. (A) Quantification of Fuscia fusion events across patients and translocation types. (B-C) t(11;14) and t(6;14) fusion transcripts mapped on P1 and P2 UMAP, respectively. The cells characterized by fusion transcripts are highlighted by red dots. (D) CNAs analysis of exemplary patients P2, P3, and P5, not characterized by different dominant clonotypes.
Geno-transcriptomic inference of MM subtypes by scRNA-seq. (A) Quantification of Fuscia fusion events across patients and translocation types. (B-C) t(11;14) and t(6;14) fusion transcripts mapped on P1 and P2 UMAP, respectively. The cells characterized by fusion transcripts are highlighted by red dots. (D) CNAs analysis of exemplary patients P2, P3, and P5, not characterized by different dominant clonotypes.
Identification and functional characterization of heavy-chain locus loss through single-cell sequencing
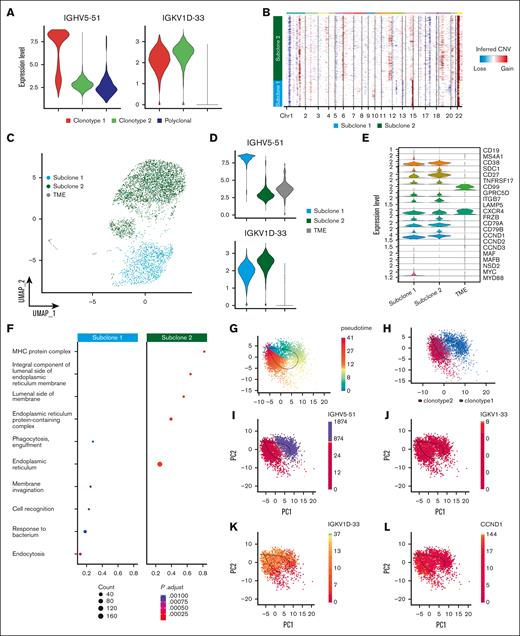
The addition of single-cell BCR and CNA analysis allowed us to further refine this heterogeneity by highlighting the subclonal differences based on V(D)J sequencing and aneuploidies. In sample P1, 2 BCR clonotypes were related, but 1 showed evidence of “light-chain escape” (Figure 4A; supplemental Table 1). InferCNV revealed shared abnormalities such as chr 1p deletion, chr 1q and chr 22 gains but also extensive differences in the tumoral PC compartment, which clustered in 2 different subclones (Figure 4B). Subclone 1 was characterized by gains of chr 9 and losses of chr 12, 13 and 19 and an apparent gain of chr 14q. Gain of chr 11q and chr 19p, as well as loss of chr 5 and chr 17, identified subclone 2. By labeling cells belonging to the 2 CNA-defined subclones in the UMAP space, we observed a perfect overlap between CNA subclones and BCR clonotypes (Figures 2A and 4C). This suggests that the light-chain clone underwent extensive evolution from the ancestral clone, well beyond the simple loss of the IGH locus.
Heavy-chain locus loss characterization. (A) Violin plot of 2 MM BCR clonotypes of sample P1, representing the expression of heavy and light chains in each clonotype. Clonotype 1 is represented in red, clonotype 2 in green, and polyclonal cells in blue. (B) CNAs inferred by inferCNV pipeline, to define functional differences between the 2 tumor clonotypes. Subclone 1 is represented in light blue and subclone 2 in green. (C) Color coded map of subclones distribution in the UMAP space, with the same color code of panel B. Tumor microenvironment (TME) is shown in gray. (D) Violin plot representing the expression of heavy and light chain in each subclone. (E) Analysis of marker genes by subclone is represented by violin plots. (F) Pathway enrichment analysis, comparing the transcriptional profiles of CNAs subclones, (.1 as P value cutoff; Padjusted (Padj) method by Benjamini-Hochberg; see “Materials and Methods”). (G-K) After normalization and projection on a reduced-dimensional space (using UMAP), the cells were colored by pseudotime inference (G), clonotype origin (H), IGHV5-51 gene expression (I), IGKV1-33 gene expression (J), IGKV1D-33 gene expression (K) and CCND1 gene expression (L). Each model is fitted using the trajectory inferred by slingshot.
Heavy-chain locus loss characterization. (A) Violin plot of 2 MM BCR clonotypes of sample P1, representing the expression of heavy and light chains in each clonotype. Clonotype 1 is represented in red, clonotype 2 in green, and polyclonal cells in blue. (B) CNAs inferred by inferCNV pipeline, to define functional differences between the 2 tumor clonotypes. Subclone 1 is represented in light blue and subclone 2 in green. (C) Color coded map of subclones distribution in the UMAP space, with the same color code of panel B. Tumor microenvironment (TME) is shown in gray. (D) Violin plot representing the expression of heavy and light chain in each subclone. (E) Analysis of marker genes by subclone is represented by violin plots. (F) Pathway enrichment analysis, comparing the transcriptional profiles of CNAs subclones, (.1 as P value cutoff; Padjusted (Padj) method by Benjamini-Hochberg; see “Materials and Methods”). (G-K) After normalization and projection on a reduced-dimensional space (using UMAP), the cells were colored by pseudotime inference (G), clonotype origin (H), IGHV5-51 gene expression (I), IGKV1-33 gene expression (J), IGKV1D-33 gene expression (K) and CCND1 gene expression (L). Each model is fitted using the trajectory inferred by slingshot.
Indeed, the transcriptomic analysis alone could not explain the different distribution of the 2 subclones in the UMAP space, whereas our inferred genotypic analysis provided a clear biological explanation. The apparent gain of chr 14q in subclone 1 is simply explained by the high expression of the IGH gamma chain of clonotype 1 (Figure 4A,D). Conversely, subclone 2 shows a very weak expression from the IGH locus, while retaining the expression of the light chain (Figure 4A,D). CCND1 was clearly overexpressed by both subclones, but more in subclone 2 (Figure 4E), in which a chr 11 gain could explain this phenomenon (Figure 4B). Subclone 1 overexpressed CD20 (MS4A1) and MYC due to a t(8;14) translocation that was lost in subclone 2 (supplemental Figure 2A), highlighting clear functional divergences between the 2 subclones. Functional properties of the 2 subclones were further investigated through pathway enrichment analysis (Figure 4F), in which we found a significant over-representation of cellular processes related to Major Histocompatibility Complex (MHC) complex and protein processing in the endoplasmic reticulum in subclone 2. Consistent with lack of proliferative pathway enrichment in clonotype 2, cell cycle analysis also did not show an enrichment in cells in S phase in this cluster, suggesting that this spontaneous evolution did not confer an intrinsically more aggressive phenotype to the cells (supplemental Figure 2B).
Based on the geno-trascriptomic analysis that we performed, clonotype 1 and clonotype 2 represent a linear evolution of the same ancestral clone. Based on this assumption, we applied an RNA velocity algorithm aiming to ask whether cell states could recapitulate clonal evolution. Indeed, the pseudotime depicted a trajectory starting from cells harboring the complete immunoglobulin rearrangement, flowing to cells characterized by the IGH chain loss (Figure 4G-K), corroborating the view of a linear evolution of the MM subclones. Of note, this was also demonstrated by the spatial localization of the 2 clonotypes, the differences in gene expression of heavy- and light-chain genes and CCND1. Overall, this peculiar P1 MM case highlights that inferring genomic data from scRNA-seq is feasible, reliable and pivotal to better explain the subclonal architecture and evolution of SMM.
Differential analysis of inter--tumor heterogeneity of PCs and B cells in SMM and WM from the same patient
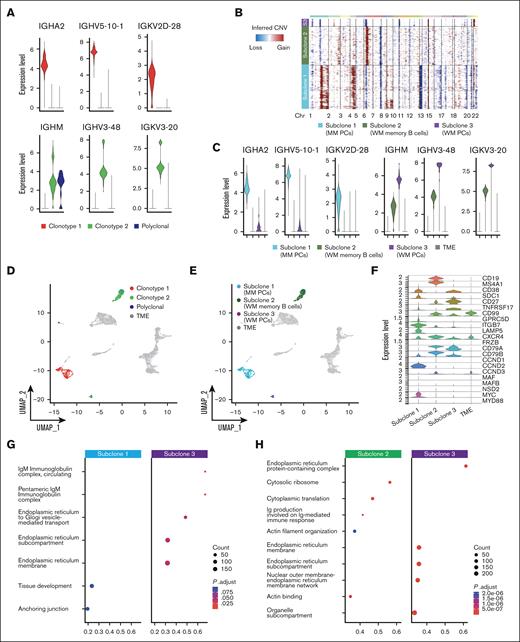
We next applied our genomic-transcriptomic analysis to P4, characterized by 2 entirely different tumoral clones related to the co-existence of WM and SMM. A BM biopsy showed a dual infiltration of clonal PCs and clonal lymphoplasmacytoid cells. Therefore, to also study the lymphoid compartment, we integrated scRNA-seq analysis of CD138+ and CD138– cell populations. Again, BCR analysis showed 2 populations with completely different BCR rearrangements (supplemental Table 2). This was also highlighted by the expression of different heavy-chain isotypes by the 2 populations, namely IgA and IgM, which did not share any protein identity (Figure 5A). CNA profiles were inferred for both clonotypes (Figure 5B), revealing 3 different CNA subclones: subclone 1, corresponding to the MM population, and subclones 2 and 3, represented by B cells and PCs of the WM clone, respectively. MM PCs (subclone 1) were characterized by amp1q, amp4, del13, and del16q, typically seen in MM. WM B cells and PCs shared del1p. Then, WM B cells also showed private abnormalities, such as chr 6 and chr 2q amplifications and 7q deletions (Figure 5B). This suggests an independent clonal origin of the 2 neoplasms and a shared ancestor for WM cells followed by cell type–specific evolution in B cells and PCs. Expression levels of clonal Ig in the different subclones paralleled their belonging to the WM and MM diseases (Figure 5C), showing perfect correlation with the clonotypes identified by V(D)J analysis. When projecting the V(D)J clonotypes and CNV subclones back to the UMAP containing all P4 cells (CD138+ and CD138– fractions), we observed that the PCs were separated based on their clonal origin (MM vs WM), whereas WM memory B cells clustered together (Figure 5D-E). On the other end, cells from clonotype 2 were separated based on their phenotype in B cells (subclone 2) and PCs (subclone 3).
PCs and B cells in SMM and WM of patient P4. (A) Violin plot of BCR clonotypes of sample P4, representing the expression of heavy and light chains in each clonotype of SMM and WM cells. Clonotype 1 is represented in red, clonotype 2 in green, and polyclonal cells in blue. (B) CNAs analyzed by InferCNV pipeline, defining 3 different clonotypes: subclone 1 (MM PCs) is represented in light blue, subclone 2 (WM memory B cells) in green, and subclone 3 (WM PCs) in violet. (C) Violin plot representing the expression of heavy and light chain in each MM and WM subclones and in TME, represented in gray. (D-E) Color coded map of clonotypes and MM and WM subclones distribution in the UMAP space, with the same color code of panel B. TME is shown in gray. (F) Violin plot showing the expression of selected marker genes by subclones. (G-H) Pathway enrichment analysis, showing the comparison of transcriptional profiles of MM PCs vs WM PCs (G) and WM memory B cells vs WM PCs (H) (.1 as P value cutoff; Padj method by Benjamini-Hochberg; see “Materials and Methods”).
PCs and B cells in SMM and WM of patient P4. (A) Violin plot of BCR clonotypes of sample P4, representing the expression of heavy and light chains in each clonotype of SMM and WM cells. Clonotype 1 is represented in red, clonotype 2 in green, and polyclonal cells in blue. (B) CNAs analyzed by InferCNV pipeline, defining 3 different clonotypes: subclone 1 (MM PCs) is represented in light blue, subclone 2 (WM memory B cells) in green, and subclone 3 (WM PCs) in violet. (C) Violin plot representing the expression of heavy and light chain in each MM and WM subclones and in TME, represented in gray. (D-E) Color coded map of clonotypes and MM and WM subclones distribution in the UMAP space, with the same color code of panel B. TME is shown in gray. (F) Violin plot showing the expression of selected marker genes by subclones. (G-H) Pathway enrichment analysis, showing the comparison of transcriptional profiles of MM PCs vs WM PCs (G) and WM memory B cells vs WM PCs (H) (.1 as P value cutoff; Padj method by Benjamini-Hochberg; see “Materials and Methods”).
Comparative gene expression analyses of marker genes identified significant upregulation of SDC1, GPRC5D, ITGB7, LAMP5, CCND2 and MYC in MM PCs, which is consistent with a MM transcriptomic profile. In contrast, expression levels of CD27, TNFRSF17, CD99, CD79A and CD79B were significantly elevated in WM PCs, consistent with a more physiological phenotype and marking clear differences with clonal MM PCs. Subclone 2 (WM-B cells) was characterized by a specific over-expression of CD19, MS4A1 and CCND3 marker genes, typical of B cells, whereas upregulation of CD79A, CD79B, CXCR4, CD99 and CD27 was shared with subclone 3, although at different levels (Figure 5F). Gene set enrichment analysis of gene ontology showed how WM PCs were enriched for IgM processing related pathways, whereas proliferation and microenvironment related pathways characterized MM PCs (Figure 5G). WM PCs showed enrichment for pathways involving the endoplasmic reticulum, as expected for antibody-producing cells. In contrary, WM B cells showed upregulation, among others, of pathways involved in B-cell affinity maturation through somatic differentiation of immunoglobulins (Figure 5H).
Overall, our analysis suggests that scRNA-seq can accurately overcome heterogeneity of BM population, suggesting that a gene expression signature can be obtained with superior results from such data. To demonstrate this, we extracted a WM-specific expression signature from a recently published study by Bagratuni et al,29 in which CD19+ cells from 6 patients with WM were compared with 2 BM samples from healthy donors (supplemental Figure 3; supplemental Table 3). The resulting 11-gene signature was then inferred in our data set. Of note, this signature resulted highly specific only for PCs and memory B cells derived from the WM part of the P4 sample, and not for clonal or polyclonal PCs or B cells from the other samples.
Discussion
In this study, we explored a strategy to maximize the output of scRNA-seq to deeply dissect heterogeneity of PCs and its biological implications for MM, focusing on post--sequencing interpretation processes. Previously published observations report that single-cell V(D)J analysis may be used to find rare clonal cells to accurately infer myeloma evolution.11,19,31-33 Although genomic and transcriptomic profiles of PCs are well documented in MM, the informative potential derived from integration of such data at the single-cell level is under-explored.
Our approach is robust and can be applied to fresh and frozen samples with little need for batch correction. ScRNA-seq can identify samples in which CD138 purification failed and warn about false-negative FISH results. Furthermore, the addition of BCR sequencing adds precision in identifying clonal vs polyclonal PCs, another crucial aspect for FISH and bulk sequencing, especially in asymptomatic MM stages in which the percentage of polyclonal cells is higher on average. Interestingly, in our limited sample cohort, we found a variable separation of polyclonal PCs from clonal ones in the transcriptomic space, with considerable admixture in some cases. Although marker genes separated clonal and polyclonal PCs quite well on average, this finding prompts further studies in which more samples and more polyclonal PCs are analyzed to assess their functional properties.
Our approach included a transcriptome-based genotyping through the addition of CNA and IGH translocation analysis: this allowed for the categorization of all cases into WHO genetic subtypes from the raw scRNA-seq data, without the need for extra, ad hoc sample preparation. CNA analysis also corroborated previous findings that suggested how trisomies are not acquired simultaneously in hyperdiploid cases16,21 because not all samples presented the entire array of trisomic chromosomes in each cell. Furthermore, addition of genotyping information improved clustering of subclones in the UMAP space, which was not explainable by transcriptomic data alone as in sample P1, in which a subclone evolved by heavy-chain loss and acquisition of further aneuploidies. Our data show the potential of scRNA-seq analysis to analyze features of light-chain–only subclones when invisible by biochemical methods at the SMM stage, in which they are poorly described, and during the spontaneous evolution of the disease. We found a cMYC and CD20 expression restricted to the intact IGH clone, owing to the loss of a subclonal IGH::MYC translocation in the light-chain-only clone. This adds complexity to the notion that MYC translocations are subclonal events selected in evolution and points at gross differences in functional properties of the subclones.
This advantage of scRNA-seq was also exemplified in sample P4, in which BCR analysis confirmed the presence of 2 unrelated clonal populations, 1 pertaining to SMM and a second to WM with unrelated V(D)J sequences. Furthermore, although SMM clonal cells were represented by PCs only, the clonal WM cells were both B cells and PCs, as the disease biology would suggest. Intriguingly, we found that WM PCs have a transcriptomic profile more similar to normal than to MM PCs. Conversely, differences between WM B cells and PCs pointed at antigen-receptor pathways in the former and immunoglobulin production in the latter. This may have important clinical implications because it may suggest a differential effect on WM of proteasome inhibitors, which are more effective against PCs, characterized by endoplasmic reticulum stress and unfolded protein response, and Bruton tyrosine kinase inhibitors, which are more effective toward B cells in which BCR signaling is needed for oncogenesis. Further, potential translational applications of scRNA-seq reside in the characterization of the immune microenvironment, which has relevance for the response to novel immunotherapies34,35 and in the functional characterization of minimal residual disease at the single-cell level.
Altogether, our approach represents a proof of concept of how scRNA-seq approaches for the genotyping of the transcriptome can return biological and translational information. Nevertheless, 1 limitation of our study resides in the small sample size, especially given the heterogeneity of SMM and MM. Furthermore, scRNA-seq is a research-only approach that cannot be applied in routine clinical practice in its present form. However, validation of findings in larger cohorts may prompt ad hoc, clinical-grade strategies to investigate transcriptomic features of clonal cells for clinical management.
In conclusion, we show initial evidence that scRNA-seq is amenable to inference of genomic information with clinical value in MM, with implications for disease biology and clinical management. Indeed, fields such as the study of the cell of origin of MM, the dynamics of clonal evolution, the persistence or re-emergence of minimal residual disease after treatment and the microenvironment correlates to immunotherapy responses could all benefit from a deeper dissection of clonal and reactive BM cells in MM. Further studies with more samples will be needed to corroborate our initial observations, which nevertheless propose a more accurate analysis strategy for scRNA-seq experiments.
Acknowledgments
This work was supported by the European Research Council under the European Union’s Horizon 2020 research and innovation program (grant agreement number 817997) and Associazione Italiana Ricerca sul Cancro (grant IG25739). M.C.D.V. was funded by Umberto Veronesi Foundation and Pfizer Global Medical Grants (grant tracking number 75340503). This study was supported in part by Italian Ministry of Health, current research IRCCS.
The workflow image was created with BioRender.com. Adobe Photoshop and Adobe Illustrator were used for images preparation.
Authorship
Contribution: N.B. conceived the project and designed the experiments; N.B., M.C.D.V., C.D.M., and L. Pettine, enrolled and followed up patients and acquired data; M.C.D.V., F.L., A. Matera, and A. Maeda, performed single-cell experiments; A. Marella verified the raw data before analyses and performed preprocessing bioinformatic analysis; M.C.D.V., F.L., A. Matera, G.C., and M.L., performed the bioinformatic analysis and interpreted data; M.L., E.T., G.F., V.T., I.S., D.R., S.P., S.F., S.L., M.B., M.S., A.N., F.T., and F.P., contributed with scientific discussions; L. Porretti and F.C. performed the flow cytometry experiments; and N.B., F.L., A. Matera, M.C.D.V., and M.L. wrote the manuscript, which has been revised by all the authors.
Conflict-of-interest disclosure: N.B. received honoraria from Amgen, GlaxoSmithKline (GSK), Janssen, Jazz, Pfizer, and Takeda. M.C.D.V. served on advisory board for Takeda; and speakers bureau for Janssen and GSK. F.P. received honoraria during the last 2 years for lectures from Novartis, Bristol Myers Squibb, AbbVie, GSK, Janssen, and AOP Orphan; and advisory boards fees from Novartis, Bristol Myers Squibb/Celgene, GSK, AbbVie, AOP Orphan, Janssen, Karyopharm, Kyowa Kirin and MEI, Sumitomo, and Kartos. The remaining authors declare no competing financial interests.
Correspondence: Niccolò Bolli, Hematology Unit, Fondazione IRCCS Ca' Granda Ospedale Maggiore Policlinico, Via Francesco Sforza 35, 20122, Milan, Italy; email: niccolo.bolli@unimi.it.
References
Author notes
F.L. and A. Matera contributed equally to this study.
M.C.D.V. and N.B. are joint last authors.
Access to the original data will be allowed upon approval of an adequate request from the corresponding author, Niccolò Bolli (niccolo.bolli@unimi.it). All biological samples and patients’ data have been deidentified.
The full-text version of this article contains a data supplement.

