Page 476: In Table 2, the column headings have been updated with their staining markers for clarity and include updates to B cells (CD19+), T cells (CD3+), dendritic cells (CD83+CD3−), monocytes (CD14+), CD4+CD3+, CD8+CD3+, CD3+TCRαβ+, CD3+TCRγδ+, natural killer (NK)–like T cells (CD3+CD16+CD56+), and NK cells (CD3−CD56+CD16+). Due to a formatting error, the percentages of CD3−CD16+CD56+ NK cells are incorrect for patients 1 to 6 and 7_2 to 9. Also, the percentage of CD3+TCRγδ+ cells for patient 4 is 0.69%, not 69%; the percentage of CD3+CD8+ cells for patient 6 is 69.6%, not 69.8%; and the percentage of CD3+TCRαβ+ cells for patient 6_2 is 71.9%, not 71.6%.
In the column “Total no. of cells frozen,” the exponent values have been changed from a 1 × ex to a 1 × 10x format for clarity, and those values where the exponent was excluded have been corrected.
The staining percentage values and the enzyme-linked immunospot assay (ELISPOT) average values have been corrected due to a missing cell, a result of the formatting error cited above. The ELISPOT values have been revised as the number of spot-forming units per well from a minimum of 1 × 10⁵ cells per well.
The corrected Table 2 is shown below.
Product characterization
| Patient ID . | B cells CD19+ . | T cells CD3+ . | CD4+ CD3+ . | CD8+ CD3+ . | CD3+ CD16+ CD56+ . | CD3- CD56+ CD16+ . | CD3+ TCRab . | CD3+ TCRgd . | Mono CD14+ . | DCs CD83+ CD3- . | Actin . | WT1 . | Prame . | Survivin . | TAA∗ . | Fold expansion . | Total No. of cells Frozen . |
|---|---|---|---|---|---|---|---|---|---|---|---|---|---|---|---|---|---|
| Percentage (%) | Average Spot Forming Units per well | ||||||||||||||||
| P1 | 0 | 99.5 | 10.9 | 29.3 | 42 | 0 | 16.3 | 73.5 | 0.3 | 0 | 7 | 14 | 182 | 2 | 156 | 23.2 | 1.39x10⁸ |
| P2 | 0.2 | 99.1 | 16.9 | 81.6 | 2.2 | 0.3 | 91.8 | 0.69 | 0.2 | 0 | 1 | 0.5 | 5 | 0 | 5.5 | 12.3 | 2.45x10⁸ |
| P3 | 1.58 | 84.9 | 10.2 | 74.6 | 52.3 | 0.92 | 80.3 | 4.1 | 1.08 | 0.16 | 154.5 | 139 | 696.7 | 132.5 | 741.6 | 5.91 | 1.36x10⁸ |
| P4 | 0 | 84.5 | 20 | 39 | 25 | 0.52 | 66 | 23.1 | 0 | 0 | 5.5 | 10.5 | 72.5 | 5 | 48 | 5 | 1.0x10⁸ |
| P5 | 0.05 | 83.3 | 1.74 | 42.7 | 23.7 | 14.8 | 45.3 | 42.2 | 0.01 | 0.04 | 3.5 | 5 | 4 | 1 | 25.5 | 4.92 | 9.35x10⁷ |
| P6 | 0.1 | 80.9 | 4.8 | 69.6 | 27.9 | 16.8 | 82.7 | 12.3 | 0 | 0 | 2.5 | 16 | 234 | 2 | 182.5 | 3.86 | 1.39x10⁸ |
| P6_2 | 0 | 97.3 | 7.1 | 77 | 58.3 | 2.6 | 71.9 | 26 | 0 | 0 | 7.5 | 15 | 12 | 5 | 27 | 4.1 | 4.95x10⁷ |
| P7 | 0 | 99.3 | 10.4 | 85.4 | 1.44 | 0.17 | 94.1 | 4 | 0 | 0 | 18.5 | 24.5 | 15.5 | 30 | 20.5 | 5.57 | 3.34x10⁷ |
| P7_2 | 0.07 | 96 | 20 | 75.7 | 45.1 | 4.15 | 87.4 | 11.5 | 0 | 0.02 | 12.5 | 8 | 10 | 6 | 9 | 1.83 | 1.30x10⁸ |
| P8 | 0.3 | 98 | 1.73 | 43.3 | 33.7 | 1.1 | 39.5 | 58 | 0.1 | 0 | 7.5 | 37 | 67 | 18 | 22 | 5.97 | 1.88x10⁸ |
| P9 | 0.05 | 98.3 | 9.5 | 87.5 | 11.2 | 0.6 | 97.5 | 1.9 | 0 | 0.02 | 9.5 | 11 | 16 | 9 | 11.5 | 6.52 | 1.37x10⁸ |
| P10 | 0.09 | 99.5 | 11.8 | 69.5 | 3.59 | 0 | 81.4 | 16.1 | 0 | 0 | 1.5 | 15.5 | 1 | 14 | 10.5 | 2.31 | 4.38x10⁷ |
Data for additional product runs for individual patients are labeled as “Patient(no.)_2.“
TAA represents Spot forming cells (SFC) in response to mixture of WT1, PRAME and Survivin added to the same experimental well.
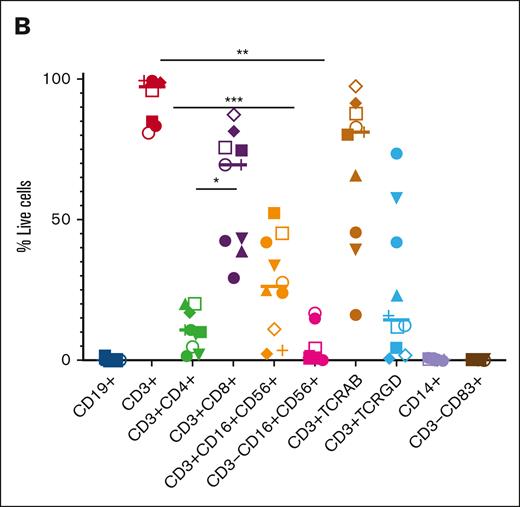
In Figure 1B, the labels on the x-axis have been updated to accurately reflect the various cell types by the staining antibodies used to characterize the product. The authors believe this is a more accurate characterization of the cell types within the product since defining NK and NK-T cells would require further detailed staining, which was not done for this article. The updated Figure 1B is shown below.
Phenotype of TAA-T products. (B) Immunophenotype of the TAA-T products (n = 10).
Phenotype of TAA-T products. (B) Immunophenotype of the TAA-T products (n = 10).
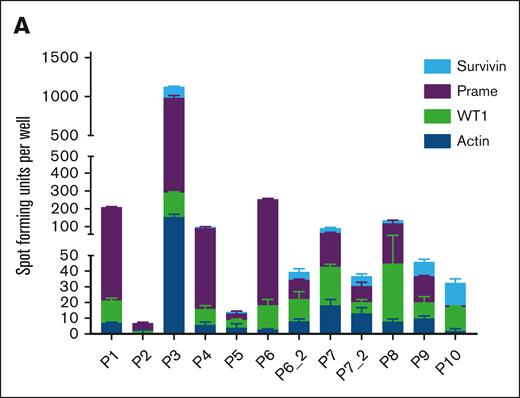
Page 477: in Figure 2A, the bar graphs for P1 (WT1, PRAME, TAA), P2 (actin and WT1), and P3 (PRAME and TAA) have been updated with the correct spot count for ELISPOT wells which had an excess confluence of spots. This formula had already been applied to the other patient ELISPOT samples. The corrected Figure 2A is shown below.
Functional characterization of TAA-T products. (A) Tumor antigen specificity as measured by IFNγ ELISPOT assay of the 12 infused products after overnight restimulation with overlapping 15mer pepmixes of actin (irrelevant control antigen), WT1, PRAME, and survivin.
Functional characterization of TAA-T products. (A) Tumor antigen specificity as measured by IFNγ ELISPOT assay of the 12 infused products after overnight restimulation with overlapping 15mer pepmixes of actin (irrelevant control antigen), WT1, PRAME, and survivin.
Page 482: in Figure 6D, the dot plots for the CD3+CD8+ population have been updated for actin, PRAME, and survivin for week 2 and month 3. Also, the x- and y-axis labels have been updated due to a publishing formatting error which placed the CD8+ and CD4+ axis labels on the same graph. The corrected Figure 6D is shown below.
Impact of nivolumab on persistence of functional TAA-T cells. (D) Representative plot of patient demonstrating recovery of in vivo polyfunctional CD4+ and CD8+ TAA-T cells secreting both IFNγ and TNFα was detected after brief ex vivo expansion after restimulation with antigens at several follow-up time points.
Impact of nivolumab on persistence of functional TAA-T cells. (D) Representative plot of patient demonstrating recovery of in vivo polyfunctional CD4+ and CD8+ TAA-T cells secreting both IFNγ and TNFα was detected after brief ex vivo expansion after restimulation with antigens at several follow-up time points.
In supplemental File 1, the following sentence should be added to the paragraph under the heading “IFN-γ enzyme-linked immunospot (ELISpot) assay” on page 3: “Specificity was identified as a response 5 spot-forming units per well above the number for the actin control for the respective experiment.”


