Key Points
Baseline FLC burden does not affect the depth of response in patients with newly diagnosed AL amyloidosis treated with DaraCyBorD.
We find limitations of the Mayo 2012 staging system in the era of bortezomib- and daratumumab-based therapies.
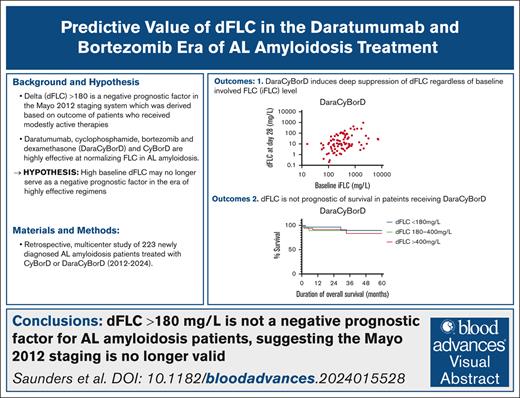
Visual Abstract
A difference between involved and uninvolved free light chains (dFLC) ≥180 mg/L is part of the 2012 Mayo staging system for amyloid light chain (AL) amyloidosis given its negative impact on overall survival (OS). However, none of the 758 patients evaluated to develop and validate this staging system received bortezomib or daratumumab-containing regimens. Over the past 2 decades, cyclophosphamide-bortezomib-dexamethasone (CyBorD) and, more recently, daratumumab-CyBorD (DaraCyBorD) have become cornerstone treatments for AL amyloidosis, demonstrating high efficacy in rapidly normalizing FLC levels. We hypothesized that, in patients with newly diagnosed AL amyloidosis treated with bortezomib- and daratumumab-based regimens, a baseline high FLC burden may no longer predict adverse prognosis. In this retrospective, multicenter study of 223 patients with newly diagnosed AL amyloidosis treated with CyBorD or DaraCyBorD therapy, we investigated (1) the association between baseline involved FLC and dFLC hematologic response at 28 days and 3, 6, 9, and 12 months after the commencement of therapy; (2) the OS of patients with baseline low (<180 mg/L), medium (180-400 mg/L), and high (>400 mg/L) dFLC; and (3) the prognostic value of bone marrow plasma cell burden in determining response to CyBorD or DaraCyBorD therapy and OS and, finally, the prognostic value of the 2012 Mayo staging system in the CyBorD and DaraCyBorD cohorts. Our findings suggest that a dFLC of >180 mg/L no longer holds prognostic value in the era of CyBorD/DaraCyBorD–based AL amyloidosis therapy and question the utility of the Mayo 2012 staging system in the era of highly effective chemoimmunotherapies.
Introduction
Systemic amyloid light chain (AL) amyloidosis is a plasma cell disorder characterized by the overproduction and deposition of misfolded immunoglobulin free light chains (FLCs), which aggregate into amyloid fibrils within target organs.1 AL amyloid fibrils cause organ dysfunction by distorting tissue architecture, and FLC is directly cytotoxic to the heart.2 Accordingly, patient outcomes are associated with the severity of cardiac involvement.3 This is reflected in validated AL amyloidosis staging systems, which incorporate cardiac biomarkers, including serum levels of cardiac troponins (ie, troponin T [TnT] or I) and brain natriuretic peptide and its N-terminal pro-brain natriuretic peptide (NT-proBNP).4-7
In 2012, the Mayo Clinic revised their 2004 staging system, adding the difference between involved FLC (iFLC) and uninvolved FLC (uFLC) (dFLC of ≥180 mg/L) as an adverse prognostic factor, weighted equally with cardiac biomarkers.8 The inclusion of dFLC presumably captured the adverse impact of the high burden of circulating FLC.9 The staging was validated with clinical groups who received either an autologous stem cell transplant or 1 of 3 therapeutic regimens (lenalidomide plus minus dexamethasone; lenalidomide-cyclophosphamide-dexamethasone or pomalidomide-dexamethasone).9 None of the patients evaluated received a bortezomib- or daratumumab-containing regimen as frontline treatment.
In the past decade, a transformative shift has occurred in the treatment landscape of AL amyloidosis. ALs have been recognized as intrinsic plasma cell stressors, predisposing diseased plasma cells to proteasome inhibitor sensitivity, higher even than that of myeloma plasma cells.10 Bortezomib has become a cornerstone of treatment for patients with AL amyloidosis as proven by the previously unseen activity of cyclophosphamide-bortezomib-dexamethasone (CyBorD), becoming the de facto standard of care treatment for these patients.11,12 More recently, after the ANDROMEDA study, daratumumab-CyBorD (DaraCyBorD) received US Food and Drug Administration (FDA) approval for patients with newly diagnosed stage 1 to 3A AL amyloidosis owing to its significant improvement in time to complete hematologic response (60 days in the daratumumab group vs 85 days in the CyBorD group), progression-free survival, and organ response compared with CyBorD itself.13
With rapidly cytoreductive therapies available, recent studies have shown that patients with high baseline FLC achieve CR rates comparable with those with low baseline FLC levels when treated with daratumumab-based frontline therapies.14,15
We hypothesize that baseline FLC burden does not affect the depth of hematologic remission or overall survival (OS) in patients with AL amyloidosis treated with CyBorD or DaraCyBorD, questioning the utility of the Mayo 2012 staging system in the era of highly effective, rapidly cytoreductive therapies.15 A recent study by Khwaja et al15 supports this hypothesis, demonstrating the limited utility of the Mayo 2012 cardiac staging system for risk stratification in patients with advanced cardiac AL amyloidosis treated with CyBorD. We set out to interrogate the prognostic value of baseline FLC in the current therapeutic era.
Methods
Study populations
This is a retrospective, multicenter study including 223 patients with newly diagnosed AL amyloidosis seen at the Dana Farber Cancer Institute, Boston, MA, or the National Kapodistrian University of Athens Hospital, Athens, Greece, between 2012 and 2024 who received frontline therapy with either CyBorD or DaraCyBorD. The epidemiologic data are presented in Table 1. We included only patients with FLC levels measured at baseline, before therapy initiation, and at the completion of cycle 1 (day 28). FLC levels were also obtained for 3, 6, 9, and 12 months from the commencement of therapy. The cutoff for our analysis was 28 July 2024. All patients fulfilled criteria for AL amyloidosis based on the presence of a plasma cell disorder and tissue-biopsy proven light chain amyloid deposition, according to consensus criteria. Patients meeting the CRAB criteria for concurrent multiple myeloma were excluded from this analysis. All patients provided a written consent for anonymized data collection. The study was institutional review board approved at the Dana Farber Cancer Institute and the “Alexandra” Hospital in Athens.
Demographics and disease characteristics of patients at baseline
| Characteristic . | CyBorD group (n = 132) . | DaraCyBorD group (n = 91) . |
|---|---|---|
| Age, median, y (range) | 64 (39-87) | 64 (38-82) |
| Sex, n (%) | ||
| Male | 75 (57) | 47 (52) |
| Female | 57 (43) | 44 (48) |
| AL isotype, n (%) | ||
| λ | 100 (75.8) | 71 (78.0) |
| κ | 32 (24.2) | 20 (22.0) |
| Involved organs | ||
| Median (range) | 2 (1-4) | 2 (1-5) |
| Distribution, n (%) | ||
| Heart | 109 (82.5) | 81 (89.0) |
| Kidney | 79 (59.8) | 48 (52.7) |
| Liver | 23 (17.4) | 24 (26.4) |
| Other | 65 (49.2) | 62 (68.1) |
| Mayo 2004 staging (with 2015 European modification), n (%) | ||
| 1 | 12 (11.7) | 7 (7.9) |
| 2 | 44 (42.7) | 35 (39.3) |
| 3A | 34 (33.0) | 29 (32.6) |
| 3B | 12 (11.7) | 18 (20.2) |
| Mayo 2012 staging, n (%) | ||
| 1 | 17 (16.5) | 7 (7.9) |
| 2 | 23 (22.3) | 15 (16.9) |
| 3 | 32 (31.1) | 34 (38.2) |
| 4 | 30 (29.1) | 33 (37.1) |
| Median NT-proBNP level, pg/mL (range) | 2 771 (17-31 933) | 3 518 (87-43 033) |
| Median hs-cTnT, ng/L (range) | 46 (0.03-373.1) | 58 (5-680) |
| Median estimated GFR, mL/min per 1.73 m2 (range) | 77 (3-181) | 76 (10-153) |
GFR, glomerular filtration rate; hs-cTnT, high-sensitivity cTnT.
Methods
Serum FLC quantification was performed using the Freelite FLC assay. iFLC refers to the light chain isotype involved in AL amyloid formation, as opposed to the uFLC. dFLC was calculated by subtracting uFLC from iFLC. dFLC levels were extracted from medical records at day 28 (cycle 1 completion) and 3, 6, 9, and 12 months from commencement of therapy. Response to therapy was defined according to consensus criteria. A very good partial response (VGPR) was defined as a dFLC of <40 mg/L, a partial response (PR) as a reduction of >50% from baseline, and stable disease (SD) as a dFLC reduction of <50%. Nonresponders were defined as patients who did not achieve at least a PR. The percentage of clonal plasma cells in the bone marrow was measured before therapy initiation through bone marrow biopsy. For patients with a reported percentage range (eg, 10%-15%), the mean value (eg, 12.5%) was recorded. Survival time was calculated from therapy start date to study analysis cutoff (28 July 2024) or death, whichever occurred first. Patients were classified by both the Mayo 2004 staging system (with 2015 European modifications) and the Mayo 2012 staging system. The Mayo 2004 staging system classifies patients into stages 1 to 3 based on cardiac TnT (cTnT) of ≥0.035 μg/L (or high-sensitivity cTnT threshold ≥50 ng/L)16 and NT-proBNP of ≥332 ng/L. The 2015 European modification further subdivides stage 3 into 3A and 3B based on the absence or presence of an NT-proBNP level of >8500 ng/L.17 The Mayo 2012 staging system assigns stages 1 to 4 using cutoff values: TnT of ≥0.025 μg/L (or high-sensitivity cTnT threshold >40 ng/L),18 NT-proBNP of ≥1800 ng/L, and dFLC of ≥18 mg/dL.6,19
Statistical analysis
Correlation between continuous variables (eg, baseline iFLC and dFLC response) at indicated intervals was determined using Pearson r2 correlation coefficient with statistical significance determined as P <.05. Categorical multivariable analysis (ie, type of response achieved) was performed using a 1-way analysis of variance test, with differences between data sets tested for statistical significance via Tukey’s multiple comparison test. Survival analysis was conducted using the Kaplan-Meier method with statistical significance tested using the log-rank (Mantel-Cox) test.
Results
A total of 223 patients (132 in the CyBorD group and 91 in the DaraCyBorD group) were included in our study. The demographic and clinical characteristics at baseline were balanced between the groups (Table 1). The median age was 64 years and both cohorts had a slight male predominance, with 57% in the CyBorD group and 52% in the DaraCyBorD group. Lambda-restricted and kappa-restricted patients comprised 75.8% and 24.2% of the CyBorD cohort, respectively, and 78.0% and 22.0% of the DaraCyBorD cohort. Notably, 71.3% of the patients in the CyBorD cohort and 78.0% in the DaraCyBorD cohort had 2 or more organs involved; 82.5% (CyBorD) and 89.0% (DaraCyBorD) had heart involvement, and 59.8% (CyBorD) and 52.7% (DaraCyBorD) had kidney involvement. Based on the Mayo 2004 staging system (with European modification), the CyBorD cohort was stratified into stage 1 (11.7%), stage 2 (42.7%), stage 3A (33.0%), and stage 3B (11.7%), whereas the DaraCyBorD cohort was stratified into stage 1 (7.9%), stage 2 (39.3%), stage 3A (32.6%), and stage 3B (20.2%).
Seventy-six percent of patients in the DaraCyBorD group and 80% in the CyBorD group had a plasma cell burden of ≥10% (Table 2). Sixty-eight percent of patients in the DaraCyBorD group and 60% of patients in the CyBorD group had a baseline dFLC of ≥180 mg/L. The DaraCyBorD cohort had a slightly higher baseline median iFLC at 305 mg/L vs 239.5 mg/L in the CyBorD cohort. Forty patients in the CyBorD cohort and 3 in the DaraCyBorD cohort did not respond to therapy by day 28 (Table 2). By day 28, the median dFLC was 26.7 mg/L in CyBorD responders and 10.2 mg/L in DaraCyBorD responders. By 12 months, the dFLC was 12.3 mg/L in CyBorD responders and 4.19 mg/L in DaraCyBorD responders (Table 2).
FLC values for CyBorD- and DaraCyBorD-treated patients
| Variable . | CyBorD (n = 132) . | DaraCyBorD (n = 91) . |
|---|---|---|
| Baseline (day 0) | ||
| Median iFLC, mg/L (range) | 239.5 (17.1-15 800) | 305 (11.2-7360) |
| Bone marrow plasmacytosis, % (range) | 15 (0-90) | 14.75 (0-80) |
| Median M-spike, g/dL (range) | 0 (0-5.4) | 0 (0-3.4) |
| Day 28 | ||
| Responders at day 28 | 92 | 88 |
| Nonresponders at day 28 (%) | 40 (43.5) | 3 (3.4) |
| All median dFLC, mg/L (range) | 79.4 (0-12 685.9) | 10.7 (0.2-964.0) |
| Responders median dFLC, mg/L (range) | 26.7 (0-3291.9) | 10.2 (0.2-964.0) |
| Month 3 | ||
| All median dFLC, mg/L (range) | 31 (0.1-7831.8) | 5.2 (0-205.4) |
| Responders median dFLC, mg/L (range) | 14.9 (0.1-3198.4) | 5 (0-205.4) |
| Month 6 | ||
| Median dFLC (all), mg/L (range) | 18.3 (0.1-1198.6) | 4.4 (0.1-50.4) |
| Median dFLC (responders), mg/L (range) | 7.9 (0.1-2969.6) | 4.4 (0.1-50.4) |
| Month 9 | ||
| Median dFLC (all), mg/L (range) | 13.30 (0-3192.6) | 4.35 (0.2-55.7) |
| Median dFLC (responders), mg/L (range) | 6.57 (0-1845.6) | 3.5 (0-55.7) |
| Month 12 | ||
| Median dFLC (all), mg/L (range) | 13.4 (0.1-1872.1) | 4.55 (0.1-53.9) |
| Median dFLC (responders), mg/L (range) | 12.3 (0.1-1872.1) | 4.19 (0.1-53.9) |
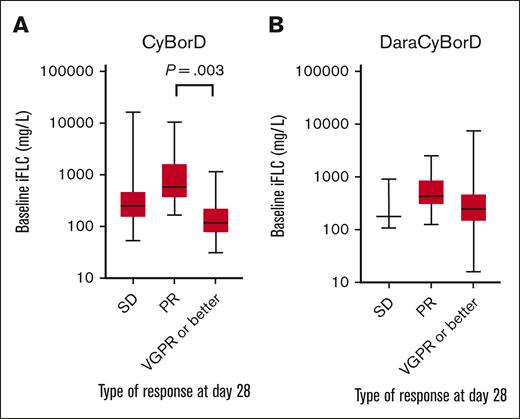
Importantly, baseline iFLC did not predict depth of hematologic response in patients treated with DaraCyBorD (P = .84) (Figure 1). In the CyBorD cohort, patients who achieved a VGPR or better had lower iFLC levels than those who achieved a PR, but no significant difference was detected compared with nonresponders (VGPR or better vs PR, P = .003; VGPR or better vs SD, P = .27) (Figure 1). To account for bias and data skewing from SD groups, only patients who responded to therapy by day 28 were included in the downstream dFLC hematologic response analysis.
Distribution of baseline iFLC based on early disease response. Box and whisker plot showing the distribution of iFLC in patients receiving CyBorD (A) or DaraCyBorD (B) according to disease response at day 28. Only statistically significant differences according to P value are shown.
Distribution of baseline iFLC based on early disease response. Box and whisker plot showing the distribution of iFLC in patients receiving CyBorD (A) or DaraCyBorD (B) according to disease response at day 28. Only statistically significant differences according to P value are shown.
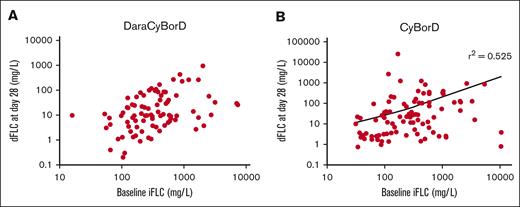
Hematologic response as measured by dFLC did not correlate with baseline iFLC in patients treated with DaraCyBorD on day 2 (r2 = 0.02, P = .16, 91 patients) (Figure 2A) and 3, 6, 9, and 12 months (r2 = 0; supplemental Appendix A). These data suggest that hematologic responses to DaraCyBorD are independent of FLC level.
Correlation analysis between iFLC and early disease response. Scatter plot showing correlation of baseline iFLC with early disease response based on dFLC at day 28 in patients who responded to DaraCyBorD (A, N = 88) or CyBorD (B, N = 92). Pearson correlation coefficient was 0 in the DarayBorD cohort (not shown) and 0.53 for CyBorD cohort (shown).
Correlation analysis between iFLC and early disease response. Scatter plot showing correlation of baseline iFLC with early disease response based on dFLC at day 28 in patients who responded to DaraCyBorD (A, N = 88) or CyBorD (B, N = 92). Pearson correlation coefficient was 0 in the DarayBorD cohort (not shown) and 0.53 for CyBorD cohort (shown).
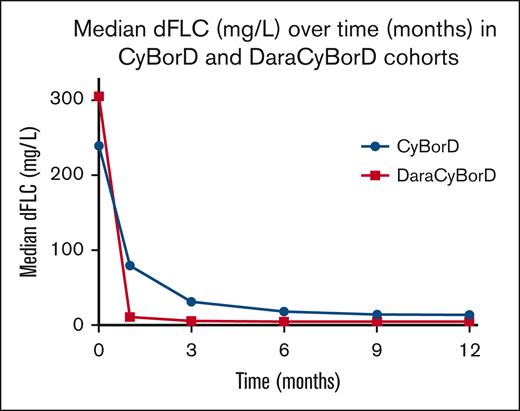
For patients treated with CyBorD, we observed a negative correlation between iFLC level and decline in dFLC at day 28, which was more pronounced for iFLC level of >1000 mg/L (r2 = 0.53, P < .001, 132 patients) (Figure 2B). This negative correlation became stronger at 3 months (r2 = 0.81, P < .001, 119 patients; supplemental Appendix A). However, by 6 months, the correlation weakened significantly (r2 = .16, P = .0004, 105 patients; supplemental Appendix A) and remained modest at 9 and 12 months (r2 = 0.36, P < .001, 77 patients; and r2 = 0.41, P < .001, 74 patients; supplemental Appendix A). By 12 months, 23% of patients treated with CyBorD had failed to achieve VGPR. Our data indicate that DaraCyBorD is more effective than CyBorD at rapidly reducing FLC burden, reflected in normalization or near normalization of dFLC by day 28 even in patients with significantly elevated iFLC at baseline (Figure 3). These findings are consistent with observations from the ANDROMEDA trial.13
Changes in median dFLC over time. The chart shows the changes in median dFLC over time (months) in patients receiving CyBorD (blue line) or DaraCyBorD (red line).
Changes in median dFLC over time. The chart shows the changes in median dFLC over time (months) in patients receiving CyBorD (blue line) or DaraCyBorD (red line).
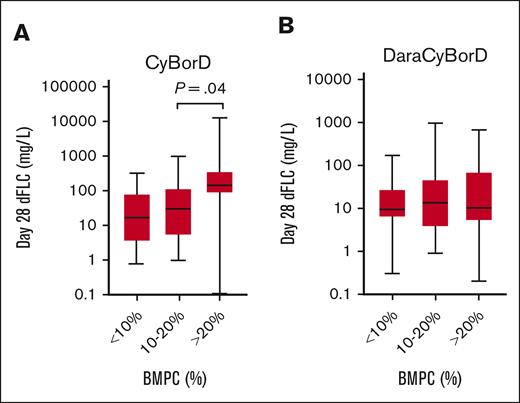
Bone marrow plasmacytosis exceeding 10% had been previously reported to portend negative prognosis, akin to an overlapping diagnosis of AL amyloidosis and CRAB criteria–based multiple myeloma. This observation may affect counseling of patients and eligibility for solid organ transplantation and is critical to validate in a cohort of patients treated with modern regimens.20 Thus, we investigated the impact of bone marrow plasma cells (BMPCs) on hematologic response (dFLC) in the DaraCyBorD and CyBorD cohorts. Patients were stratified into 3 BMPC categories: <10%, 10% to 20%, and >20%. In the DaraCyBorD cohort, no correlation was observed across BMPC groups and dFLC response at day 28 (P = .37) or over 3, 6, 9, and 12 months (Figure 4; supplemental Appendix B). In contrast, in the CyBorD cohort, a significance was identified between BMPC groups 10% to 20% and >20% on day 28 dFLC (P = .02) (Figure 4). However, no significant differences were observed between BMPC groups and dFLC at 3, 6, 9, and 12 months in the CyBorD cohort. To further investigate the prognostic value of BMPC, survival analysis was performed using the Kaplan-Meier method for the BMPC categories. Neither the DaraCyBorD (P = .13) nor the CyBorD cohorts (P = .07) demonstrated significance (supplemental Appendix C). These findings suggest that BMPC is not a prognostic factor for hematologic response in patients treated with bortezomib- and daratumumab-based regimens for AL amyloidosis.
Distribution day 28 dFLC based on extent of bone marrow plasmacytosis. Box and whisker plot showing the distribution of dFLC at day 28 in patients treated with CyBorD (A) or DaraCyBorD (B) according to the extent of bone marrow plasmacytosis (BMPC). Only statistically significant P value are shown.
Distribution day 28 dFLC based on extent of bone marrow plasmacytosis. Box and whisker plot showing the distribution of dFLC at day 28 in patients treated with CyBorD (A) or DaraCyBorD (B) according to the extent of bone marrow plasmacytosis (BMPC). Only statistically significant P value are shown.
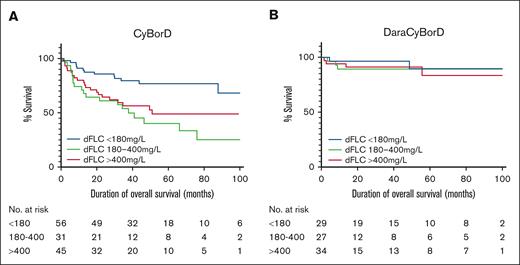
A survival analysis was subsequently conducted for OS in the CyBorD and DaraCyBorD cohorts, stratified by baseline dFLC levels. The CyBorD and DaraCyBorD cohorts were divided into 3 groups based on baseline dFLC levels: low (<180 mg/L), medium (180-400 mg/L), and high (>400 mg/L). These groups were then plotted against the probability of survival over time (Figure 5).
Overall survival of CyBorD- and DaraCyBorD-treated patients according to baseline dFLC. Kaplan-Meier curves for OS for patients in the CyBorD (A) or DaraCyBorD (B) cohort, stratified by baseline dFLC levels as indicated. Truncation was applied when fewer than 10 patients remained at risk in each group, reflecting the availability of follow-up data.
Overall survival of CyBorD- and DaraCyBorD-treated patients according to baseline dFLC. Kaplan-Meier curves for OS for patients in the CyBorD (A) or DaraCyBorD (B) cohort, stratified by baseline dFLC levels as indicated. Truncation was applied when fewer than 10 patients remained at risk in each group, reflecting the availability of follow-up data.
The median follow-up time was 37.7 months for the CyBorD cohort and 21.1 months for the DaraCyBorD cohort. In the CyBorD cohort, a significant difference in survival curves was observed (P = .0018). The cumulative probability of survival for low, medium, and high baseline dFLC at 21 months was 85.7% (95% confidence interval [CI], 73.5-92.6), 64.5% (95% CI, 45.2-78.5), and 66.7% (95% CI, 50.9-78.4), respectively. This indicates that, in CyBorD-treated patients, a baseline dFLC <180 mg/L correlates with better prognosis. No significant difference was identified between survival in medium and high dFLC groups (P = .34), without marked clustering of dFLC groups within Mayo 2004 stages (Table 3), suggesting that the relationship between baseline dFLC and survival is not linear in CyBorD-treated patients.
Distribution of patients by Mayo 2004 stages across dFLC levels in the CyBorD cohort
| CyBorD . | 2004 Mayo stage 1 . | 2004 Mayo stage 2 . | 2004 Mayo stage 3A . | 2004 Mayo stage 3B . |
|---|---|---|---|---|
| Low dFLC (<180 mg/L) | 9 (20.45) | 20 (45.45) | 12 (27.27) | 3 (6.82) |
| Medium dFLC (180-400 mg/L) | 3 (13.64) | 7 (31.82) | 9 (40.91) | 3 (13.64) |
| High dFLC (>400 mg/L) | 0 (0.0) | 17 (47.22) | 13 (36.11) | 6 (16.67) |
Data are presented as counts with corresponding percentages.
In the DaraCyBorD cohort, the probability of survival was independent of baseline dFLC (P = .75). The cumulative probability of survival for low, medium, and high baseline iFLC at 21 months was 96.6% (95% CI, 77.9-99.5), 89.3% (95% CI, 70.4-96.4), and 91.2% (95% CI, 75.1-97.1). This suggests that baseline dFLC was not prognostic of survival in patients treated with DaraCyBorD. Furthermore, patients were relatively evenly distributed across Mayo 2004 stages within each dFLC group (Table 4). These findings align with previous studies that identified a rapid reduction of dFLC to strongly correlate with improvement of organ function and survival.21,22
Distribution of patients by Mayo 2004 stages across dFLC levels in the CyBorD cohort
| DaraCyBorD . | 2004 Mayo stage 1 . | 2004 Mayo stage 2 . | 2004 Mayo stage 3A . | 2004 Mayo stage 3B . |
|---|---|---|---|---|
| Low dFLC (<180 mg/L) | 2 (7.41) | 11 (40.74) | 9 (33.33) | 5 (18.52) |
| Medium dFLC (180-400 mg/L) | 3 (10.71) | 11 (39.29) | 9 (32.14) | 5 (17.86) |
| High dFLC (>400 mg/L) | 2 (5.88) | 13 (38.24) | 11 (32.35) | 8 (23.53) |
Data are presented as counts with corresponding percentages.
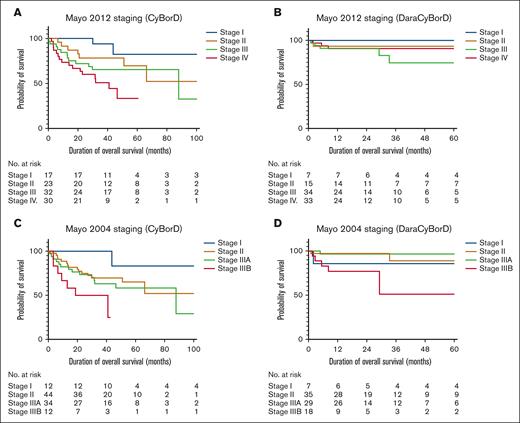
Finally, to assess the prognostic value of the Mayo 2012 staging system, we stratified the CyBorD and DaraCyBorD cohorts separately by cardiac biomarkers and dFLC (Figure 6). In the CyBorD cohort, a significant difference in survival curves was observed (P = .011), primarily driven by the separation of stage 4 from stages 1, 2, and 3. However, no significant difference in survival curves was identified in patients treated with DaraCyBorD when staged with the Mayo 2012 system (P = .56).
Overall survival of CyBorD- and DaraCyBorD-treated patients according to Mayo 2004 and 2012 staging. (A-B) Kaplan-Meier curves for OS for patients in the CyBorD (A) or DaraCyBorD (B) cohort stratified according to the Mayo 2012 staging system. (C-D) Kaplan-Meier curves for OS for patients in the CyBorD (C) or DaraCyBorD (D) cohort stratified according to the Mayo 2004 staging system with European modification.
Overall survival of CyBorD- and DaraCyBorD-treated patients according to Mayo 2004 and 2012 staging. (A-B) Kaplan-Meier curves for OS for patients in the CyBorD (A) or DaraCyBorD (B) cohort stratified according to the Mayo 2012 staging system. (C-D) Kaplan-Meier curves for OS for patients in the CyBorD (C) or DaraCyBorD (D) cohort stratified according to the Mayo 2004 staging system with European modification.
Further analysis using the Mayo 2004 staging system, which excludes dFLC as a prognostic marker, revealed significant differences in revealed significant differences in survival curves for both CyBorD (P = .017) and DaraCyBorD cohorts (P = .014), largely influenced by stage 3B. These findings suggest that incorporating dFLC into a staging framework for AL amyloidosis may not reliably predict patient prognosis, in the context of bortezomib-based (CyBorD) therapy and even less reliably in with DaraCyBorD therapy.
Discussion
Over the last decade, there has been significant improvement in the care of patients with AL amyloidosis with progressive improvement in OS. Several factors contributed to these advancements; however, clinical use of novel, highly effective anti–plasma-cell therapies and improved stratification for autologous stem cell transplant are certainly critical factors. Bortezomib and daratumumab are credited for being the most active agents in amyloidosis to date. CyBorD was adopted as the de facto standard of care since the early to mid-2010s.11,23 The activity of single agent daratumumab in relapsed/refractory AL amyloidosis led to the development of DaraCyBorD as frontline therapy in AL amyloidosis. After the FDA approval for patients with stage 1 to 3A newly diagnosed AL amyloidosis, this quadruplet is now standard of care treatment.
Staging systems for AL amyloidosis developed in a different therapeutic era may lack validity with current regimens. In particular, the Mayo 2012 system incorporated a dFLC of ≥180 mg/L as a negative prognostic factor. However, the cohort of patients used to develop and validate this system did not receive bortezomib. Rather, patients were treated with lenalidomide-based therapies, which are characterized by modest clinical activity, potential for cardiac toxicity, and slow time to response (months rather than weeks). This contrasts sharply with CyBorD and especially DaraCyBorD, which often achieve deep hematologic responses within the first cycle.
Our data show that iFLC burden at diagnosis does not affect depth and rapidity of response with DaraCyBorD and only modestly affects response to CyBorD in patients with exceedingly high iFLC (>1000 mg/L). Similarly, a dFLC of >180 mg/L is no longer an adverse prognostic factor in patients treated with CyBorD or DaraCyBorD. Consequently, the Mayo 2012 staging no longer accurately discriminates survival in patients treated with DaraCyBorD. These data warrant caution regarding counseling and prognostic stratification of patients receiving FDA-approved DaraCyBorD. Conversely, we confirmed that the Mayo 2004 staging system, with European modifications, retains its prognostic value across both regimens. This is driven primarily by the poor outcomes observed in stage 3B, whereas stages 2 and 3A have similar outcomes in CyBorD. This finding aligns with data from the prospective ANDROMEDA study. Of note, the prognostic impact of Mayo 2012 in ANDROMEDA was not reported.
Our study has several limitations. First, its retrospective nature could potentially introduce selection bias. However, in both institutions involved, CyBorD and, more recently, DaraCyBorD were offered to all patients seeking treatment, regardless of staging, and the analysis included consecutive patients. Second, the follow-up period for patients receiving DaraCyBorD is <2 years, which limits our ability to draw conclusions regarding long-term survival and the potential divergence of survival curves with extended follow-up. Final analysis of the ANDROMEDA study recently showed a significant improvement in 5-year OS in patients receiving DaraCyBorD vs CyBorD (76.1% vs 64.7%). Of note, survival curves clearly started separating at 15 months, suggesting that our length of follow-up should allow detection of OS differences.24
Our findings highlight the limitations of the Mayo 2012 staging system in the era of bortezomib- and daratumumab-based therapies. Our observations carry significant clinical implications for patient counseling, therapeutic decision-making, and the interpretation of phase 3 studies that stratify patients using the Mayo 2012 or 2004 staging criteria. Together with reports from other investigators, our findings underscore the urgent need for new prognostic tools tailored to the era of more effective anti–plasma-cell therapies.
Acknowledgments
The authors thank the current and past members of the Amyloidosis Center of Brigham and Women’s Hospital/Dana-Farber Cancer Institute, Boston, and the National Kapodistrian University of Athens Hospital, Athens, Greece.
G.B. thanks the Demarest Lloyd Jr Foundation, the Darling Fund, and the Appleby Cardiac Amyloidosis Fund for their support of the Brigham and Women’s Hospital/Dana-Farber Cancer Institute Amyloidosis Program. G.B. was funded in part by National Institutes of Health/National Cancer Institute grant K08CA245100.
Authorship
Contribution: G.B. designed the study; B.S. performed data analysis; B.S., G.B., and E.K. wrote the manuscript; and F.T., D.F., M.A.D., S.B., and B.E. collected the data.
Conflict-of-interest disclosure: G.B. reports honoraria for consulting services by Prothena and Pfizer. M.A.D. reports honoraria from Takeda, Bristol Myers Squibb, BeiGene, and Janssen. E.K. provides consultancy for Janssen, Pfizer, and Amgen, and reports honoraria from Janssen, Pfizer, Takeda, Genesis Pharma, Amgen, and GlaxoSmithKline. D.F. reports honoraria from Janssen and Sanofi. The remaining authors declare no competing financial interests.
Correspondence: Efstathios Kastritis, Department of Clinical Therapetics, National Kapodistrian University of Athens, 80 Vas. Sofias Ave, Athens 11528, Greece; email: ekastritis@med.uoa.gr; and Giada Bianchi, Division of Hematology, Department of Medicine, Brigham and Women's Hospital, 4 Blackfan Cir, HIM 742, Boston, MA 02115; email: gbianchi1@bwh.harvard.edu.
References
Author notes
B.S. and F.T. contributed equally to this study.
E.K. and G.B. contributed equally to this study.
The data that support the findings of this study are available upon reasonable request from the corresponding authors, Efstathios Kastritis (ekastritis@med.uoa.gr) and Giada Bianchi (gbianchi1@bwh.harvard.edu).
The full-text version of this article contains a data supplement.

