Key Points
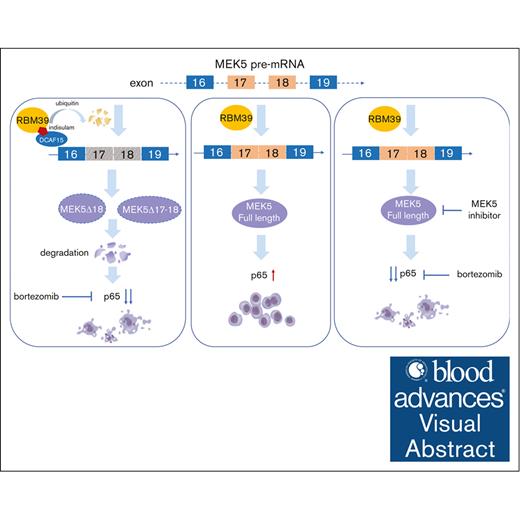
RBM39 promotes the malignant growth of MM by maintaining the splicing pattern that produces full-length MEK5.
Targeting the RBM39-MEK5 axis increases the cytotoxicity of bortezomib by inhibiting p65 to synergistically inhibit MM growth.
Visual Abstract
Aberrant alternative splicing is one of the hallmarks of cancer and is potentially based on upregulated expression-of-splicing factors in some types of cancer. Our previous study suggested that the splicing factor RBM39 is significantly upregulated in multiple myeloma (MM) and that its upregulation is positively associated with poor prognosis. Here, we further demonstrate that the survival and proliferation of MM cells rely on RBM39 and that RBM39 knockdown inhibits the malignant growth of MM. Indisulam, a “molecular glue” that mediates the proteasomal degradation of RBM39, has potent suppressive effects on MM both in vitro and in vivo. Deletion of RBM39 results in extensively altered splicing, with mis-splicing of MEK5 verified to inhibit the malignant growth of MM. Full-length MEK5 plays a vital role in maintaining MM cell survival, whereas aberrant MEK5 isoforms with exon loss exhibit loss of function and a propensity for proteasomal degradation. Targeting RBM39 or MEK5 synergistically increases the cytotoxicity of bortezomib in MM cells via the inhibition of p65. Our study validates the specific mechanism of RBM39 in MM, providing an approach for broader targeting and optimized therapeutic strategies for MM.
Introduction
Multiple myeloma (MM) is a hematologic malignancy characterized by the accumulation and expansion of malignant plasma cells in the bone marrow (BM).1,2 Despite advances in novel chemotherapies, such as proteasome inhibitors and immunomodulatory drugs, daratumumab, and chimeric antigen receptor T-cell therapy, MM remains incurable in most patients, and initial remission is followed by relapses, thus requiring new therapeutic modalities.3
Pre–messenger RNAs (mRNAs) undergo a process of intron elimination and exon joining, called alternative splicing (AS), to become mature mRNAs.4 Abnormal AS is a hallmark of cancer5-7 and is associated with poor survival and allocation to an ultrahigh risk group in MM.8 AS is coordinated by cis-elements within genes and trans-acting splicing factors composed of RNA-binding proteins, such as serine/arginine proteins and heterogeneous nuclear ribonucleoproteins.9 Some splicing factors have been reported to be highly expressed, through either changes in gene copy number or expression,10 and to contribute to the tumorigenesis and development of MM through aberrant inactivation of tumor suppressors or activation of oncogenes.11-13 Thus, targeting splicing is a promising therapeutic strategy for MM.14
The splicing factor RBM39, an serine/arginine-rich RNA-binding protein, is highly expressed in various cancers, and the inhibition of RBM39 is lethal to these cancers.15-19 RBM39 is required for acute myeloid leukemia maintenance through mis-splicing of the HOXA9 target gene.17 The KRAS4A/4B ratio is controlled by RBM39 to regulate the stem-progenitor transition of cancer cells.20 RBM39 has been reported to mediate the upregulation of asparagine synthesis, leading to increased arginine uptake and forming a positive-feedback loop to maintain high arginine levels and oncogenic metabolism.21 Deletion of RBM39 leads to metabolomics perturbations and mitochondrial dysfunction in neuroblastoma.19,21 However, the exact role of RBM39 in the tumorigenesis and development of MM has not been thoroughly characterized.
In our previous study, we found that RBM39 was highly expressed in patients with MM and that high RBM39 expression was correlated with poor prognosis.22 In addition, analysis of CRISPR essentiality screen data in the Cancer Dependency Map project showed that MM is among the most sensitive tumor types to RBM39 ablation.14,23 Moreover, RBM39 interacts with U2AF65 and SF3B1 to regulate AS,24 whereas targeting SF3B1 has been demonstrated to be potentially effective in treating MM.14 In this study, we explored the exact function of RBM39 in MM and determined the underlying mechanism involved. Furthermore, we investigated the anti-MM effects of targeting RBM39.
Methods
Plasmids
We cloned RBM39 complementary DNA (cDNA) to pLVX-Puro vector and MEK5, MEK5 transcript with exon 18 loss (MEK5Δ18), and MEK5 transcripts with exon 17-18 loss (MEK5Δ17-18) to pCDH-GFP. RBM39G268V was amplified with Mut Express II Fast Mutagenesis Kit V2 (C214, Vazyme) with the flag sequence and cloned to pLVX-Puro. Expression plasmids for short hairpin RNAs (shRNAs) were made in a pLKO.1-puro vector. The RBM39 shRNA (shRBM39) 2 and MEK5 shRNA (shMEK5) 2 were also made in a pLKO.1-tet-on-puro vector. The pGIPZ-shDCAF15-GFP was obtained from the DNA library of the Shanghai Jiao Tong University School of Medicine. The detailed primers are presented in supplemental Tables 1 and 2.
Lentivirus package and infection
The overexpression or shRNA plasmids were combined with lentivirus packaging vectors psPAX2 and pMD2G, introduced into HEK293T cells to produce lentivirus. Viral supernatant was collected 72 hours after transfection. For transduction, viral solutions were added to cell culture medium containing 8 μg/mL Polybrene. Puromycin selection or flow cytometer sorting was performed 72 hours after the infection. RBM39G268V-overexpressing cells were selected by exposure to 10 μM indisulam for 1 week.
Analysis of aberrant splicing of MEK5
Total RNA was extracted using TRIzol (Invitrogen). cDNA was synthesized using the PrimeScript II 1st strand cDNA synthesis kit (Takara) according to the manufacturer’s protocol. Polymerase chain reaction (PCR) was performed using the following set of primers: MEK5-DIFF-F CATAGAGACGTGAAGCCCTCC and MEK5-DIFF-R GACGGGCGA ATCCTCATCA. The PCR products were separated by 3% agarose gel electrophoresis and extracted. The extracted cDNA was cloned to pMD-19T vector (Takara). We sequenced 50 clones, aligned the sequencing results with the MEK5 mRNA (NM_145160.3), and counted the number of different isoforms.
Gene Expression Omnibus data analysis
Three MM data sets (GSE39754,25 GSE47552,26 GSE265827) were obtained from the Gene Expression Omnibus database. GSE39754 and GSE47552 were analyzed for MEK5 expression following the instruction. The clinical relevance of MEK5 in patients with MM was analyzed based on the GSE2658 data set using the KM Plotter (http://kmplot.com/analysis/).28
Synergy score
The expected drug combination responses were calculated based on ZIP reference model using SynergyFinder.29
Statistical analyses
Data were analyzed with t test. P < .05 was considered to be statistically significant. Survival curves were analyzed by Mantel–Cox log-rank test. Statistical analyses were conducted using GraphPad Prism. For all experiments with error bars, the standard deviation of the mean was calculated to indicate the variation within each experiment (∗P < .05, ∗∗P < .01, ∗∗∗P < .001, ∗∗∗∗P < .001).
More materials and methods are collected in supplemental Materials.
Results
RBM39 is required for MM cell survival and tumor growth
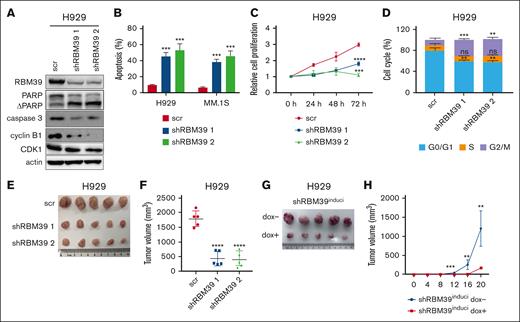
To investigate the underlying role of RBM39 in MM, we knocked down RBM39 in MM.1S and H929 cells (Figure 1A; supplemental Figure 1A). Knockdown of RBM39 inhibited MM cell proliferation and induced apoptosis and G2/M arrest (Figure 1B-D; supplemental Figure 1B-C). Consistent with the cellular phenotype, RBM39 silencing led to the cleavage of the apoptotic proteins PARP and caspase-3 and decreased cyclin B1-CDK1 complex formation at the G2/M checkpoint (Figure 1A; supplemental Figure 1A). Furthermore, we subcutaneously injected H929 cells infected with the lentiviral shRBM39 or scrambled vector into NOD/shi-PrkdcscidIl2rgtm1Sug/JicCrl (NOG) mice and found that the subcutaneous tumors in the shRBM39 group were smaller than those in the control group (supplemental Figure 1D; Figure 1E-F). We also investigated whether RBM39 expression was required for tumor growth in mice bearing xenografts formed from U266 cells stably expressing doxycycline (dox)-inducible shRBM39 2. The mice were divided into 2 groups, with the mice in 1 group receiving dox from the start of the experiment. The xenograft growth rates were significantly reduced in mice given dox (Figure 1G-H; supplemental Figure 1E). These observations suggest that RBM39 is required for the maintenance of MM cell proliferation and survival both in vitro and in vivo and is therefore a potential therapeutic target for MM.
RBM39 is required for MM cell survival and tumor growth. (A) Knockdown of RBM39 in H929 cells was verified, and the modulation of apoptotic and cell cycle related proteins in RBM39-silenced H929 cells was detected by western blotting. (B) Knockdown of RBM39 induced apoptosis in H929 and MM.1S cells. Apoptosis was detected by annexin V/PI 48 hours after infection. (C) Knockdown of RBM39 inhibited the proliferation of H929. Cell viability was detected using CCK-8 at the indicated time points and the growth curve was calculated. (D) Knockdown of RBM39 induced cell cycle of H929 arrest at the G2/M phase, which was detected 48 hours after infection. (E) Images of subcutaneous tumor tissues of H929-shRBM39 cells. RBM39-knockdown H929 cells were subcutaneously inoculated into the hind flank of 6-week-old female NOG mice. The mice were euthanized 5 weeks after inoculation. (F) Tumor volume of subcutaneous tumors in panel E after mice sacrificed. (G) Images of subcutaneous tumor tissue with U266-inducible RBM39-knockdown cells. U266 cells with dox-inducible shRBM39 2 were subcutaneously inoculated into the hind flank of 6-week-old female NOG mice. The mice were euthanized 20 days after inoculation. dox− group: mice were treated with 5% sugar in water. dox+ group: mice were treated with 5% sugar plus 2 mg/mL dox. (H) Tumor sizes were measured every 4 days. ∗∗P < .01, ∗∗∗P < .001, ∗∗∗∗P < .0001. CCK-8, Cell Counting Kit-8; ns, no significant; PI, propidium iodide; scr, scrambled.
RBM39 is required for MM cell survival and tumor growth. (A) Knockdown of RBM39 in H929 cells was verified, and the modulation of apoptotic and cell cycle related proteins in RBM39-silenced H929 cells was detected by western blotting. (B) Knockdown of RBM39 induced apoptosis in H929 and MM.1S cells. Apoptosis was detected by annexin V/PI 48 hours after infection. (C) Knockdown of RBM39 inhibited the proliferation of H929. Cell viability was detected using CCK-8 at the indicated time points and the growth curve was calculated. (D) Knockdown of RBM39 induced cell cycle of H929 arrest at the G2/M phase, which was detected 48 hours after infection. (E) Images of subcutaneous tumor tissues of H929-shRBM39 cells. RBM39-knockdown H929 cells were subcutaneously inoculated into the hind flank of 6-week-old female NOG mice. The mice were euthanized 5 weeks after inoculation. (F) Tumor volume of subcutaneous tumors in panel E after mice sacrificed. (G) Images of subcutaneous tumor tissue with U266-inducible RBM39-knockdown cells. U266 cells with dox-inducible shRBM39 2 were subcutaneously inoculated into the hind flank of 6-week-old female NOG mice. The mice were euthanized 20 days after inoculation. dox− group: mice were treated with 5% sugar in water. dox+ group: mice were treated with 5% sugar plus 2 mg/mL dox. (H) Tumor sizes were measured every 4 days. ∗∗P < .01, ∗∗∗P < .001, ∗∗∗∗P < .0001. CCK-8, Cell Counting Kit-8; ns, no significant; PI, propidium iodide; scr, scrambled.
Indisulam potently inhibits MM growth in vitro and in vivo by selectively degrading RBM39
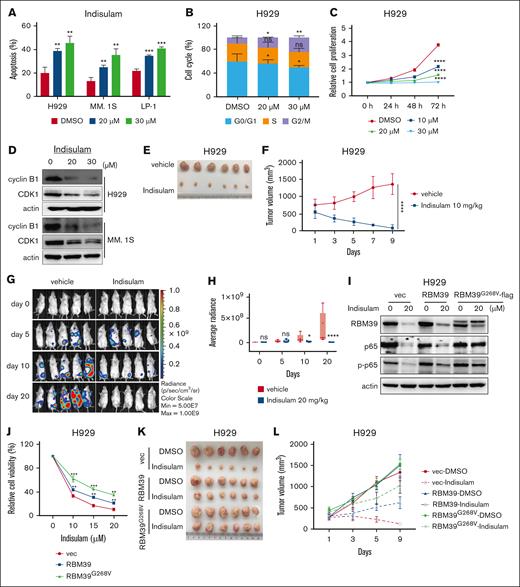
Indisulam has been reported to induce RBM39 degradation via the proteasomal pathway by acting as a molecular glue to link RBM39 to the E3 ubiquitin ligase DCAF15.18,30,31 Moreover, DCAF15 is highly expressed in MM,15 resulting in conditions sufficient for the ubiquitination of RBM39. We used indisulam to determine the effects of targeting RBM39 on MM cells. The half-maximal inhibitory concentration of indisulam in different MM cell lines ranged from 12.83 to 23.14 μM after 48 hours of treatment (supplemental Figure 2A). RBM39 was degraded in a dose- and time-dependent manner by indisulam treatment in MM cell lines (supplemental Figure 2B-C). Indisulam inhibited the malignant growth of MM by inducing apoptosis and G2/M arrest in MM cells and suppressing cell proliferation (Figure 2A-C; supplemental Figure 2D). The level of the cyclin B1-CDK1 complex was also decreased (Figure 2D). Similarly, indisulam significantly decreased the viability of primary CD138+ cells isolated from patients with newly diagnosed MM but only slightly decreased the viability of CD138− cells (supplemental Figure 3A-B). Using a coculture system with MM BM–derived mesenchymal stromal cells to investigate the effects of indisulam in the context of the BM microenvironment, we revealed that the presence of stromal cells does reduce the efficacy of indisulam, but indisulam remained effective against MM cells (supplemental Figure 3C).
Indisulam is potent against MM in vitro and in vivo by selectively degrading RBM39. (A) Indisulam induced apoptosis in MM.1S, H929, and LP-1 cells. Apoptosis was detected after 48 hours of indisulam treatment. (B) Indisulam induced H929 cells cell cycle arrest at G2/M phase. Cell cycle was detected after 48 hours of indisulam treatment. (C) Indisulam inhibited H929 cell proliferation in a dose- and time-dependent manner. (D) The cyclin B1-CDK1 complex at the G2/M checkpoint was decreased after indisulam treatment. (E) Image of subcutaneous H929 tumor tissues treated with indisulam. H929 cells were injected into BALB/c nude mice to form subcutaneous tumors. The mice received 9 consecutive daily treatments with either vehicle or 10 mg/kg indisulam via intraperitoneal administration. (F) H929 tumors growth curve in panel E. (G) Bioluminescence images of mice transplanted with luciferase-labeled LP-1 (LP-1-luc) cells treated with vehicle or indisulam. LP-1-luc cells were injected into the tail vein of NOG mice. Five weeks after injection, the mice received 20 consecutive daily treatments of either vehicle or 20 mg/kg indisulam by intraperitoneal administration. Bioluminescence was detected at the indicated time points. (H) Quantification of bioluminescence imaging in vehicle- or indisulam-treated mice in panel G. (I) H929 cells overexpressing RBM39 or RBM39G268V were treated with 20 μM indisulam for 48 hours followed by western blot analysis to detect the expression of RBM39, p65, and p-p65. (J) Dose-response curve of cell viability assay for H929 cells overexpressed RBM39 or RBM39G268V mutant. (K) Image of H929 xenografts with RBM39 or RBM39G268V overexpressing that were treated with indisulam (10 mg/kg) for 9 consecutive days. (L) H929 tumors growth curve in panel K. ∗P < .05, ∗∗P < .01, ∗∗∗P < .001, ∗∗∗∗P < .0001). vec, vector.
Indisulam is potent against MM in vitro and in vivo by selectively degrading RBM39. (A) Indisulam induced apoptosis in MM.1S, H929, and LP-1 cells. Apoptosis was detected after 48 hours of indisulam treatment. (B) Indisulam induced H929 cells cell cycle arrest at G2/M phase. Cell cycle was detected after 48 hours of indisulam treatment. (C) Indisulam inhibited H929 cell proliferation in a dose- and time-dependent manner. (D) The cyclin B1-CDK1 complex at the G2/M checkpoint was decreased after indisulam treatment. (E) Image of subcutaneous H929 tumor tissues treated with indisulam. H929 cells were injected into BALB/c nude mice to form subcutaneous tumors. The mice received 9 consecutive daily treatments with either vehicle or 10 mg/kg indisulam via intraperitoneal administration. (F) H929 tumors growth curve in panel E. (G) Bioluminescence images of mice transplanted with luciferase-labeled LP-1 (LP-1-luc) cells treated with vehicle or indisulam. LP-1-luc cells were injected into the tail vein of NOG mice. Five weeks after injection, the mice received 20 consecutive daily treatments of either vehicle or 20 mg/kg indisulam by intraperitoneal administration. Bioluminescence was detected at the indicated time points. (H) Quantification of bioluminescence imaging in vehicle- or indisulam-treated mice in panel G. (I) H929 cells overexpressing RBM39 or RBM39G268V were treated with 20 μM indisulam for 48 hours followed by western blot analysis to detect the expression of RBM39, p65, and p-p65. (J) Dose-response curve of cell viability assay for H929 cells overexpressed RBM39 or RBM39G268V mutant. (K) Image of H929 xenografts with RBM39 or RBM39G268V overexpressing that were treated with indisulam (10 mg/kg) for 9 consecutive days. (L) H929 tumors growth curve in panel K. ∗P < .05, ∗∗P < .01, ∗∗∗P < .001, ∗∗∗∗P < .0001). vec, vector.
We then evaluated the effect of indisulam in vivo using 2 mouse models of MM. One was established by subcutaneous injection of MM.1S and H929 cells into immunodeficient mice. The other was a model of disseminated MM established by injecting luciferase-labeled LP-1 cells into NOG mice via the tail vein, whose successful establishment was confirmed by the expression of CD138 in various organs (supplemental Figure 4A). Marked reductions in tumor volume (Figure 2E-F; supplemental Figure 4B-E) and bioluminescence intensity (Figure 2G-H) were observed in indisulam-treated mice compared with vehicle-treated mice. Immunohistochemical staining revealed a decrease in the proportion of CD138+ cells with decreased expression of the proliferation marker Ki67 but increased expression of the apoptosis marker cleaved caspase-3 in the tumors excised from mice treated with indisulam (supplemental Figure 4H). Moreover, no significant body weight loss was observed in either mouse model (supplemental Figure 4F-G, I).
To confirm that the antitumor activity of indisulam in MM is dependent on RBM39, we overexpressed RBM39G268V, a point mutant with a glycine-to-valine substitution in RBM39 (G268V), which influences the connection of DCAF15 and RBM39 mediated by indisulam18; MM cells harboring RBM39G268V were resistant to indisulam-mediated RBM39 degradation (Figure 2I; supplemental Figure 5A) and to the antiproliferative effects of indisulam both in vitro and in vivo (Figure 2J-L; supplemental Figure 5B). In contrast, knockdown of DCAF15 attenuated the inhibitory effects of indisulam (supplemental Figure 5C-D). Taken together, these findings indicate that indisulam is effective against MM both in vitro and in vivo through effects on the selective degradation of RBM39 via the recruitment of DCAF15.
Deletion of RBM39 leads to a profoundly altered splicing pattern in MM cells
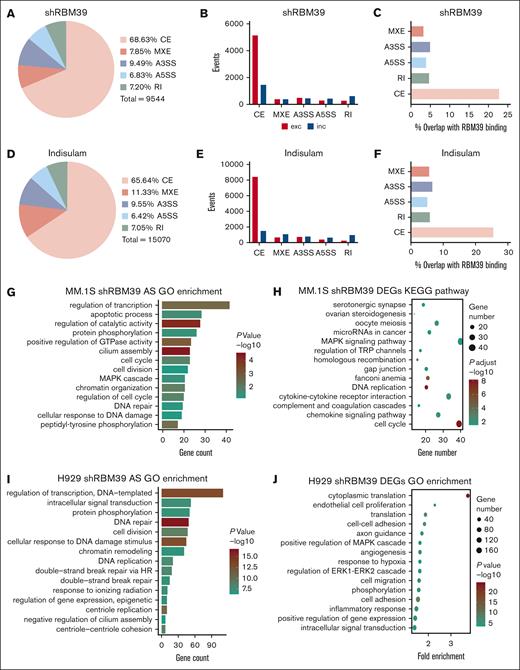
To identify the exact mechanism of RBM39 in MM cells, we immunoprecipitated RBM39 from MM.1S and H929 cells and performed mass spectrometry to profile the interaction partners of RBM39. As shown by Gene Ontology (GO) analysis, the identified interacting proteins exhibited strong enrichment in fundamental processes involved in RNA metabolism (supplemental Figure 6A-B). To map changes in AS after RBM39 deletion in MM cells, we performed RNA sequencing analysis on MM.1S cells after shRNA-mediated RBM39 knockdown or indisulam treatment. We evaluated significant changes in splicing (ΔPSI > 0.1) across 5 major types of AS products: cassette exons (CEs), alternative 5’ splice sites, alternative 3’ splice sites, mutually exclusive exons, and retained introns (supplemental Figure 6C). The predominant change in RNA splicing events upon RBM39 depletion was a change in CE events (Figure 3A,D). Within CEs, we found a greater proportion of exon exclusion events than of exon inclusion events (Figure 3B,E). We also detected widespread AS events in RBM39-knockdown H929 cells and found that most involved exon exclusion events (supplemental Figure 6D-I).
Deletion of RBM39 leads to an extensively altered splicing pattern in MM cells. (A) Number and percentage of differentially spliced events in MM.1S treated with RBM39 shRNA vs control scr (n = 2). (B) Events of exclusion or inclusion exon in differently spliced types in panel A. (C) Percent of differentially spliced events in panel A that overlap with RBM39 binding from anti-RBM39 RIP. (D) Number and percentage of differentially spliced events in MM.1S treated with indisulam vs dimethyl sulfoxide (n = 3). (E) Events of exclusion or inclusion exon in differently spliced types in panel D. (F) Percent of differentially spliced events in panel D that overlap with RBM39 binding from anti-RBM39 RIP. (G) GO analysis of AS events (ΔPSI > 0.4) in MM.1S treated with RBM39 shRNA vs control. (H) KEGG pathway analysis of differentially expressed genes in MM.1S treated with RBM39 shRNA vs control. (I) GO analysis of AS events (ΔPSI > 0.4) in H929 treated with RBM39 shRNA vs control (n = 3). (J) GO analysis of differentially expressed genes in H929 treated with RBM39 shRNA vs control. A3SSs, alternative 3’ splice sites; A5SSs, alternative 5’ splice sites; MXEs, mutually exclusive exons; RI, retained intron.
Deletion of RBM39 leads to an extensively altered splicing pattern in MM cells. (A) Number and percentage of differentially spliced events in MM.1S treated with RBM39 shRNA vs control scr (n = 2). (B) Events of exclusion or inclusion exon in differently spliced types in panel A. (C) Percent of differentially spliced events in panel A that overlap with RBM39 binding from anti-RBM39 RIP. (D) Number and percentage of differentially spliced events in MM.1S treated with indisulam vs dimethyl sulfoxide (n = 3). (E) Events of exclusion or inclusion exon in differently spliced types in panel D. (F) Percent of differentially spliced events in panel D that overlap with RBM39 binding from anti-RBM39 RIP. (G) GO analysis of AS events (ΔPSI > 0.4) in MM.1S treated with RBM39 shRNA vs control. (H) KEGG pathway analysis of differentially expressed genes in MM.1S treated with RBM39 shRNA vs control. (I) GO analysis of AS events (ΔPSI > 0.4) in H929 treated with RBM39 shRNA vs control (n = 3). (J) GO analysis of differentially expressed genes in H929 treated with RBM39 shRNA vs control. A3SSs, alternative 3’ splice sites; A5SSs, alternative 5’ splice sites; MXEs, mutually exclusive exons; RI, retained intron.
To validate the direct role of RBM39 in AS regulation, we performed RNA immunoprecipitation (RIP) using an anti-RBM39 antibody in MM.1S cells and then performed RIP sequencing to identify RNA targets of RBM39. We focused on the overlap between the RBM39 targets and the AS events induced by RBM39 deletion. The results revealed that 39.67% of the RBM39 targets were also alternatively spliced upon RBM39 knockdown and that CEs accounted for 22.76% of these AS events (Figure 3C); in addition, 49.09% of the RBM39 targets were also alternatively spliced upon pharmacological degradation of RBM39, and CEs accounted for 25.54% of these events (Figure 3F). Collectively, these findings suggest that RBM39 plays a direct role in regulating the splicing of its mRNA targets and that RBM39 deletion leads to extensive AS in MM cells.
Full-length MEK5 is highly expressed in MM and spliced by RBM39
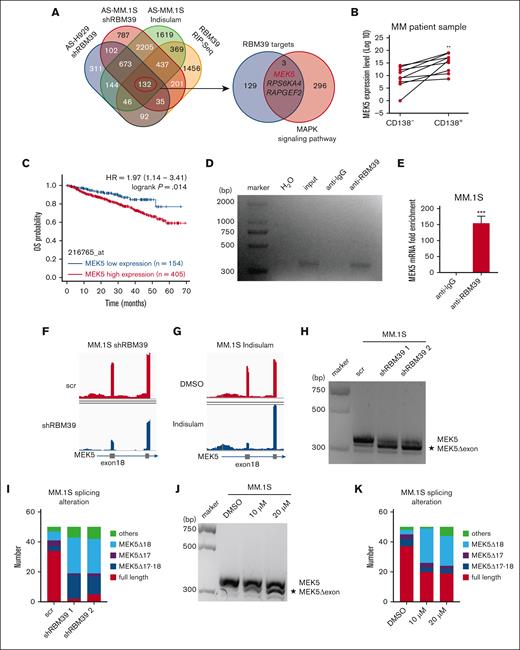
To determine the impact of these extensive and aberrant changes in AS, we performed GO enrichment analysis of the notably differentially spliced genes (ΔPSI > 0.4) resulting from RBM39 knockdown in MM.1S and H929 cells. These genes exhibited enrichment in terms related to transcription, apoptosis, the cell cycle, the MAPK cascade, protein phosphorylation, DNA damage, and DNA repair (Figure 3G,I). Enrichment analysis of the differentially expressed genes targeted by shRBM39 revealed enrichment of these genes in the MAPK signaling pathway, consistent with the results of GO analysis of the alternatively spliced genes (Figure 3H,J). DNA damage and repair and the cell cycle have previously been documented in other tumors with RBM39 ablation,17,32 but the role of the MAPK signaling pathway has not been addressed. On this basis, we sought to identify MAPK-related genes related to MM cell survival that are also bound to and spliced by RBM39 and are thus likely to underline the oncogenic role of RBM39 in MM. To this end, we constructed Venn diagrams with the target genes of RBM39 (defined by the intersecting set of the identified AS events and the RBM39-bound RNAs) and the set of genes in the MAPK signaling pathway (Figure 4A). Among these 3 genes, MEK5, a nonredundant member of the MAPK family that regulates proliferation and apoptosis in various tumors, is likely to promote the malignant growth of MM, given that its direct downstream target Erk5 has been reported to play a multifunctional role in MM.33,34
Full-length MEK5 is highly expressed in MM and spliced by RBM39. (A) Venn diagram showing overlap of identified AS events and RBM39-bound RNA (left). The overlap of 4 data sets was defined as RBM39 targets. Venn diagram showing the overlap of defined RBM39 targets and genes of the MAPK signaling pathway from KEGG (hsa04010) (right). (B) MEK5 mRNA expression level in CD138− and CD138+ cells from BM of patients with newly diagnosed MM. (C) Elevated MEK5 was significantly correlated with poor overall survival in MM. Data from GSE2658. (D) RIP with anti-RBM39 followed by reverse transcription (RT)-PCR with MEK5 primers in MM.1S cells. (E) Quantitative RT-PCR analysis of enriched MEK5 in RIP with anti-RBM39 in MM.1S cells. (F) RNA sequencing (RNA-seq) coverage plot of MEK5 in MM.1S cells treated with RBM39 shRNA or control. (G) RNA-seq coverage plot of MEK5 in MM.1S cells treated with indisulam or dimethyl sulfoxide. (H) PCR analysis of different MEK5 isoforms from MM.1S treated with shRBM39 or scr. PCR products were analyzed by 3% agarose gel electrophoresis. (I) Number of different isoforms in MEK5 PCR products in panel H. PCR products were extracted from the gel and ligated to the pMD-T19 vector. The ligation products were transformed into DH5α and 50 clones were sequenced and aligned to MEK5. (J) PCR analysis of different MEK5 isoforms from MM.1S treated with indisulam or dimethyl sulfoxide. PCR products were analyzed by 3% agarose gel electrophoresis. (K) Number of different isoforms in MEK5 PCR products in panel J. ∗∗P < .01, ∗∗∗P < .001. MEK5Δ17-18, MEK5 transcripts with exon 17-18 loss, MEK5Δ18, MEK5 transcript with exon 18 loss.
Full-length MEK5 is highly expressed in MM and spliced by RBM39. (A) Venn diagram showing overlap of identified AS events and RBM39-bound RNA (left). The overlap of 4 data sets was defined as RBM39 targets. Venn diagram showing the overlap of defined RBM39 targets and genes of the MAPK signaling pathway from KEGG (hsa04010) (right). (B) MEK5 mRNA expression level in CD138− and CD138+ cells from BM of patients with newly diagnosed MM. (C) Elevated MEK5 was significantly correlated with poor overall survival in MM. Data from GSE2658. (D) RIP with anti-RBM39 followed by reverse transcription (RT)-PCR with MEK5 primers in MM.1S cells. (E) Quantitative RT-PCR analysis of enriched MEK5 in RIP with anti-RBM39 in MM.1S cells. (F) RNA sequencing (RNA-seq) coverage plot of MEK5 in MM.1S cells treated with RBM39 shRNA or control. (G) RNA-seq coverage plot of MEK5 in MM.1S cells treated with indisulam or dimethyl sulfoxide. (H) PCR analysis of different MEK5 isoforms from MM.1S treated with shRBM39 or scr. PCR products were analyzed by 3% agarose gel electrophoresis. (I) Number of different isoforms in MEK5 PCR products in panel H. PCR products were extracted from the gel and ligated to the pMD-T19 vector. The ligation products were transformed into DH5α and 50 clones were sequenced and aligned to MEK5. (J) PCR analysis of different MEK5 isoforms from MM.1S treated with indisulam or dimethyl sulfoxide. PCR products were analyzed by 3% agarose gel electrophoresis. (K) Number of different isoforms in MEK5 PCR products in panel J. ∗∗P < .01, ∗∗∗P < .001. MEK5Δ17-18, MEK5 transcripts with exon 17-18 loss, MEK5Δ18, MEK5 transcript with exon 18 loss.
To investigate the expression level of MEK5 in MM cells to assess its possible role in MM tumorigenesis, we explored publicly available data and found that MEK5 exhibited progressive upregulation from normal donors to patients with MM and from patients with monoclonal gammopathy of unknown significance to patients with smoldering MM by expression profiling in 2 independent data sets (supplemental Figure 7A-B). Moreover, MEK5 expression was confirmed to be greater in CD138+ cells than in CD138− cells by quantitative PCR (Figure 4B). Furthermore, by mining data from multiple clinical trials of patients with primary MM with available outcome data, we found that patients with MM with higher MEK5 expression in tumor cells generally had significantly worse outcomes in the clinical trials (Figure 4C). Taken together, these observations strongly suggest a previously uninvestigated role for MEK5 in promoting the malignant growth of MM.
Next, we sought to confirm whether MEK5 is alternatively spliced directly by RBM39. PCR or quantitative PCR after anti-RBM39 RIP revealed apparent enrichment of MEK5 mRNA (Figure 4D-E; supplemental Figure 7C-D), suggesting that RBM39 binds to MEK5 mRNA directly. Moreover, RNA sequencing revealed that MEK5 was aberrantly spliced and identified MEK5 exon 18 loss in MM cells after RBM39 knockdown or indisulam treatment (Figure 4F-G). To characterize this specific splicing pattern, we amplified the MEK5 exon 16-19 fragment by PCR using specific primers. We detected a novel, shorter DNA fragment of MEK5 upon RBM39 knockdown in MM cells, and this fragment was presumed to be MEK5 with exon loss (Figure 4H; supplemental Figure 7E). To further validate this MEK5 mRNA sequence, we excised DNA fragments from agarose electrophoresis gels and sequenced them. The alignment results showed that the proportion of full-length MEK5 decreased but the abundance of MEK5Δ18 increased, accompanied by a low abundance of MEK5Δ17-18 (Figure 4I). Similarly, we detected the same shorter MEK5 isoform in MM cells treated with indisulam and found that its abundance increased in a dose-dependent manner (Figure 4J; supplemental Figure 7F). Moreover, the alignment results confirmed loss of MEK5 exon 18 (Figure 4K). To further prove the relationship between mis-splicing of MEK5 and RBM39 ablation, MM cells overexpressing RBM39/RBM39G268V were treated with indisulam. The expression of RBM39G268V rescued the MEK5 splicing defect (supplemental Figure 7G-H). Taken together, these findings indicate that MEK5 is bound to and alternatively spliced by RBM39 and that the splicing of full-length MEK5 relies on RBM39.
Full-length MEK5 contributes to the increased proliferation and survival of MM cells
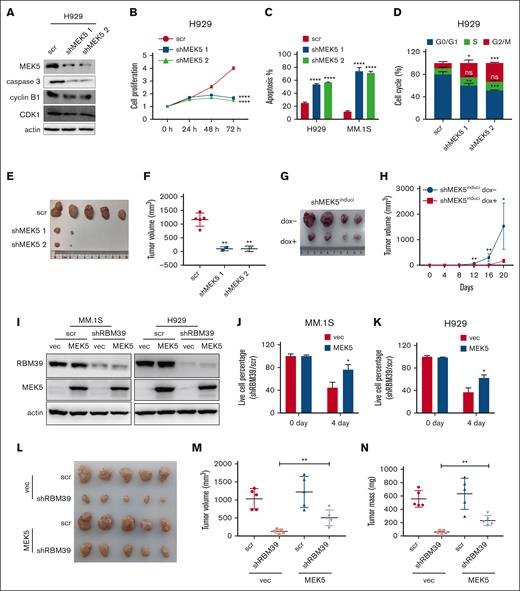
To determine the molecular functions of the MEK5 isoforms with AS regulated by RBM39, we first knocked down the full-length MEK5 in MM cells (Figure 5A; supplemental Figure 8A). This action suppressed MM cell proliferation and induced apoptosis and G2/M arrest (Figure 5B-D; supplemental Figure 8B-C). When H929 cells with full-length MEK5 knockdown were injected subcutaneously into mice, tumor growth was minimal (supplemental Figures 8D, 5E-F). Moreover, the U266 subcutaneous xenografts formed from cells with dox-inducible MEK5 knockdown grew more slowly than those in the control group (Figure 5G-H; supplemental Figure 8E). In addition, knockdown of full-length MEK5 with shRNA specifically targeting MEK5 exon 18 impaired the malignant growth of MM (supplemental Figure 8F-L). Thus, these results indicated that full-length MEK5 constitutively expressing exon 18 was essential for MM cell proliferation and survival. To confirm whether RBM39 deletion inhibits the malignant growth of MM via MEK5 mis-splicing, we overexpressed full-length MEK5 in MM cells with RBM39 knockdown (Figure 5I) and assessed cell viability. It showed that overexpression of full-length MEK5 partially protected H929 and MM.1S cells against the lethality of RBM39 knockdown (Figure 5J-K). Moreover, the overexpression of full-length MEK5 partially reversed the decrease in subcutaneous tumor growth induced by RBM39 knockdown (Figure 5L-N). Therefore, RBM39 supports MM cell survival by maintaining the canonical splicing of full-length MEK5.
Full-length MEK5 contributes to enhanced proliferation and survival of MM cells. (A) Full-length MEK5 was knocked down in H929 cells. Expression of caspase 3 and cyclin B1-CDK1 complex was detected by western blotting. (B) Knockdown of full-length MEK5 inhibited the proliferation of H929 cells. Cell viability was determined by CCK-8 assay at the indicated time points. (C) Knockdown of full-length MEK5 induced apoptosis in H929 and MM.1S cells, which was detected 48 hours after infection. (D) Knockdown of full-length MEK5 induced cell cycle arrest of H929 cells at the G2/M phase, which was detected 48 hours after infection. (E) Images of subcutaneous tumor tissues with MEK5 knockdown. H929 cells with full-length MEK5 knockdown were subcutaneously inoculated into the hind flanks of 6-week-old female NOG mice. The mice were euthanized 5 weeks after inoculation. (F) Tumor volume of the subcutaneous tumor in panel E after sacrificing the mice. (G) Images of subcutaneous tumor tissue with U266-inducible MEK5 knockdown cells. U266 cells with dox-inducible shMEK5 2 were subcutaneously inoculated into the hind flank of 6-week-old female NOG mice. The mice were euthanized 20 days after inoculation. (H) Tumor sizes were measured every 4 days. (I) RBM39 was knocked down in H929 or MM.1S cells overexpressing full-length MEK5. (J,K) Expression of full-length MEK5 partially rescued H929 or MM.1S cells from the lethality of an shRNA targeting RBM39. (L) Expression of full-length MEK5 partially rescued H929 subcutaneous tumors from the growth inhibition of shRBM39. (M,N) Tumor volume and tumor mass of H929 subcutaneous tumors in panel L. ∗P < .05, ∗∗P < .01, ∗∗∗P < .001, ∗∗∗∗P < .0001. CCK-8, Cell Counting Kit-8.
Full-length MEK5 contributes to enhanced proliferation and survival of MM cells. (A) Full-length MEK5 was knocked down in H929 cells. Expression of caspase 3 and cyclin B1-CDK1 complex was detected by western blotting. (B) Knockdown of full-length MEK5 inhibited the proliferation of H929 cells. Cell viability was determined by CCK-8 assay at the indicated time points. (C) Knockdown of full-length MEK5 induced apoptosis in H929 and MM.1S cells, which was detected 48 hours after infection. (D) Knockdown of full-length MEK5 induced cell cycle arrest of H929 cells at the G2/M phase, which was detected 48 hours after infection. (E) Images of subcutaneous tumor tissues with MEK5 knockdown. H929 cells with full-length MEK5 knockdown were subcutaneously inoculated into the hind flanks of 6-week-old female NOG mice. The mice were euthanized 5 weeks after inoculation. (F) Tumor volume of the subcutaneous tumor in panel E after sacrificing the mice. (G) Images of subcutaneous tumor tissue with U266-inducible MEK5 knockdown cells. U266 cells with dox-inducible shMEK5 2 were subcutaneously inoculated into the hind flank of 6-week-old female NOG mice. The mice were euthanized 20 days after inoculation. (H) Tumor sizes were measured every 4 days. (I) RBM39 was knocked down in H929 or MM.1S cells overexpressing full-length MEK5. (J,K) Expression of full-length MEK5 partially rescued H929 or MM.1S cells from the lethality of an shRNA targeting RBM39. (L) Expression of full-length MEK5 partially rescued H929 subcutaneous tumors from the growth inhibition of shRBM39. (M,N) Tumor volume and tumor mass of H929 subcutaneous tumors in panel L. ∗P < .05, ∗∗P < .01, ∗∗∗P < .001, ∗∗∗∗P < .0001. CCK-8, Cell Counting Kit-8.
Aberrantly spliced isoforms of MEK5 exhibit loss of function and are prone to proteasomal degradation
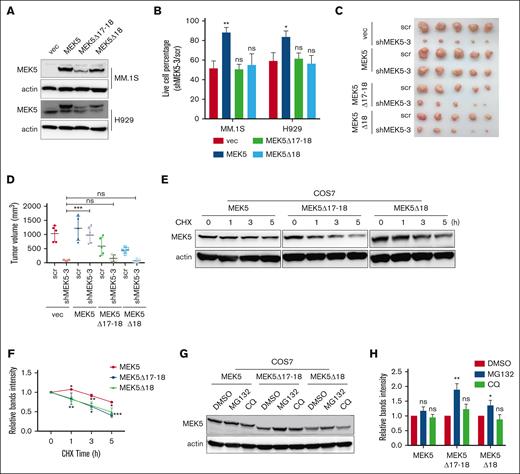
Given that the levels of aberrantly spliced isoforms of MEK5, including MEK5Δ17-18 and MEK5Δ18, were increased in apoptotic MM cells, we overexpressed these isoforms to investigate their function using full-length MEK5 as a normal control (Figure 6A). It showed that the expression of different isoforms of MEK5, even full-length MEK5, did not significantly affect the proliferation or apoptosis of MM cells (supplemental Figure 9A-D). Next, we overexpressed full-length MEK5 or aberrantly spliced MEK5 isoforms in MM.1S cells with endogenous MEK5 knockdown with shMEK5 3 specifically targeted to the 3'UTR region of MEK5. Our findings revealed that full-length MEK5 promoted MM cell survival, whereas MEK5Δ17-18 and MEK5Δ18 were unable to restore cell viability (Figure 6B). These cells were also inoculated subcutaneously into NOG mice. As expected, only full-length MEK5 reversed the slowing of tumor growth caused by endogenous MEK5 knockdown (Figure 6C-D; supplemental Figure 9E). The abovementioned results indicate that the aberrant MEK5Δ17-18 and MEK5Δ18 isoforms exhibit loss of function.
Aberrant splicing isoforms of MEK5 exhibit loss of function and are prone to be degraded through proteasome. (A) Overexpression of different MEK5 isoforms in H929 and MM.1S cells. (B) Effects of overexpression of different MEK5 isoforms on the lethality of MM.1S or H929 cells caused by shRNA targeting the MEK5 3'UTR (shMEK5 3). (C) Effects of overexpression of different MEK5 isoforms on subcutaneous tumor growth inhibition by shRNA targeting the MEK5 3'UTR. (D) Tumor volume of H929 subcutaneous tumors in panel C. (E) Protein of different MEK5 isoforms overexpressed in COS7 treated with cycloheximide (CHX) detected by western blotting. (F) The protein levels of MEK5 isoforms in panel E were evaluated and plotted on the graph. (G) Protein level of different MEK5 isoforms in COS7 cells treated with MG132 or chloroquine (CQ) detected by western blotting. (H) The protein levels of MEK5 isoforms in panel G were evaluated and plotted on the graph. ∗P < .05, ∗∗P < .01, ∗∗∗P < .001.
Aberrant splicing isoforms of MEK5 exhibit loss of function and are prone to be degraded through proteasome. (A) Overexpression of different MEK5 isoforms in H929 and MM.1S cells. (B) Effects of overexpression of different MEK5 isoforms on the lethality of MM.1S or H929 cells caused by shRNA targeting the MEK5 3'UTR (shMEK5 3). (C) Effects of overexpression of different MEK5 isoforms on subcutaneous tumor growth inhibition by shRNA targeting the MEK5 3'UTR. (D) Tumor volume of H929 subcutaneous tumors in panel C. (E) Protein of different MEK5 isoforms overexpressed in COS7 treated with cycloheximide (CHX) detected by western blotting. (F) The protein levels of MEK5 isoforms in panel E were evaluated and plotted on the graph. (G) Protein level of different MEK5 isoforms in COS7 cells treated with MG132 or chloroquine (CQ) detected by western blotting. (H) The protein levels of MEK5 isoforms in panel G were evaluated and plotted on the graph. ∗P < .05, ∗∗P < .01, ∗∗∗P < .001.
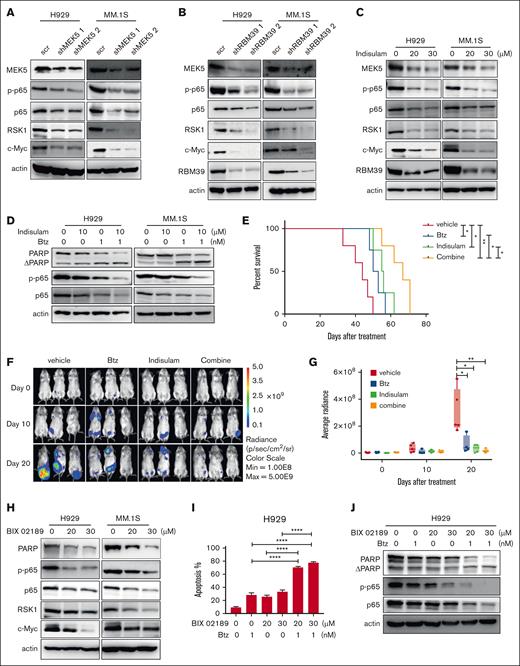
When RBM39 was knocked down or MM cells were treated with indisulam, there was no obvious change in the expression level of total MEK5 mRNA owing to AS. However, the MEK5 protein level decreased, with no increase in the levels of alternatively spliced isoforms detected (Figure 7B-C). Furthermore, the overexpression efficiency of MEK5Δ17-18 and MEK5Δ18 was relatively lower than that of full-length MEK5 under the same infection rate conditions (Figure 6A). These observations suggested that the translated aberrant MEK5 isoforms might be unstable. To test this hypothesis, we overexpressed MEK5 isoforms in COS7 and H929 cells and inhibited nascent protein synthesis using cycloheximide to examine protein stability. MEK5Δ17-18 and MEK5Δ18 tended to be degraded more rapidly than full-length MEK5 (Figure 6E-F; supplemental Figure 9F-G). Next, we used the proteasome inhibitor MG132 or the lysosome inhibitor chloroquine to clarify the degradation pathway of the aberrant MEK5 isoforms. The expression of MEK5Δ17-18 and MEK5Δ18 was upregulated by MG132 (Figure 6G-H), demonstrating that MEK5Δ17-18 and MEK5Δ18 are prone to proteasomal degradation. These findings indicate that aberrantly spliced isoforms of MEK5, which exhibit loss of function and degraded by the proteasome, cannot support MM tumorigenesis.
Inhibiting RBM39-MEK5 enhances the cytotoxicity of bortezomib by inhibiting p65. (A) p65, RSK1, and c-Myc were decreased under the condition of MEK5 knockdown, which was detected 48 hours after infection by western blotting. (B) MEK5, p65, RSK1, and c-Myc were decreased under the condition of RBM39 knockdown, which was detected 48 hours after infection by western blotting. (C) MEK5, p65, RSK1, and c-Myc were decreased under the condition of indisulam treatment, which was detected 48 hours after treatment by western blotting. (D) H929 or MM1.S cells were treated by single indisulam/Btz or both the drugs, followed by western blotting to detect the protein level of PARP, p65, and p-p65. Indisulam and Btz synergistically inhibited p65. (E) Kaplan-Meier overall survival of indisulam/Btz-treated mice in LP-1-luc disseminated xenograft mice. Mice were transplanted with LP-1 luciferase cells and treated with single indisulam/Btz or both of the drugs. The mice received indisulam every other day by intraperitoneal administration at a dose of 20 mg/kg, for a total of 10 doses. Btz was given at days 1, 4, 8, and 11 via tail vein at dosage of 1 mg/kg. (F) Bioluminescent imaging of LP-1-luc cell transplanted mice treated with single indisulam/Btz or both the drugs. Representative images of 3 mice/group are shown (vehicle group, n = 5; indisulam group, n = 4; Btz group, n = 4; combine group, n = 5). (G) Quantification of bioluminescence signals in panel F at indicated time points. (H) p65, RSK1, and c-Myc were decreased on the condition of MEK5 inhibitor BIX 02189 treatment, which was detected 48 hours after treatment by western blotting. (I) H929 cells were treated by either or both of drugs and cell apoptosis was detected by annexin V/PI 48 hours later. (J) BIX 02189 and Btz synergistically inhibited the expression of p65 and p-p65 and induced PARP cleavage in H929. ∗∗∗∗P < .0001. PI, propidium iodide.
Inhibiting RBM39-MEK5 enhances the cytotoxicity of bortezomib by inhibiting p65. (A) p65, RSK1, and c-Myc were decreased under the condition of MEK5 knockdown, which was detected 48 hours after infection by western blotting. (B) MEK5, p65, RSK1, and c-Myc were decreased under the condition of RBM39 knockdown, which was detected 48 hours after infection by western blotting. (C) MEK5, p65, RSK1, and c-Myc were decreased under the condition of indisulam treatment, which was detected 48 hours after treatment by western blotting. (D) H929 or MM1.S cells were treated by single indisulam/Btz or both the drugs, followed by western blotting to detect the protein level of PARP, p65, and p-p65. Indisulam and Btz synergistically inhibited p65. (E) Kaplan-Meier overall survival of indisulam/Btz-treated mice in LP-1-luc disseminated xenograft mice. Mice were transplanted with LP-1 luciferase cells and treated with single indisulam/Btz or both of the drugs. The mice received indisulam every other day by intraperitoneal administration at a dose of 20 mg/kg, for a total of 10 doses. Btz was given at days 1, 4, 8, and 11 via tail vein at dosage of 1 mg/kg. (F) Bioluminescent imaging of LP-1-luc cell transplanted mice treated with single indisulam/Btz or both the drugs. Representative images of 3 mice/group are shown (vehicle group, n = 5; indisulam group, n = 4; Btz group, n = 4; combine group, n = 5). (G) Quantification of bioluminescence signals in panel F at indicated time points. (H) p65, RSK1, and c-Myc were decreased on the condition of MEK5 inhibitor BIX 02189 treatment, which was detected 48 hours after treatment by western blotting. (I) H929 cells were treated by either or both of drugs and cell apoptosis was detected by annexin V/PI 48 hours later. (J) BIX 02189 and Btz synergistically inhibited the expression of p65 and p-p65 and induced PARP cleavage in H929. ∗∗∗∗P < .0001. PI, propidium iodide.
Inhibiting the RBM39-MEK5 axis increases the cytotoxicity of Btz
Based on the abovementioned results, we concluded that the RBM39-MEK5 axis plays an important role in MM. However, the potential underlying mechanism remains unknown. Previous studies have reported that p65, RSK1, and c-Myc are upregulated by MEK5 to promote cell proliferation and survival in some tumors.33,35 When we knocked down MEK5 in MM, the expression of p65, RSK1, and c-Myc was also decreased (Figure 7A). The absence of RBM39 reduced the level of functional MEK5, which further led to the downregulation of p65, RSK1, and c-Myc (Figure 7B-C). Thus, the RBM39-MEK5 axis upregulates p65, RSK1, and c-Myc in MM cells to promote their proliferation and survival.
Aberrant activation of p65 is involved in the malignant growth of MM.36 Bortezomib (Btz), which inhibits p65 activation,37 is the first-line drug used in the clinical treatment of MM. Based on the observation that indisulam and Btz have the same target, we used indisulam in combination with Btz to treat MM cells to prevent drug resistance and improve the therapeutic response. The combination of Btz and indisulam had strong synergistic effects on MM cell lines (supplemental Figure 10A-H). It increased the expression of apoptotic proteins and inhibited p65 expression in MM cells (Figure 7D). In addition, tumor-bearing mice, including mice bearing MM.1S subcutaneous xenografts and mice in the luciferase-labeled LP-1 disseminated MM xenograft model, were randomized for treatment with vehicle, Btz, indisulam, or the combination of Btz + indisulam. Significant decreases in the tumor growth rate and tumor volume and prolonged survival were observed in the Btz + indisulam group (Figure 7E-G; supplemental Figure 10I-L).
Given the important role of MEK5 in MM, we targeted MEK5 in MM cells with the specific inhibitor BIX 02189. This treatment not only induced apoptosis in MM cell lines but also inhibited the growth of primary MM cells (supplemental Figure 11A-C). BIX 02189 was shown to decrease p65, RSK1, and c-Myc expression (Figure 7H). Combination treatment experiments showed that the combination of BIX 02189 and Btz led to an increase in H929 and MM.1S cells apoptosis (Figure 7I; supplemental Figure 12A). The combination treatment group exhibited a more significant increase in the PARP cleavage rate and a more significant reduction in p65 expression than did either of the monotherapy groups (Figure 7J; supplemental Figure 12B). The combination of BIX 02189 and Btz led to a synergistic inhibition in MM cell viability (supplemental Figure 12C-J).
In summary, inhibiting RBM39 or MEK5 increases the cytotoxicity of Btz by inhibiting p65, providing a new combination strategy for clinical treatment.
Discussion
Aberrant AS and splicing factor expression have been reported to participate in the tumorigenesis of MM. Here, we revealed a specific mechanism of action of the splicing factor RBM39 in MM. RBM39 regulates the cell cycle, DNA damage, and DNA repair through AS in MM, mechanisms that are also involved in acute myeloid leukemia and breast cancer. The MAPK signaling pathway has been identified to be specifically regulated by RBM39 in MM. RBM39 has been demonstrated to maintain the splicing of full-length MEK5, an important MAPK family member, and full-length MEK5 is essential for MM cell proliferation and survival. When RBM39 is knocked down or pharmacologically degraded, MEK5 is subject to exon loss, resulting in loss of function of MEK5 and a propensity for degradation.
Here, we report a new regulatory form of MEK5. MEK5 is upregulated and activated in various cancers, affecting the expression and activity of cell cycle regulators that contribute to tumorigenesis.38-42 MEK5 is upregulated by the transcription factor Stat3 or REST43,44 and activated by upstream MEKK2/MEKK3 phosphorylation,45,46 which can also be blocked by MEKK2/3 ubiquitination.47 Here, we show that the expression of the functional full-length isoform of MEK5 is dependent on the splicing factor RBM39 in MM. The specific mechanism of MEK5Δ18 and MEK5Δ17-18 loss of function remains to be further investigated. A previous study reported that MEK5 activation is triggered upon serine 311 and threonine 315 phosphorylation.45,46 Exons 17 and 18 of MEK5 encode amino acids 349 to 367, which contain tyrosine 356 and serine 365, other potential phosphorylation sites. We also speculate that aberrant MEK5 isoforms exhibit misfolding, leading to endoplasmic reticulum retention or masking of the canonical phosphorylation sites.48 Considering the lethal effect of MEK5 exon 18 loss, the results of this study might inspire the design of specific targeted drugs.
We applied indisulam to target RBM39 to inhibit the malignant growth of MM in vitro and in vivo, demonstrating that it was highly effective and safe for MM treatment. On the one hand, indisulam combats tumors through direct tumor suppression via dysregulation of AS. On the other hand, indisulam can also activate adaptive immune responses via neoantigen generation through aberrant splicing,49 suggesting that indisulam has more potent anti-MM effects on immunosuppressed patients with MM. Moreover, indisulam exhibited no overt toxicity in a mouse model, showing minimal adverse effects on hematopoietic cells and causing only minor splicing alterations in nontumor tissues.15,17,49 Thus, indisulam is expected to be a potent and safe anti-MM drug. Moreover, we found that indisulam increased the cytotoxicity of Btz during the treatment of MM and that combined administration of indisulam and Btz was well tolerated in mice, providing a foundation for improvements in clinical strategies. Based on the potent antitumor activity of indisulam and its ability to promote adoptive immunity, the effects of the combination of indisulam and Btz are expected to be comparable with those of the classic combination of lenalidomide and Btz.
In conclusion, our study suggests that the RBM39-MEK5 axis supports MM cell survival. Targeting RBM39 or MEK5 is a potent anti-MM strategy that synergizes with Btz treatment by inhibiting p65.
Acknowledgments
The authors thank the patients in this study.
This work was supported by National Nature Science Foundation of China grants 81970192 and 82170195 (H.Y.), 82170145 (Y.W.), and 82300228 (Z.Z.), National Key Research and Development, Program of China grant 2017YFA0505200 (Y.W.), and Science and Technology Committee of Shanghai grant 20ZR1430600 (Y.W.).
Authorship
Contribution: H.Y., Y.W., J.L., Z.Z., and W.X. designed the study and wrote the manuscript; J.L., Z.Z., X.Z., C.W., M.J., and Z.F. performed the in vitro experiments; J.L., Z.Z., X.Z., and M.J. performed the animal experiments; J.L. and Z.Z. analyzed the data; J.L. and W.X. analyzed various genomics data sets; W.X., C.Y., and C.W. collected clinical samples; and X.X., H.X., and H.L. provided reagents and helped with data analysis.
Conflict-of-interest disclosure: The authors declare no competing financial interests.
Correspondence: Hua Yan, Ruijin Hospital Affiliated to Shanghai Jiao Tong University School of Medicine, 197 Ruijin 2nd Rd, Shanghai, 200025, China; email: yanhua_candy@163.com; and Yingli Wu, Shanghai Jiao Tong University School of Medicine, 227 Chongqing South Rd, Shanghai, 200025, China; email: wuyingli@shsmu.edu.cn.
References
Author notes
J.L., Z.Z., and W.X. contributed equally to this work.
The mass spectrometry proteomics data have been deposited with the ProteomeXchange Consortium via the iProX partner repository with the data set identifier PXD060610. RNA sequencing data have been deposited in the NCBI Gene Expression Omnibus and is accessible via the Gene Expression Omnibus series accession number GSE289169.
Original data are available on request to corresponding author, Hua Yan (yanhua_candy@163.com).
The full-text version of this article contains a data supplement.

