Key Points
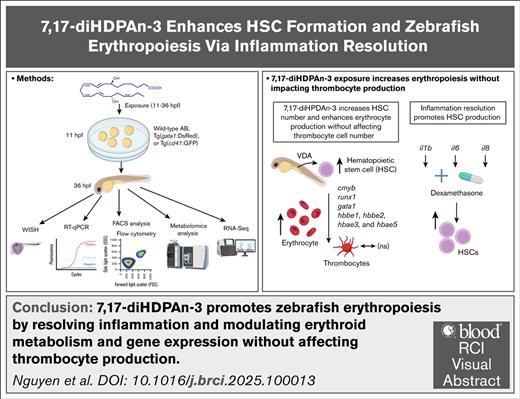
7,17-diHDPAn-3 exposure enhances erythropoiesis without affecting thrombocyte development.
7,17-diHDPAn-3 action is mediated through inflammation resolution at a developmental time that supports hematopoietic stem cell formation.
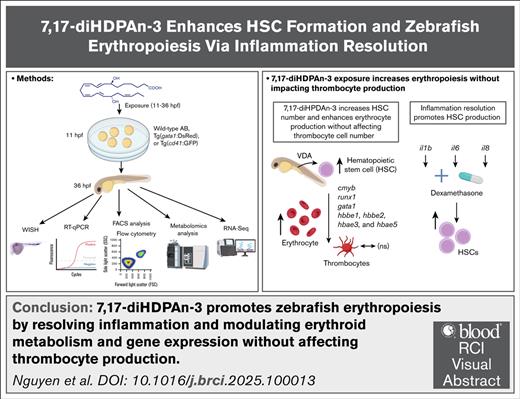
Visual Abstract
Erythropoiesis is a vital process for blood production, and its disruption contributes to various forms of anemia. In this study, we investigated the hematopoietic effects of bioactive lipid mediators derived from n-3 polyunsaturated fatty acids (n-3 PUFAs), focusing on a class of compounds known as specialized proresolving mediators (SPMs) that promote inflammation resolution. Using zebrafish embryos, we screened several n-3 PUFA–derived SPMs and identified 7(S),17(S)-dihydroxydocosapentaenoic acid (7,17-diHDPAn-3) that significantly enhances erythropoiesis. Exposure to 7,17-diHDPAn-3 upregulated gata1, a key erythroid progenitor marker, and led to increased erythrocyte numbers in both primitive and definitive waves of erythropoiesis. Importantly, the production of platelets, which share a common progenitor with erythrocytes, was unaffected. Metabolomic analysis of sorted erythroid cells, using the transgenic zebrafish line Tg(gata1:DsRed), revealed modest shifts in erythroid cell metabolic profiles. These findings suggest that the erythroid cells produced upon 7,17-diHDPAn-3 exposure, retain a metabolically acceptable profile. In parallel, RNA-sequencing analysis of these cells showed upregulation of hsp90, a heat shock protein gene involved in heme biosynthesis, and downregulation of xpo1b, a gene associated with erythroid maturation. Although we also observed an increase in hematopoietic stem cell-associated genes such as cmyb and runx1, these effects were relatively modest. In combination with dexamethasone, an anti-inflammatory steroid, 7,17-diHDPAn-3 further enhanced the expression of these gene markers, suggesting a potential link between inflammation resolution and early hematopoietic development. Our findings highlight 7,17-diHDPAn-3 as a promising candidate for promoting erythropoiesis and improving red blood cell recovery in vivo, with potential relevance to anemia treatment.
Introduction
Erythrocytes (red blood cells [RBCs]) are produced through erythropoiesis from differentiating hematopoietic stem cell (HSC) progenitors.1,2 Multipotent HSCs can self-renew and give rise to all blood cell types during hematopoiesis, the broader process of blood cell production.1,3 HSCs are regulated by a complex network of transcriptional factors, including cmyb, a key regulator that controls HSC self-renewal and differentiation, and runx1, which is essential for the emergence and maintenance of HSCs during embryonic development and adult hematopoiesis.1,4 The human body has >25 trillion circulating RBCs, with ∼200 billion new erythrocytes generated daily in the bone marrow to replace senescent RBCs.5 Erythrocytes play a vital role in transporting oxygen from the lungs to cells, where oxygen is used in mitochondrial oxidative phosphorylation to produce adenosine triphosphate for powering cellular activities.6
Impaired erythropoiesis can cause anemia in various inherited and acquired disorders.6-8 Anemia, marked by low hemoglobin (Hb) levels and reduced oxygen transport to tissues, emphasizes the vital importance of erythropoiesis for human health.7 Extensive research has characterized the regulatory mechanisms and factors that control erythropoiesis, including DNA modification, transcriptional regulation, and translational control. Russell and Bernstein's initial research established the foundation for understanding erythroid cell development during embryonic stages.9 Recent research has uncovered the importance of other regulatory mechanisms in erythropoiesis, such as microRNAs, histone modifiers, and DNA modifiers.10,11 At the transcriptional level, RBC development is regulated by multiple factors, including gata1, which initiates the gene expression program that drives erythroid progenitor proliferation and differentiation.12-16 Additional factors that regulate erythropoiesis include glucocorticoids, cytokines, and cell-cell interactions.17,18 Among these, dexamethasone, a synthetic glucocorticoid, can enhance the expansion of erythroid progenitor cells under stress or chronic anemia.19,20
Although lipid mediators that have proinflammatory effects have been evaluated during hematopoiesis, such as prostaglandin E2, improve HSC homing, survival, and proliferation,21,22 a study by Lahvic et al revealed that oxylipin 11,12-epoxyeicosatrienoic acid, which is classified as an anti-inflammatory lipid mediator, enhances vertebrate hematopoiesis via the GPR132 receptor.23 Although these studies have advanced our understanding of erythropoiesis, the potential role of specialized proresolving mediators (SPMs) remains largely unexplored. Building on these studies, we investigated the potential effects of novel mediators derived from n-3 docosapentaenoic acid, which specializes in the resolution of inflammation.24 Using whole-mount in situ hybridization (WISH) for cmyb and o-dianisidine (O-D) staining, we identified 7(S),17(S)-dihydroxydocosapentaenoic acid (7,17-diHDPAn-3) as a novel SPM that enhances the production of both HSCs and RBCs during embryonic zebrafish development. Based on these observations, we hypothesized that 7,17-diHDPAn-3 increases HSC number by promoting inflammation resolution, thereby enhancing erythropoiesis.
Methods
Zebrafish husbandry
All zebrafish experiments were approved by the University of Mississippi Medical Center, Institutional Animal Care and Use Committee (IACUC number 2021-1161). AB wild-type, Tg(gata1:DsRed), and Tg(cd41:GFP) fish were from Zebrafish International Resource Center and maintained in E3 embryo medium at 28.5°C (14-hour light/10-hour dark).25,26
Omega-3 metabolite screen and 7,17-diHDPAn-3 exposure
A targeted screen of eicosapentaenoic acid (EPA), docosahexaenoic acid (DHA), and docosapentaenoic acid (DPA) metabolites (2.5 and 5 μM) identified 7,17-diHDPAn-3 as increasing cmyb expression and O-D staining. A dose-response analysis confirmed efficacy without toxicity. 7,17-diHDPAn-3 was dissolved in ethanol; vehicle controls received equivalent ethanol exposure.
Dexamethasone treatment
Dexamethasone (10-100 μM in methanol) was administered from 11 to 36 hours postfertilization (hpf); 75 μM was the highest nontoxic dose.
O-D staining and WISH
Imaging
Embryos in 80% glycerol were imaged using a Zeiss Axio Imager 2 with Axiocam 705 and processed in Photoshop (brightness/contrast only).
RT-qPCR
Reverse-transcription quantitative polymerase chain reaction (RT-qPCR) was performed using SYBR Green Master Mix, with messenger RNA levels normalized to 18S ribosomal RNA.
FACS
Single-cell dissociation experiments followed the Lawson laboratory’s protocol.29 DsRed+ cells from Tg(gata1:DsRed) embryos were sorted for metabolomic or RNA-sequencing (RNA-seq) analysis. DsRed+ (75 embryos per group; 11-36 hpf) and green fluorescent protein (GFP)–positive cells (40 embryos per group; 48-72 hpf) were quantified by flow cytometry. Fluorescence-activated cell sorting (FACS) was performed in biological triplicates.
RNA-seq analysis
Ultrahigh-performance liquid chromatography–mass spectrometry metabolomics analysis
Cells from 500 Tg(gata1:DsRed) embryos were extracted in MeOH:MeCN:H2O (5:3:2) and analyzed by ultrahigh-performance liquid chromatography–mass spectrometry (Vanquish + Orbitrap Exploris 120; Kinetex SB-C18). Data were processed with El-Maven and Kyoto Encyclopedia of Genes and Genomes.32,33 Biological triplicates were used.
Statistical analysis
Experiments used ≥3 biological replicates. Data are represented as mean ± standard error of the mean. Statistical analyses were performed using unpaired t tests (P < .05) in GraphPad and MetaboAnalyst.34
The detailed methods are provided in the supplemental Methods.
Results
Identification of novel modulators of HSC number
To identify novel modulators of HSC number and erythrocyte formation, we performed a small-scale screening of lipid mediators derived from omega-3 fatty acids (FAs). A targeted selected screen was performed using several EPA, DHA, and DPA metabolites. These SPMs have been previously studied for their roles in inflammation resolution and tissue regeneration, but their impact on hematopoiesis and erythropoiesis is largely unexplored.35-38 Our targeted screen identified 7,17-diHDPAn-3 as a promising compound for further investigation. Our dose-response experiments identified 1.5 μM as the optimal dose for 7,17-diHDPAn-3 in early zebrafish embryos (11-36 hpf).
7,17-diHDPAn-3 expands HSC number
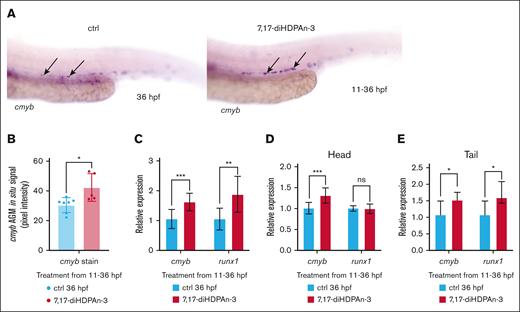
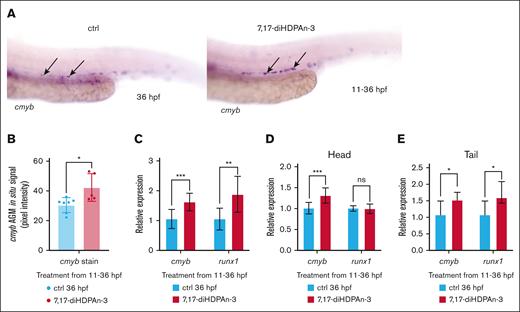
To investigate the role of 7,17-diHDPAn-3 in hematopoiesis, we first assessed its effect on HSC production using WISH with a cmyb RNA probe, which is a definitive HSC marker, at 36 hpf.39 As shown in Figure 1A, embryos exposed to 7,17-diHDPAn-3 exhibited a significant increase in the number of cmyb-positive cells in the ventral wall of the dorsal aorta at 36 hpf, the zebrafish equivalent of the mammalian aorta-gonad-mesonephros (AGM) region.40,41 Quantitative analysis of cmyb in situ signal intensity in the ventral wall of the dorsal aorta region, using Fiji software,42 confirmed a significant increase in treated embryos compared to controls (Figure 1B).
7,17-diHDPAn-3 promotes HSC formation. (A) WISH for cmyb, labeling definitive HSCs at 36 hpf, in controls and embryos treated with 7,17-diHDPAn-3 from 11 to 36 hpf (n = 9 embryos per group). Images were taken at original magnification ×10. (B) Quantification of WISH signal intensity using Fiji software showed a significant increase in cmyb expression in the treated group compared to controls (n = 5-7 embryos per group; unpaired Student t test). (C) RT-qPCR analysis showed relative expression of cmyb and runx1 in treated embryos vs controls from 11 to 36 hpf (n = 4 biological replicates per group; technical triplicates; 30 embryos per sample). (D) RT-qPCR of dissected heads revealed cmyb and runx1 expression after exposure from 11 to 36 hpf (n = 3 biological replicates; technical triplicates; 12 heads per sample). (E) RT-qPCR of dissected tails revealed cmyb and runx1 expression after exposure from 11 to 36 hpf (n = 3 biological replicates; technical triplicates; 12 tails per sample). Bar plots represent mean ± standard deviation (SD). Statistical comparisons between control and treated groups for each gene were performed using unpaired Student t tests. ∗P < .05; ∗∗P < .01; ∗∗∗P < .001. ctrl, control; ns, no significant difference.
7,17-diHDPAn-3 promotes HSC formation. (A) WISH for cmyb, labeling definitive HSCs at 36 hpf, in controls and embryos treated with 7,17-diHDPAn-3 from 11 to 36 hpf (n = 9 embryos per group). Images were taken at original magnification ×10. (B) Quantification of WISH signal intensity using Fiji software showed a significant increase in cmyb expression in the treated group compared to controls (n = 5-7 embryos per group; unpaired Student t test). (C) RT-qPCR analysis showed relative expression of cmyb and runx1 in treated embryos vs controls from 11 to 36 hpf (n = 4 biological replicates per group; technical triplicates; 30 embryos per sample). (D) RT-qPCR of dissected heads revealed cmyb and runx1 expression after exposure from 11 to 36 hpf (n = 3 biological replicates; technical triplicates; 12 heads per sample). (E) RT-qPCR of dissected tails revealed cmyb and runx1 expression after exposure from 11 to 36 hpf (n = 3 biological replicates; technical triplicates; 12 tails per sample). Bar plots represent mean ± standard deviation (SD). Statistical comparisons between control and treated groups for each gene were performed using unpaired Student t tests. ∗P < .05; ∗∗P < .01; ∗∗∗P < .001. ctrl, control; ns, no significant difference.
Next, we measured the expression of 2 key HSC markers, cmyb and runx1,41,43 using RT-qPCR. Compared to controls, embryos exposed to 7,17-diHDPAn-3 showed an 83.4% increase in cmyb expression and a 78.1% increase in runx1 expression (Figure 1C), confirming that 7,17-diHDPAn-3 promotes HSC expansion in vivo. To determine whether this increased expression was localized to the trunk/tail region, where HSCs predominantly reside at 36 hpf, we performed RT-qPCR on dissected head and tail regions. Although we detect a slight increase of cmyb in the head under 7,17-diHDPAn-3 (31%, Figure 1D), we observe a stronger increase of both cmyb and runx1 in the trunk/tail region (50% and 53%, respectively), which contains the AGM44 (Figure 1E). These results suggest that the upregulation of HSC markers after 7,17-diHDPAn-3 exposure primarily occurs in the trunk region, consistent with the localization of definitive HSCs.
7,17-diHDPAn-3 increases erythroid progenitor production
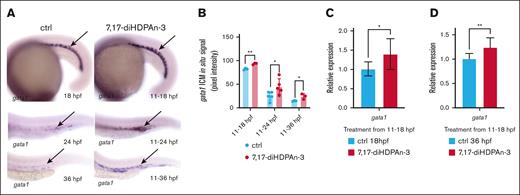
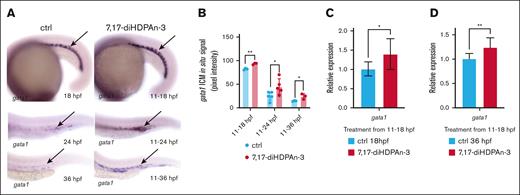
During the production of RBCs, HSCs develop into erythroid precursor cells before becoming mature RBCs. Therefore, we investigated whether the increase in HSC numbers we observed under 7,17-diHDPAn-3 treatment results in increased erythroid progenitor cell production.9 We performed WISH to study gata1 expression (an erythroid precursor marker) in embryos exposed to 7,17-diHDPAn-3 from 11 hpf onward and fixed at 18, 24, and 36 hpf (Figure 2A).45-47 We observed increased gata1 expression in the treated groups at all time points, suggesting enhanced erythroid progenitor production. Quantitative analysis of in situ signal using Fiji software confirmed a significant increase in gata1 expression in the treated embryos compared to controls (Figure 2B; unpaired Student t test). This finding was further supported by RT-qPCR (Figures 2C-D), which showed a 36% increase in gata1 expression during the 11 to 18 hpf window and a 21% increase during the 11 to 36 hpf window. Together, these results indicate that 7,17-diHDPAn-3 enhances early erythroid progenitor production, potentially promoting erythropoiesis.
7,17-diHDPAn-3 increases erythroid progenitor production. (A) WISH for gata1, labeling erythroid progenitors at 18, 24, and 36 hpf, in embryos treated with 7,17-diHDPAn-3 from 11 hpf, vs controls (n = 9 embryos per group per time point). Images were taken at ×5 magnification (18-hpf embryos) and original magnification ×10 (24-hpf and 36-hpf embryos). (B) Quantification of WISH signal intensity using Fiji software showed a significant increase in gata1 expression in treated embryos at all time points compared to controls (n = 5-7 embryos per group; unpaired Student t test). (C-D) RT-qPCR analysis showed relative expression of gata1 in embryos treated from 11 to 18 hpf (C) and from 11 to 36 hpf (D) vs controls (n = 4 biological replicates per group; technical triplicates; 30 embryos per sample). Bar plots represent mean ± SD. Statistical comparisons between the control and treated groups for each gene were performed using unpaired Student t tests. ∗P < .05; ∗∗P < .01. ctrl, control.
7,17-diHDPAn-3 increases erythroid progenitor production. (A) WISH for gata1, labeling erythroid progenitors at 18, 24, and 36 hpf, in embryos treated with 7,17-diHDPAn-3 from 11 hpf, vs controls (n = 9 embryos per group per time point). Images were taken at ×5 magnification (18-hpf embryos) and original magnification ×10 (24-hpf and 36-hpf embryos). (B) Quantification of WISH signal intensity using Fiji software showed a significant increase in gata1 expression in treated embryos at all time points compared to controls (n = 5-7 embryos per group; unpaired Student t test). (C-D) RT-qPCR analysis showed relative expression of gata1 in embryos treated from 11 to 18 hpf (C) and from 11 to 36 hpf (D) vs controls (n = 4 biological replicates per group; technical triplicates; 30 embryos per sample). Bar plots represent mean ± SD. Statistical comparisons between the control and treated groups for each gene were performed using unpaired Student t tests. ∗P < .05; ∗∗P < .01. ctrl, control.
7,17-diHDPAn-3 increases erythrocyte production
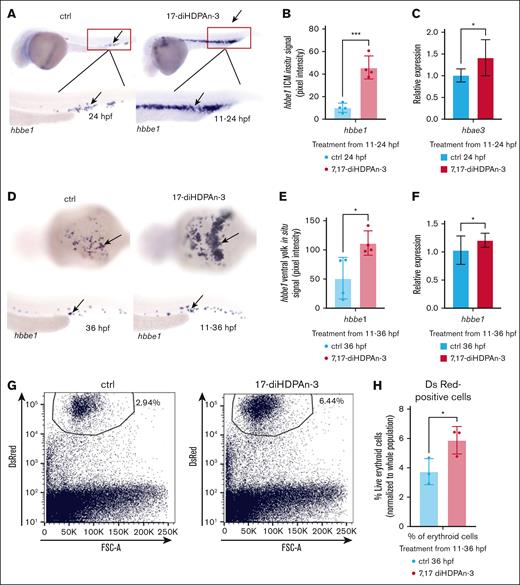
We further investigated the effects of 7,17-diHDPAn-3 on erythropoiesis by examining the expression of hemoglobin beta embryonic-1 (hbbe1), a marker of terminal erythroid differentiation.48 WISH analysis at 24 (Figure 3A) and 36 hpf (Figure 3D) during the primitive wave of erythropoiesis revealed increased hbbe1 expression in treated embryos. Quantification of in situ signal confirmed elevated hbbe1-positive cells in the intermediate cell mass at 24 hpf (Figure 3B) and in the ventral yolk sac at 36 hpf (Figure 3E). RT-qPCR analysis further supported these findings, showing a 38.5% increase in hbae3 expression at 24 hpf (Figure 3C) and a 21% increase in hbbe1 expression at 36 hpf (Figure 3F). O-D staining revealed an increase in Hb content in intact erythrocytes of treated embryos between 11 and 36 hpf (supplemental Figure 1). In parallel, FACS analysis of Tg(gata1:DsRed) embryos (supplemental Figure 2) demonstrated an increase in erythroid cell number after 7,17-diHDPAn-3 exposure: gata1-positive cells represented 2.94% of total cell number in controls, whereas they represented 6.44% in 7,17-diHDPAn-3–exposed embryos (Figure 3G). Unpaired Student t test analysis of the percentage of erythroid cells (normalized to total live single cells) based on FACS results confirmed a significant ∼52% increase in the treated group compared to controls (Figure 3H).
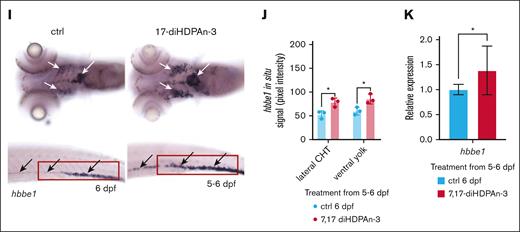
In zebrafish, primitive erythropoiesis occurs between 11 and 24 hpf, whereas definitive erythropoiesis begins after 24 hpf.49,50 However, cells derived from definitive HSCs do not contribute to circulation until 10 days postfertilization (dpf).51 During the 5 to 10 dpf window, circulating erythrocytes are thought to originate primarily from erythro-myeloid progenitors.52 To examine later erythroid development, we performed WISH for hbbe1 after 5 to 6 dpf exposure (Figure 3I). Treated embryos showed an increased number of hbbe1-positive cells in the ventral head (white arrows) and caudal hematopoietic tissue (CHT; supplemental Figure 3). Although hbbe1 marks terminally differentiating erythrocytes, the presence of hbbe1-positive cells in the CHT, distinct from circulating cells, suggests they may represent definitive erythroid progenitors localized within the hematopoietic niche. Quantification of hbbe1 WISH signal in both the ventral head and CHT (Figure 3J) showed significantly higher signal intensity in the treated group. RT-qPCR at 6 dpf also confirmed increased hbbe1 expression in response to 7,17-diHDPAn-3 exposure. Because cells derived from definitive HSCs do not circulate before 10 dpf, we performed RT-qPCR for hbbe2 and hbae5 after treatment between 12 and 14 dpf. These genes are established markers of definitive HSC-derived erythrocytes. Both showed significantly increased expression in treated embryos (supplemental Figure 3), supporting a role for 7,17-diHDPAn-3 in enhancing definitive erythropoiesis. Collectively, these results demonstrate that 7,17-diHDPAn-3 enhances both primitive and definitive erythrocyte production in vivo.
7,17-diHDPAn-3 enhances erythropoiesis without affecting thrombocyte formation
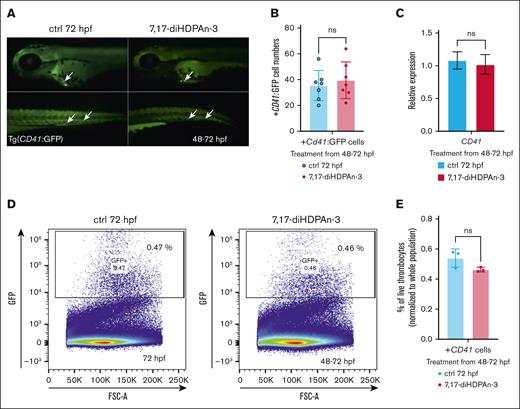
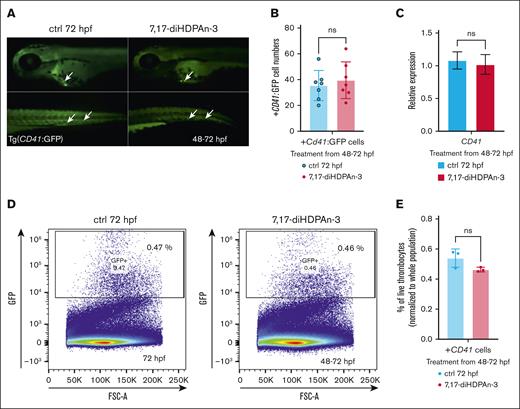
Erythroid cells and thrombocytes (platelets) share a common progenitor, the megakaryocyte-erythroid progenitor (MEP), which can differentiate into both erythrocytes and thrombocytes.53 It is important to ensure that the increase in erythroid cell production does not come at the expense of the common MEP population, because this could potentially affect thrombocyte formation as well. However, due to the lack of well-established markers to directly isolate and quantify MEPs in zebrafish embryos, we instead measured downstream cell populations. To assess the impact of 7,17-diHDPAn-3 on thrombocyte formation, we used the transgenic zebrafish line Tg(CD41:GFP), which expresses GFP under the CD41 promoter, allowing visualization and quantification of thrombocytes.26,54 Fluorescent imaging of these transgenic zebrafish during the 48 to 72 hpf treatment period (Figure 4A) showed no significant difference in the number of GFP-positive thrombocytes between the treated and control groups. Manual counting of CD41+ cells (Figure 4B) also revealed no significant difference between the 2 groups (n = 7), confirmed by Student t test. Moreover, RT-qPCR analysis of cd41 gene expression during the 48 to 72 hpf exposure period (Figure 4C) further supported these findings, showing no significant change between the 2 conditions. Similarly, FACS analysis of CD41+ cells (n = 3; with 40 embryos per group) showed no significant difference in thrombocyte cell number between the treated and control groups (Figure 4D). Figure 4E shows the results of an unpaired Student t test analysis of the percentage of high GFP-positive cells (thrombocytes), normalized to the total single live cell population, also showing no significant difference between the treated and control groups. Overall, these results suggest that 7,17-diHDPAn-3 promotes erythropoiesis without affecting thrombocyte formation, indicating that MEP production is preserved.
7,17-diHDPAn-3 enhances erythropoiesis without affecting thrombocyte formation. (A) Fluorescent imaging of Tg(CD41:GFP) embryos treated with 7,17-diHDPAn-3 from 48 to 72 hpf showed no significant difference in the number of GFP-positive thrombocytes compared to controls (n = 7 embryos per group). Images were taken at 10× magnification. (B) Manual counting of CD41+ cells in treated vs control embryos confirmed no significant difference between the groups (n = 7 embryos per group; unpaired Student t test). (C) RT-qPCR analysis of cd41 expression after treatment from 48 to 72 hpf revealed no significant difference between treated and control groups (n = 3 biological replicates per group; technical triplicates; 30 embryos per sample). (D) FACS analysis of CD41+ cells (marking the thrombocytes) in embryos exposed to 7,17-diHDPAn-3 from 48 to 72 hpf showed no significant change in thrombocyte cell number (n = 3 biological replicates per group; 40 embryos per sample). (E) Quantification of high GFP-positive cells as a percentage of total live single cells confirmed no significant difference between the groups (n = 3 biological replicates per group; unpaired Student t test). Bar plots represent mean ± SD. Statistical comparisons were performed using unpaired Student t tests. ctrl, control; FSC-A, forward scatter A; ns, no significant difference.
7,17-diHDPAn-3 enhances erythropoiesis without affecting thrombocyte formation. (A) Fluorescent imaging of Tg(CD41:GFP) embryos treated with 7,17-diHDPAn-3 from 48 to 72 hpf showed no significant difference in the number of GFP-positive thrombocytes compared to controls (n = 7 embryos per group). Images were taken at 10× magnification. (B) Manual counting of CD41+ cells in treated vs control embryos confirmed no significant difference between the groups (n = 7 embryos per group; unpaired Student t test). (C) RT-qPCR analysis of cd41 expression after treatment from 48 to 72 hpf revealed no significant difference between treated and control groups (n = 3 biological replicates per group; technical triplicates; 30 embryos per sample). (D) FACS analysis of CD41+ cells (marking the thrombocytes) in embryos exposed to 7,17-diHDPAn-3 from 48 to 72 hpf showed no significant change in thrombocyte cell number (n = 3 biological replicates per group; 40 embryos per sample). (E) Quantification of high GFP-positive cells as a percentage of total live single cells confirmed no significant difference between the groups (n = 3 biological replicates per group; unpaired Student t test). Bar plots represent mean ± SD. Statistical comparisons were performed using unpaired Student t tests. ctrl, control; FSC-A, forward scatter A; ns, no significant difference.
7,17-diHDPAn-3 slightly alters erythroid cell metabolism
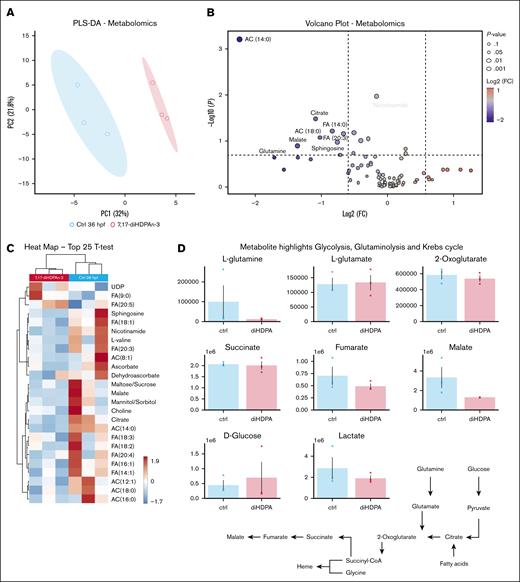
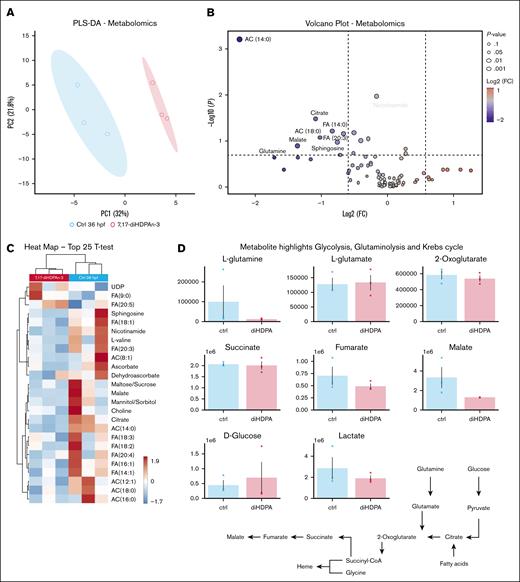
To analyze the metabolic panel of erythroid progenitors and erythrocytes from embryos treated with 7,17 diHDPA-n3 (11-36 hpf), we conducted a metabolomic analysis on erythroid cells. Using the transgenic zebrafish line Tg(gata1:DsRed), which labels erythroid progenitors and erythrocytes in DsRed,25,55 we sorted the erythroid cell population as shown in supplemental Figure 2. To confirm selective sorting of gata1:Dsred-positive cells, we conducted RT-qPCR to quantify gata1 expression in DsRed-positive– and DsRed-negative–sorted cells. This demonstrated a strong selection of gata1+ cells in the DsRed-positive–sorted cells (supplemental Figure 2B). Metabolomic analysis of DsRed-positive–sorted cells, conducted in biological triplicate with 500 000 erythroid cells per sample (obtained from 500 embryos per sample), showed that there were differences between the control and treated groups, as determined by partial least square-discriminant analysis (Figure 5A). Metabolites with the highest loading weights across principal component 1 included carboxylic acids (citrate and malate), acyl-carnitines (ACs; 14:0 and 18:0), and free FAs (14:0 and 20:3), all decreasing in the treated group, as shown by the volcano plot in Figure 5B. Lower glutamine levels were observed in the treated group, despite this observation not reaching significance (P = .052). We observed a 10.9% (P = .011) reduction in nicotinamide levels in the 7,17-diHDPAn-3–treated group. Additionally, the metabolite profile, summarized in the heat map in Figure 5C for the top 25 metabolites based on fold changes and P values (adjusting the threshold to a looser P value <.1 to expand metabolite visualization in this specific analysis), indicates that citrate and AC (14:0) levels were decreased by 57.7% (P = .033) and 77.7% (P = .001), respectively, in the treated group. Although the difference did not reach significance, it is worth noting that glucose levels were higher in the treated group, suggestive of either increased influx or decreased consumption, the latter being the most logical explanation given the significantly lower levels of glycolytic intermediates and lactate in this group (Figure 5D). These metabolic changes suggest some impact on the quality of the generated erythroid cells, although the overall profile indicates the cells remain generally acceptable for potential clinical applications, without significantly compromising their function or viability.
7,17-diHDPAn-3 slightly changes the metabolism of the erythroid progenitor. (A) Partial least square-discriminant analysis shows clustering between controls at 36 hpf and 7,17-diHDPAn-3 treatment. (B) Volcano plots indicate log2 fold change (x-axis) and –log10 of related P values, highlighting significant AC (14:0), nicotinamide, and citrate decreases in the 7,17-diHDPAn-3–treated group. (C) Heat map of the top 25 most significant metabolites (t test) reveals differences (primarily decreases) in carboxylic acid metabolism, free FAs, and ACs after 7,17-diHDPAn-3 treatment. (D) Highlights of metabolic differences between controls at 36 hpf and 7,17-diHDPAn-3 treatment in glycolysis, glutaminolysis, and the Krebs cycle. Global metabolomics analysis shows different metabolic patterns (primarily in carboxylic acid, free FA, and AC metabolism) between controls at 36 hpf and 7,17-diHDPAn-3 treatment. CoA, coenzyme A; ctrl, control; FC, fold change; PC1, principal component 1; PLS-DA, partial least square-discriminant analysis.
7,17-diHDPAn-3 slightly changes the metabolism of the erythroid progenitor. (A) Partial least square-discriminant analysis shows clustering between controls at 36 hpf and 7,17-diHDPAn-3 treatment. (B) Volcano plots indicate log2 fold change (x-axis) and –log10 of related P values, highlighting significant AC (14:0), nicotinamide, and citrate decreases in the 7,17-diHDPAn-3–treated group. (C) Heat map of the top 25 most significant metabolites (t test) reveals differences (primarily decreases) in carboxylic acid metabolism, free FAs, and ACs after 7,17-diHDPAn-3 treatment. (D) Highlights of metabolic differences between controls at 36 hpf and 7,17-diHDPAn-3 treatment in glycolysis, glutaminolysis, and the Krebs cycle. Global metabolomics analysis shows different metabolic patterns (primarily in carboxylic acid, free FA, and AC metabolism) between controls at 36 hpf and 7,17-diHDPAn-3 treatment. CoA, coenzyme A; ctrl, control; FC, fold change; PC1, principal component 1; PLS-DA, partial least square-discriminant analysis.
7,17-diHDPAn-3 regulates the expression of genes implicated in heme synthesis and erythrocyte differentiation
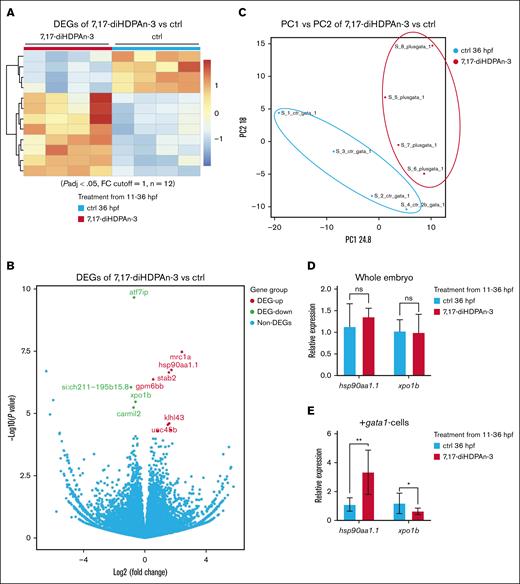
To investigate how 7,17-diHDPAn-3 regulates gene expression during erythropoiesis, we performed bulk RNA-seq on erythroid cells isolated from Tg(gata1:DsRed) zebrafish embryos. gata1:DsRed-positive cells were sorted from control or 7,17-diHDPAn-3–treated embryos (11-36 hpf; supplemental Figure 2). The RNA-seq analysis was conducted in a biological quadruplicate, with each sample containing 200 000 erythroid cells obtained from 200 embryos. This analysis (Figure 6A-B) revealed that the expression of 8 genes was upregulated, including fumarate hydratase (Fh), kelch-like family member 43 (Klhl43), heat shock protein 90, alpha (cytosolic), class A member 1, tandem duplicate 1 (Hsp90aa1.1), stabilin 2 (Stab2), kelch-like family member 41b (Klhk41b), mannose receptor, C type 1a (Mrc1a), unc-45 myosin chaperone B (Unc45b), and glycoprotein M6Bb (Gpm6bb), whereas the expression of 4 genes was downregulated, including exportin-1 (xpo1b), capping protein regulator and myosin 1 linker 2 (carmil2), activating transcript factor 7–interacting protein (atf7ip), and si:ch211-195b15.8 in the exposed group, compared to controls.
RNA-seq of erythroid gene expression after 7,17-diHDPAn-3 treatment. (A) Heat map showing the expression profiles of 12 differentially expressed genes (P adj < .05; |log2 fold change| ≥ 1) in FACS-sorted GATA1-positive erythroid cells from control and 7,17-diHDPAn-3–treated zebrafish embryos. RNA-seq was performed using 4 biological replicates per group, with 200 000 sorted cells per sample. (B) Volcano plot highlighting significantly upregulated (fh, klhl43, hsp90aa1.1, stab2, klhk41b, mrc1a, unc45b, and gpm6bb in red) and downregulated (xpo1b, carmil2, atf7ip, and si:ch211-195b15.8 in green) genes in treated samples vs controls. (C) Principal component analysis demonstrating clear segregation between control and treated erythroid cell populations: the control cell population (red ellipse) and the 7,17-diHDPAn-3 cell population (blue ellipse). Each dot represents 1 biological RNA-seq replicate (n = 4 per group). (D) RT-qPCR analysis of hsp90aa1.1 and xpo1b expression using RNA extracted from whole embryos (biological triplicates with technical triplicates; 30 embryos per sample). (E) RT-qPCR analysis using RNA from FACS-isolated erythroid cells (40 000-50 000 cells pooled from 40 Tg(gata1:DsRed) embryos per sample). RT-qPCR was performed using three biological replicates, each with technical triplicates. Data are presented as mean ± SD. Statistical significance was determined using unpaired 2-tailed Student t tests. ∗P < .05; ∗∗P < .001. ctrl, control; DEG, differentially expressed genes; FC, fold change; ns, no significant difference; PC1, principal component 1.
RNA-seq of erythroid gene expression after 7,17-diHDPAn-3 treatment. (A) Heat map showing the expression profiles of 12 differentially expressed genes (P adj < .05; |log2 fold change| ≥ 1) in FACS-sorted GATA1-positive erythroid cells from control and 7,17-diHDPAn-3–treated zebrafish embryos. RNA-seq was performed using 4 biological replicates per group, with 200 000 sorted cells per sample. (B) Volcano plot highlighting significantly upregulated (fh, klhl43, hsp90aa1.1, stab2, klhk41b, mrc1a, unc45b, and gpm6bb in red) and downregulated (xpo1b, carmil2, atf7ip, and si:ch211-195b15.8 in green) genes in treated samples vs controls. (C) Principal component analysis demonstrating clear segregation between control and treated erythroid cell populations: the control cell population (red ellipse) and the 7,17-diHDPAn-3 cell population (blue ellipse). Each dot represents 1 biological RNA-seq replicate (n = 4 per group). (D) RT-qPCR analysis of hsp90aa1.1 and xpo1b expression using RNA extracted from whole embryos (biological triplicates with technical triplicates; 30 embryos per sample). (E) RT-qPCR analysis using RNA from FACS-isolated erythroid cells (40 000-50 000 cells pooled from 40 Tg(gata1:DsRed) embryos per sample). RT-qPCR was performed using three biological replicates, each with technical triplicates. Data are presented as mean ± SD. Statistical significance was determined using unpaired 2-tailed Student t tests. ∗P < .05; ∗∗P < .001. ctrl, control; DEG, differentially expressed genes; FC, fold change; ns, no significant difference; PC1, principal component 1.
Among the 12 differentially expressed genes, 2 important ones were xpo1b and hsp90aa1.1, which are involved in erythrocyte maturation and heme synthesis, respectively.56,57 Principal component analysis showed a clear separation between the treated and control groups, indicating distinct transcriptional profiles (Figure 6C). To validate these findings, we performed RT-qPCR (Figure 6D, E). Although no significant changes in hsp90aa1.1 or xpo1b expression were detected using RNA from whole embryos (Figure 6D), analysis of sorted erythroid cells revealed an ∼40% reduction in xpo1b expression and an approximately threefold increase in hsp90aa1.1 expression in the treated group (Figure 6E). These results suggest that 7,17-diHDPAn-3 selectively modulates gene expression within the erythroid lineage rather than exerting broad effects across the entire embryo. Hsp90aa1.1 encodes a chaperone involved in heme insertion into Hb subunits, whereas xpo1b encodes exportin-1, a nuclear export protein whose inhibition has been shown to promote erythropoiesis by retaining HSP70 in the nucleus, thereby protecting GATA1 from caspase-mediated cleavage. Taken together, these findings suggest that 7,17-diHDPAn-3 may enhance erythroid maturation, at least in part, by modulating the expression of genes involved in Hb synthesis and erythroid transcriptional regulation.
7. 7,17-diHDPAn-3 modulates inflammatory signaling and promotes HSC formation
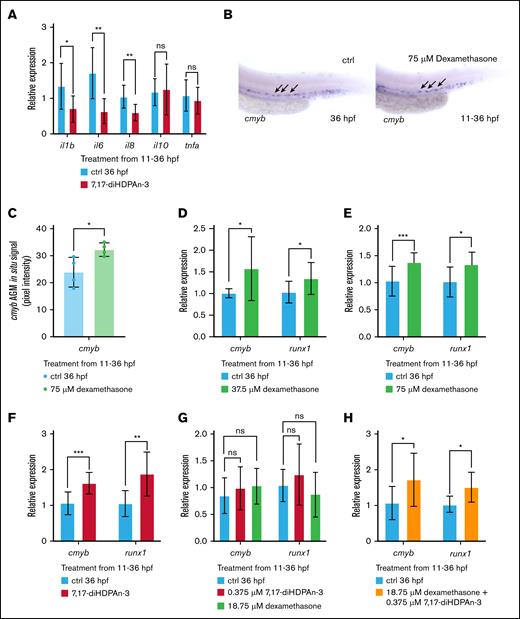
7,17-diHDPAn-3 is reported to have anti-inflammatory properties.58-61 Inflammation plays a crucial role in regulating hematopoiesis, and inflammatory conditions can impair erythropoiesis.62 To confirm the role of 7,17-diHDPAn-3 in the resolution of inflammation, we exposed AB embryos to 1.5 μM of 7,17-diHDPAn-3 and measured the expression of genes implicated in inflammation. As shown in Figure 7A, 7,17-diHDPAn-3 exposure reduced the expression of the proinflammatory genes interleukin-1β (IL-1β), IL-6, and IL-8 but did not alter the expression of the proinflammatory tumor necrosis factor α or the anti-inflammatory cytokine gene IL-10.63 These findings indicate that 7,17-diHDPAn-3 exerts anti-inflammatory effects in vivo in zebrafish.
7,17-diHDPAn-3 modulates inflammatory signaling and promotes HSC formation. (A) RT-qPCR analysis of inflammatory cytokine genes (il1b, il6, il8, tnfa, and il10). (B) WISH analysis of cmyb expression at 36 hpf in zebrafish embryos treated with 75 μM dexamethasone (11-36 hpf), compared to controls. Representative images shown at 10× magnification (n = 9 embryos per group). (C) Quantification of cmyb WISH signal in the AGM using Fiji software confirms a significant increase in dexamethasone-treated embryos (n = 4 biological replicates). (D-E) RT-qPCR analysis of cmyb and runx1 expression across a dexamethasone dose-response series: 37.5 μM (D) and 75 μM (E). (F) RT-qPCR quantification of cmyb and runx1 expression after 7,17-diHDPAn-3 treatment. (G) RT-qPCR analysis of embryos treated with subthreshold concentrations of 18.75 μM dexamethasone or 0.375 μM 7,17-diHDPAn-3 individually shows no significant increase in cmyb or runx1 expression. (H) Combined treatment with 18.75 μM dexamethasone and 0.375 μM 7,17-diHDPAn-3 increases cmyb and runx1 expression, indicating a potential cooperative effect. RT-qPCR was performed using 3 biological replicates with technical triplicates; 30 embryos per biological replicate. Data are presented as mean ± SD. Statistical analysis was performed using an unpaired Student t test. ∗P < .05; ∗∗P < .01; ∗∗∗P < .001. ctrl, control; ns, no significant difference.
7,17-diHDPAn-3 modulates inflammatory signaling and promotes HSC formation. (A) RT-qPCR analysis of inflammatory cytokine genes (il1b, il6, il8, tnfa, and il10). (B) WISH analysis of cmyb expression at 36 hpf in zebrafish embryos treated with 75 μM dexamethasone (11-36 hpf), compared to controls. Representative images shown at 10× magnification (n = 9 embryos per group). (C) Quantification of cmyb WISH signal in the AGM using Fiji software confirms a significant increase in dexamethasone-treated embryos (n = 4 biological replicates). (D-E) RT-qPCR analysis of cmyb and runx1 expression across a dexamethasone dose-response series: 37.5 μM (D) and 75 μM (E). (F) RT-qPCR quantification of cmyb and runx1 expression after 7,17-diHDPAn-3 treatment. (G) RT-qPCR analysis of embryos treated with subthreshold concentrations of 18.75 μM dexamethasone or 0.375 μM 7,17-diHDPAn-3 individually shows no significant increase in cmyb or runx1 expression. (H) Combined treatment with 18.75 μM dexamethasone and 0.375 μM 7,17-diHDPAn-3 increases cmyb and runx1 expression, indicating a potential cooperative effect. RT-qPCR was performed using 3 biological replicates with technical triplicates; 30 embryos per biological replicate. Data are presented as mean ± SD. Statistical analysis was performed using an unpaired Student t test. ∗P < .05; ∗∗P < .01; ∗∗∗P < .001. ctrl, control; ns, no significant difference.
To explore the relationship between inflammation resolution and HSC production, we used dexamethasone, a potent anti-inflammatory glucocorticoid.64 Through a dose-response study, we identified 75 μM of dexamethasone as the optimal dose, which effectively increased HSC formation without observable toxicity. WISH analysis of cmyb expression in zebrafish embryos exposed to 75 μM dexamethasone (11-36 hpf) revealed a significantly greater number of cmyb-positive HSCs in the AGM region than in controls (Figure 7B). Quantification of WISH signal also confirmed a significant increase in cmyb expression in the AGM region (Figure 7C). Subsequently, we investigated this relationship using 2 dexamethasone dose-response experiments. RT-qPCR analysis demonstrates that dexamethasone increases HSC formation in a dose-dependent manner, with higher doses of dexamethasone leading to a higher increase in the expression of both cmyb and runx1 (Figure 7D-E). However, 7,17-diHDPAn-3 treatment (Figure 7F) induced a greater upregulation of cmyb and runx1 expression than dexamethasone (Figure 7C-D). To assess whether the reduction in inflammatory cytokines could be due to altered myeloid cell numbers, we assessed the expression of myeloid cell markers after treatment with 75 μM dexamethasone (11-36 hpf). RT-qPCR analysis at 36 hpf showed no significant differences in the expression of lysozyme C (lyz), a granulocyte marker, or macrophage expressed gene 1 (mpeg1), a macrophage marker, compared to control embryos (supplemental Figure 4). These findings suggest that dexamethasone does not alter myeloid cell abundance under our treatment conditions. This supports the interpretation that the observed decrease in proinflammatory cytokine expression is due to suppressed inflammatory signaling rather than a reduction in myeloid cell numbers. To determine the combined effects of 7,17-diHDPAn-3 and dexamethasone on HSC formation, we exposed zebrafish embryos to varying concentrations of the 2 compounds and performed RT-qPCR for cmyb and runx1. We identified 18.75 μM dexamethasone and 0.375 μM 7,17-diHDPAn-3 as subthreshold concentrations that do not individually increase cmyb or runx1 expression (Figure 7G). However, when these compounds are used in combination at these concentrations, 18.75 μM dexamethasone and 0.375 μM 7,17-diHDPAn-3, we detect a 54.5% increase in cmyb expression and a 40% increase in runx1 expression (Figure 7H). Although this observation suggests that the 2 compounds may have a cooperative effect on HSC-related gene expression, it is based solely on transcriptional outcomes and does not confirm a shared mechanism of action. Further studies will be required to determine whether their effects converge mechanistically to regulate HSC formation.
Discussion
7,17-diHDPAn-3 is an understudied SPM. Other related SPMs derived from omega-3 FAs, such as EPA- or DHA-derived SPMs, have been more extensively investigated.35,36,65,66 Previous research has demonstrated that 7,17-diHDPAn-3 can effectively mediate inflammation resolution in animal models of arthritis.67 This compound was shown to attenuate inflammatory processes by activating the G protein–coupled receptor GPR101, thereby promoting the resolution of inflammation and restoring homeostasis in the arthritic condition.67,68 Additionally, 7,17-diHDPAn-3 was found to exert its anti-inflammatory effects by reducing the production of proinflammatory cytokines, decreasing the migration and activation of immune cells, and enhancing the clearance of cellular debris and apoptotic cells at the site of inflammation.61,69-71 Building on this foundational understanding, our study aims to explore the potential of 7,17-diHDPAn-3 in the context of erythropoiesis. Enhancing erythropoiesis holds significant therapeutic implications for blood-related disorders.
Erythroid cells transcriptomic result reveals that 7,17-diHDPAn-3 reduces the expression of exportin-1 (xpo1b) compared to controls. Previous research has demonstrated that the inhibition of the exportin protein, a key regulator of nucleocytoplasmic transport, can effectively promote the production and maturation of RBCs and alleviate anemic symptoms in animal models of β-thalassemia, a genetic disorder characterized by defective Hb synthesis.72 Heat shock protein 70 (HSP70) regulates erythropoiesis by preventing caspase-3 from cleaving the gata1 transcriptional factor in the nucleus.73 Moreover, HSP70 export from the nucleus is an XPO1-dependent mechanism in human erythroid progenitor cells.72 Hence, blocking exportin-1 activity inhibits HSP70 export from the nucleus, where it protects the gata1 transcription factor from degradation, thereby increasing erythropoiesis.73
Additionally, our findings indicate that 7,17-diHDPAn-3 can increase by 3.3-fold the expression of the heat shock protein gene hsp901.1a. This heat shock protein chaperones heme insertion into Hb β and Hb γ, as well as into Hb α in some cases, playing an essential role in fetal (α2γ2) or adult (α2β2) Hb tetramers in erythroid cells.74 By increasing hsp901.1a expression, 7,17-diHDPAn-3 can enhance the overall process of heme synthesis, boosting the maturation of RBCs.75 Moreover, the upregulation of hsp901.1a by 7,17-diHDPAn-3 may also help improve Hb stability, subsequently enhancing the functionality of RBCs.74
Our findings also suggest that 7,17-diHDPAn-3 may support erythropoiesis by modulating erythroid cell metabolism. Metabolomic analysis of erythroid cells revealed modest but consistent reductions in tricarboxylic acid cycle intermediates (eg, citrate and malate), free FAs, and ACs, metabolites associated with mitochondrial respiration and β-oxidation. These patterns suggest suppression of mitochondrial metabolism and a possible metabolic shift toward glycolysis, which is characteristic of erythroid maturation. Although only 3 metabolites, including nicotinamide, citrate, and AC (14:0), reached statistical significance, the broader trend across the top 25 differentially detected metabolites is biologically meaningful, especially given that zebrafish erythrocytes retain functional mitochondria. This contrasts with mammalian RBCs and allows us to detect metabolic reprogramming in precursor cells. These metabolic changes are supported by transcriptomic data, including upregulation of hsp90aa1.1, which facilitates heme insertion into Hb, and downregulation of xpo1b, which may retain HSP70 in the nucleus to protect GATA1 from cleavage during erythroid differentiation. Although functional assays were not performed, these coordinated shifts in metabolism and gene expression are consistent with reduced inflammation and enhanced erythroid output under 7,17-diHDPAn-3 treatment. This metabolic environment may favor erythroid lineage commitment, particularly in the context of suppressed inflammatory signaling. Although these findings highlight the potential of 7,17-diHDPAn-3 in promoting HSC formation and enhancing erythropoiesis, this study has limitations. Our in vivo experiments provide a foundation for understanding the mechanisms underlying the effects of 7,17-diHDPAn-3, but further validation in relevant disease models mimicking anemia and other blood-related disorders is necessary to elucidate its therapeutic potential fully. Additionally, a more detailed investigation is required into the specific molecular pathways and signaling cascades through which 7,17-diHDPAn-3 exerts its effects on HSCs and erythropoiesis. Exploring the signaling pathways, transcriptional regulators, and epigenetic modifications involved in these processes will provide a more comprehensive understanding of the underlying biological mechanisms. Additionally, the translation of these findings to human clinical applications remains to be explored. Further research is necessary to elucidate the precise mechanisms by which 7,17-diHDPAn-3 exerts its effects and investigate the long-term safety, efficacy, and potential side effects of this SPM in various hematological disorders. Specifically, clinical trials in human patients will be crucial to determine the feasibility and effectiveness of 7,17-diHDPAn-3 as a therapeutic option for conditions such as β-thalassemia anemia and other blood disorders. Comprehensive studies are needed to fully understand the long-term implications and potential risks associated with using this novel SPM mediator.
Finally, on top of our erythropoiesis findings, our data also suggest that 7,17-diHDPAn-3 can directly enhance the expansion of HSCs. Our dexamethasone study demonstrates that the positive effect of 7,17-diHDPAn-3 on HSC amplification is likely mediated through its potent anti-inflammatory and proresolving properties. Traditionally, an inflammatory environment has been shown to favor the HSC niche, as demonstrated by the study on prostaglandin E2 and stem cell homeostasis.21,22 Recent work by Campbell et al has shown that NF-κB activity during zebrafish development is highly dynamic, with distinct waves that coincide with key hematopoietic events.76 These data suggest that controlled fluctuations in inflammatory signaling may be important for proper HSC development.76 In our study, embryos were treated with dexamethasone from 11 to 36 hpf, a window that overlaps with both the rise and resolution phases of the first NF-κB wave. Although we did not measure NF-κB activity, the suppression of inflammatory cytokine gene expression after dexamethasone treatment suggests that low-level modulation of inflammation during this critical window may support HSC formation. This interpretation remains cautious, because we did not observe changes in myeloid cell abundance and cannot confirm a direct mechanistic link. Nonetheless, our findings support the idea that proresolving interventions such as dexamethasone or 7,17-diHDPAn-3 may act by shaping the inflammatory environment during a developmentally sensitive period to promote HSC emergence. This contrasts with the prevailing notion that a persistent inflammatory milieu is necessary for optimal proliferation and self-renewal of HSCs.77
Acknowledgments
The authors thank Goldie Faircloth at the UMMC zebrafish facility for providing excellent husbandry care. They also thank the Yale Center for Genomics Analysis (New Haven, CT) for help with RNA-sequencing analysis and Michael R. Garrett (the chair of the Department of Cell and Molecular Biology at the University of Mississippi).
K.U.C.N. is supported by a National Heart, Lung, and Blood Institute (NHLBI), National Institutes of Health award F31HL170707. A.D. is supported by funds from the NHLBI (R01HL146442, R01HL149714, and R01HL14815). E.B.T. is supported by NHLBI R00 HL146888 and U54HL169191 grants. This project was supported by the University of Mississippi Medical Center Cardiorenal and Metabolic Diseases Research Center (National Institute of General Medical Sciences P20GM104357 and P30GM149404). Y.G. is supported by a National Institute of General Medical Sciences, National Institutes of Health grant (P20 GM104357) and by a Center of Biomedical Research Excellence/Mississippi Center of Excellence in Perinatal Research, National Institute of General Medical Sciences, National Institutes of Health grant (P20GM121334).
Authorship
Contribution: Y.G. supervised the project; K.U.C.N. and Y.G. designed experiments; A.D., E.B.T., and Y.G. provided project resources; K.U.C.N., C.K.C., D.S., A.D., L.D.M., E.B.T., and Y.G. performed experiments; K.U.C.N., A.D., J.D.M., and Y.G. analyzed the data sets; K.U.C.N. and Y.G. wrote the original manuscript draft; A.D., E.B.T., J.D.M., and Y.G. critically revised the manuscript; and all authors read and approved the final manuscript.
Conflict-of-interest disclosure: The authors declare no competing financial interests.
The current affiliation for Y.G. is Department of Medical and Molecular Genetics, Indiana University School of Medicine, Indianapolis, IN.
Correspondence: Yann Gibert, Medical and Molecular Genetics, Indiana University School of Medicine, 975 W Walnut St IB 454C, Indianapolis, IN 46202; email: ygibert@umc.edu.
References
Author notes
DE-Seq2 data for differentially expressed genes of control and treated erythroid cells are available at Gene Expression Omnibus (accession number GSE282805) and can be found in supplemental Tables 1 and 2. Primer sequences used in reverse transcription quantitative polymerase chain reaction analysis can be found in supplemental Table 3. The metabolite profiles of the control and treated erythroid cells can be found in supplemental Table 4.
Original data are available upon request from author Kim Uyen C. Nguyen (kimuyencongnguyen@gmail.com).
The full-text version of this article contains a data supplement.

