TO THE EDITOR:
Patients with sickle cell disease (SCD) frequently experience vaso-occlusive crises (VOCs) attributable to erythrocyte sickling, adherence to the vascular endothelium, increased blood viscosity, and altered microvascular rheology. We hypothesized that noninvasively monitoring microvascular blood flow could provide valuable insights into treatment responses in this population. Support for this notion comes from near-infrared spectroscopy (NIRS) studies, which noninvasively monitored microvascular cerebral blood flow and compared favorably with transcranial Doppler ultrasound.1 Similarly, thromboelastography (TEG), another emerging point-of-care (POC) technology, has yielded insights into the association between the hypercoagulable state and the occurrence of VOC in patients with SCD.2 Therefore, we assessed whether monitoring microvascular flow and coagulation parameters using noninvasive POC technology would provide insight into treatment responses and help guide the interpretation of clinical trial outcomes.
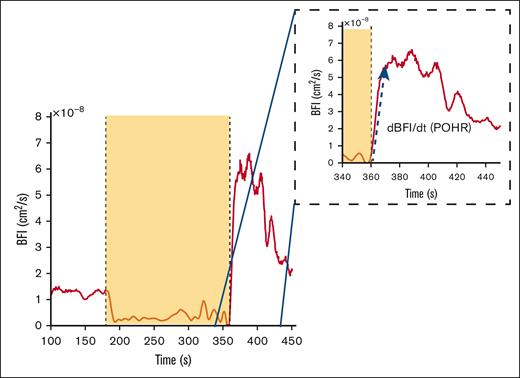
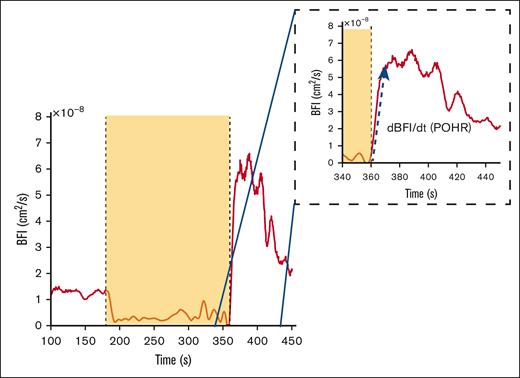
Diffuse correlation spectroscopy (DCS) provides a quantitative assessment of blood flow and tissue perfusion within a specific volume of the tissue under investigation.3 DCS sends near-infrared light into the tissue and detects light back-scattered due to red blood cell movement at depths up to 1.5 cm with minimal impact from melanocytes at the topmost layer (∼200 μm) and thereby determines changes in tissue blood flow and microvascular perfusion. Using the correlation diffusion equation4 an optical measurement of blood flow called the blood flow index (BFI) is calculated, which is directly proportional to the dynamic behavior of red blood cells within the tissue. As a physiological challenge, arterial blood flow in the forearm is temporarily occluded by inflating a blood pressure cuff in the arm to briefly cause “ischemia” followed by deflation of the cuff to allow “reperfusion” of the distal tissues. This induced ischemia-reperfusion challenge serves as a useful surrogate model of ischemia-reperfusion injury pathophysiology occurring during a clinical VOC in SCD. Postocclusion hyperemic responses (POHRs; Figure 1) indicative of endothelial function were then determined by normalizing the maximal change in light absorption after occlusion (BFI rate of change [dBFI]) by the corresponding time interval (denoted by dt) (Figure 1, blue arrow POHR = dBFI/dt, [cm2/s/s].
Example of DCS data acquired during brachial cuff occlusion in a representative subject. The dashed inset box is a magnified image of the time frame during POHR. The yellow box signifies the occlusion period as seen by the sudden BFI drop, and the blue arrow shows the data segment over which the BFI rate of change (dBFI) is computed over a given time interval (POHR = dBFI/dt).
Example of DCS data acquired during brachial cuff occlusion in a representative subject. The dashed inset box is a magnified image of the time frame during POHR. The yellow box signifies the occlusion period as seen by the sudden BFI drop, and the blue arrow shows the data segment over which the BFI rate of change (dBFI) is computed over a given time interval (POHR = dBFI/dt).
TEG records the in vitro clot formation upon stimulation with kaolin using a viscoelastic cup-and-pin method. Four recorded parameters (R-time, K-time, α-angle, and maximal amplitude) are used to derive the coagulation index (CI) using the formula CI = −0.6516R – 0.3772K + 0.1224MA + 0.0759α − 7.7922; a positive CI (more than +3.0) suggests hypercoagulability characteristic of patients with SCD, and a negative CI (less than −3.0) indicates hypocoagulability.
In this study, the efficacy of the flavonoid compound isoquercetin (IQ) to attenuate the sickle thromboinflammatory state was assessed in a phase 2 clinical trial (NCT04514510). Participants with steady-state SCD (n = 46) were randomly allocated to receive treatment with either IQ (n = 23) 1000 mg daily (Querces Pharma AG, Zug, Switzerland) or an identically formulated placebo (n = 23) for 28 days. Sodium citrate anticoagulated obtained from participants at baseline (BL; day 0) and after IQ/placebo treatment (day 28) was analyzed within 1 hour of phlebotomy on the TEG 5000 Analyzer (Haemonetics UK Ltd, Coventry, United Kingdom). Similarly, microvascular blood flow and POHR after temporary arterial vessel occlusion of the forearm were determined at BL and 28 days after IQ/placebo treatment using the DCS-NIRS function of a commercially available multimodal NIRS instrument (MetaOx ISS, Champaign, IL).
For DCS, participants were seated upright and the NIRS probe and a blood pressure cuff were placed on the right arm, and resting BL BFI (cm2/s) was recorded for 3 minutes followed by occlusion of the blood flow for 3 minutes and recording of the POHR for 3 minutes after cuff deflation. Statistical analysis was performed using the t test and associations between CI and POHR were analyzed using the Spearman correlation coefficient (Spearman rho [ρ]).
Only 17 (IQ, n = 8; placebo, n = 9) of the 46 randomized participants had DCS-NIRS parameters recorded because of restrictions imposed by the COVID-19 pandemic. Therefore, DCS-NIRS and TEG measurements obtained at BL and 28 days posttreatment (PT) for these 17 participants were extracted for this report. Among this group, participants exhibiting NIRS recording artifacts induced by inflation of the blood pressure cuff were excluded from the analysis (n = 4 [IQ, n = 2; placebo n = 2]). Similarly, participants receiving treatment with a direct oral anticoagulant, which can interfere with TEG measurements, were excluded from the analysis (n = 2 [IQ, n = 1; placebo, n = 1]). Therefore, paired BL and PT data from 11 of 17 participants with both DCS-NIRS and TEG measurements (IQ, n = 5; placebo, n = 6) were used for this report (Table 1).
Among the 11 participants, TEG-determined CIs were comparable at BL and 28-days PT (BL, 3.0 ± 1.3; PT, 3.0 ± 1.6; P = .91). However, when analyzed according to treatment allocation, the absolute reduction in CI observed PT compared with the BL was slightly lower in the IQ group than in the placebo group (P = .05; Table 1). These efficacy data were consistent with the significantly reduced CI observed in 22 participants after IQ treatment in the main trial.5
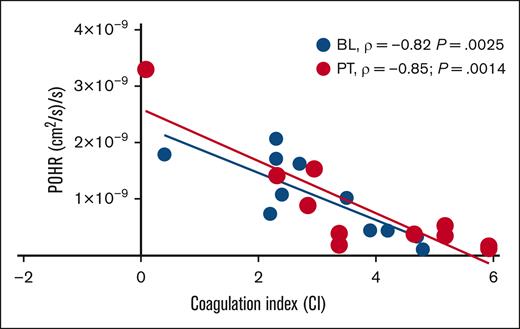
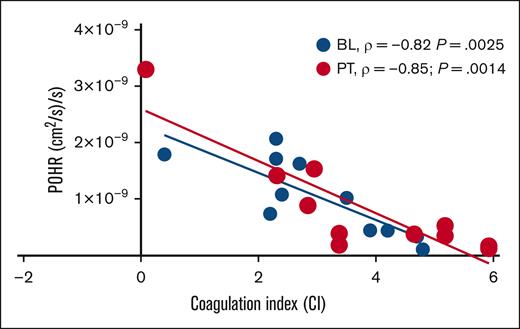
In this cohort of patients with steady-state SCD (n = 11) on stable dose of hydroxyurea, BL POHRs were similar to the POHRs determined in ethnically- and age-matched healthy participants (n = 4, mean ± standard deviation, 1.6 × 10⁻⁹ ± 9.6 × 10⁻¹⁰ vs 1.0 × 10⁻⁹ ± 6.7 × 10⁻¹⁰; P = .22; T. Quang and B. Tromberg, written communication, 4 April 2024). When participants were stratified according to treatment allocation, no significant changes in POHR were observed PT compared with BL among the IQ and placebo groups (P = .42; Table 1). Next, we assessed the degree of association between POHR and CI and found a strong inverse correlation at BL (Spearman ρ = −0.82; P = .0025; Figure 2). Interestingly, the measurement of POHR and CI 28 days PT demonstrated persistence of this inverse correlation (Spearman ρ = −0.85; P = .0014; Figure 2), underscoring the consistency and reproducibility of these 2 POC biomarkers. Analysis according to treatment allocation revealed that the PT inverse correlation between POHR and CI was no longer statistically significant (IQ, P = .08; placebo, P = .07), likely due to the small sample size. In 2 patients who experienced VOCs during the study (1 each in IQ and placebo groups), we observed the highest recorded CI values (placebo, 5; IQ, 4.3) and the lowest recorded POHRs (placebo, 1.7 × 10⁻¹⁰; IQ, 5.2 × 10⁻¹⁰).
Scatterplot showing linear relationship between POHR and CI. In the subgroup of patients with steady-state SCD studied at BL ( BL, n = 11) and 28 days PT (
 PT, n = 11), POHR demonstrated a good negative correlation with the blood CI (BL, Spearman ρ = −0.82; P = .0025; PT, Spearman ρ = −0.85; P = .0014).
Scatterplot showing linear relationship between POHR and CI. In the subgroup of patients with steady-state SCD studied at BL ( BL, n = 11) and 28 days PT (
 PT, n = 11), POHR demonstrated a good negative correlation with the blood CI (BL, Spearman ρ = −0.82; P = .0025; PT, Spearman ρ = −0.85; P = .0014).
Patients with SCD display a complex and incompletely elucidated relationship among erythrocyte sickling, heterocellular interactions, microvascular transit time, and hypercoagulability.6 Microvascular transit time is inversely related to the blood flow rate. Increased red blood cell–leukocyte endothelial adhesivity and hypercoagulability in patients with SCD reduces the vascular flow rate and increases the red cell transit time, thereby potentially increasing the fraction of intraerythrocytic sickle hemoglobin that can polymerize during the hypoxia experienced in the venous microvasculature.6,7 Intriguingly, even with this small sample size, there was a significant inverse correlation between POHR and the CI, suggesting that impaired hyperemic responses are more likely in patients with abnormal coagulation profiles, possibly implicating a causal role for hypercoagulability in clinical disease manifestations. Even if these limited data preclude meaningful analysis of the efficacy of IQ, there is a suggestion that hypercoagulability impairs microvascular blood flow and reperfusion responses possibly accentuating delays in red cell transit time through the microvasculature. Therefore, the data points to the utility of noninvasive monitoring tools in studying vascular responses and objectively measuring the efficacy of agents that target the vascular pathobiology of SCD. The stability and reproducibility of POHR measurements conducted at least 4 weeks apart hint to the potential for repeated longitudinal measurements using DC-NIRS. Overall, these data suggest that minimally invasive POC technology has considerable value for monitoring treatment responses and potentially enhancing patient-reported outcomes. Additional studies conducted in a larger number of patients exhibiting clinical complications of SCD could clarify the robustness of these noninvasive surrogate biomarkers. Such studies may eventually determine whether these biomarkers could guide emergency room clinical decision-making in patients experiencing acute VOC, particularly in those with high health care utilization rates.
Acknowledgments: The authors thank Neal Jeffries (Office of Biostatistics Research, National Heart, Lung, and Blood Institute [NHLBI], National Institutes of Health, Bethesda, MD) for their help with statistical analysis. The authors also thank all participants involved in this study. The authors acknowledge the Sickle Cell Branch, NHLBI, and direct readers to ClinicalTrials.gov (identifier NCT05604547) for providing information on near-infrared spectroscopy measurements in ethnically matched controls and patients with sickle cell disease.
This work was supported by the intramural research program of the NHLBI (ZIA#HL006256 and HL006241).
The sponsor had no role in the overall conduct of the study or the collection, analyses, and interpretation of the data.
Contribution: A.S.S. conceived and designed the experiments; B.P.G., T.Q., M.A.L.-I., and A.C. performed experiments; B.P.G., T.Q., and M.A.L.-I. analyzed the data; B.T., A.D.-F., and D.L. contributed reagents, materials, and analysis tools; B.P.G. and A.S.S. wrote the manuscript; and all authors reviewed and approved the manuscript.
Conflict-of-interest disclosure: The authors declare no competing financial interests.
Correspondence: Arun S. Shet, Cellular and Molecular Therapeutics Branch, National Heart, Lung and Blood Institute, National Institutes of Health, 10 Center Drive Building 10, Room 6N240B, Bethesda, MD 20892-1589; email: arun.shet@nih.gov.
References
Author notes
B.P.G. and T.Q. contributed equally to this study.
Data are available from the corresponding author, Arun S. Shet (arun.shet@nih.gov), upon reasonable request.


 BL, n = 11) and 28 days PT (
 PT, n = 11), POHR demonstrated a good negative correlation with the blood CI (BL, Spearman ρ = −0.82; P = .0025; PT, Spearman ρ = −0.85; P = .0014).