Key Points
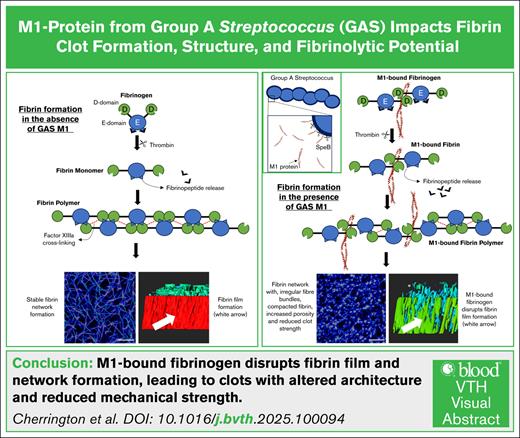
rM1-bound fibrinogen produces clots with irregular fiber bundles, compacted fibrin with increased porosity, and susceptibility to lysis.
rM1-bound fibrinogen disrupts the formation of the protective fibrin film and reduces the mechanical clot strength.
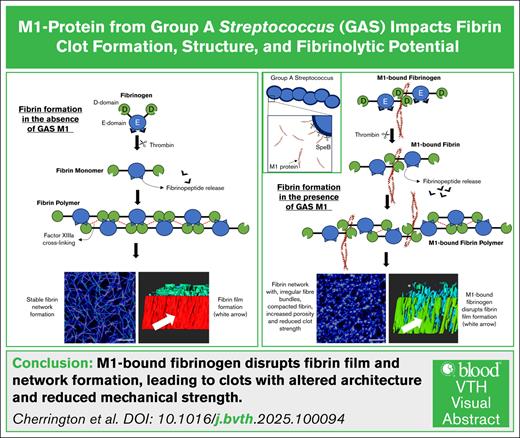
Visual Abstract
M1 protein is a major virulence determinant of group A Streptococcus (GAS). During infection, M1 is cleaved from the cell surface by host and bacterial proteases resulting in soluble M1 at the site of infection. M1 forms a supramolecular complex with host fibrinogen. We hypothesize that this supramolecular complex affects the formation of fibrin clots. Fibrin formation is an essential part of innate immunity, sealing off infections to limit bacteria spreading. The effects of recombinant M1 (rM1) were assessed in fibrin clots made from whole blood, plasma, or purified fibrinogen incubated in thrombin by a semiautomated coagulation analyzer, permeation studies, confocal microscopy, and scanning electron microscopy. Clotting and lysis profiles (with plasminogen activators and plasminogen) were investigated using microtiter plate assays and kinetically with rotational thromboelastography. Factor XIII crosslinking was quantified using commercial kits and sodium dodecyl sulfate–polyacrylamide gel electrophoresis densitometry analysis. This study demonstrated that rM1-bound (0.47-60 μg/mL) fibrinogen produced clots with remarkably different structures and properties compared with clots without rM1. Inclusion of rM1 formed heterogeneous clots with irregular fiber bundles and compacted fibrin. Formation of the protective fibrin film was disrupted by rM1. Furthermore, mechanical strength of fibrin clots was reduced, and the fibrin networks were more porous with increased fluid permeability. Fibrin clots formed using whole blood incorporating rM1 were more susceptible to lysis by plasmin. GAS strains of M1 type are often associated with invasive infections; the impact of M1 on fibrin structure could contribute to the severity of GAS infection by compromising the fibrin barrier that limits bacterial proliferation and migration.
Introduction
Metastasis of group A Streptococcus (GAS; Streptococcus pyogenes) is facilitated by the major cell-surface–bound virulence factor, M protein. The M proteins play multiple roles to aid bacterial dissemination, including adherence to host epithelial cells,1,2 immune evasion,3 and microcolony formation.4 Furthermore, a subcutaneous mouse model of invasive GAS disease demonstrated M proteins to be essential for full virulence.5 GAS isolates are serotyped based on the 5′ end of the emm gene, with >250 distinct emm gene variations identified to date.6 Although most M-serotype GAS can cause invasive diseases, the M1 serotype is consistently the leading cause of invasive infections worldwide.7,8 In addition, a marked increase in invasive diseases since the 1980s is attributed to a single hypervirulent strain of GAS, the M1T1 clone, which continues to be overrepresented in severe infections such as necrotizing fasciitis and streptococcal toxic shock syndrome.9
The M1 protein is a coiled-coil dimer anchored to the GAS cell wall by a C-terminal LPXTG motif. It comprises an N-terminal hypervariable region and conserved A-, B-, S-, and C-repeat domains.10,11 The B1 and B2 repeats are known to mediate fibrinogen binding, whereas the S region facilitates additional host interactions. Recent structural analysis resolved a supramolecular complex in which the B-repeat region of M1 engages 4 fibrinogen D fragments in a crosslike pattern.12
During infection, M1 protein exists in both soluble and surface-bound forms. Early in infection, M1 can be shed or cleaved from the bacterial surface by GAS cysteine protease (SpeB)13 or neutrophil proteinases14 resulting in soluble M1 protein at sites of infection. This M1 protein binds host fibrinogen to form supramolecular complexes that can activate neutrophils and, in the presence of anti-M1 immunoglobulin G, platelets. These interactions have been linked to immune evasion, tissue damage, and the development of a procoagulant state under inflammatory conditions.3,14,15 As infection progresses, mutations in the control of virulence two-component regulatory system 2-component regulatory system frequently arise, leading to suppression of SpeB expression and enhanced retention of M1 on the bacterial surface.16,17 Although surface-bound M1 is associated with invasive disease, soluble M1 is likely to precede this stage and may play a critical role in priming the local environment for dissemination. Despite extensive structural characterization of M1-bound fibrinogen interactions, the consequences of this in relation to coagulation are poorly understood and investigated. Furthermore, the impact on fibrin formation from fibrinogen-bound M1 protein has not yet been reported.
Fibrin is an important part of innate immunity, being a major structural component for blood clots, by providing a scaffold to prevent blood loss and to promote wound healing.18 During coagulation, fibrinogen is cleaved by thrombin to form fibrin monomers, which polymerize into protofibrils and laterally aggregate to form a branched, 3-dimensional network. This fibrin mesh stabilizes the clot and provides a scaffold for cell adhesion and wound repair and acts as a barrier to physically entrap and prevent the spreading of pathogens.19,20 In addition to this internal meshwork, fibrin forms a continuous film at the air-liquid interface. This film serves as a protective barrier, limiting microbial invasion at sites of infection. Disruption of this film has been associated with increased susceptibility to bacterial penetration, underscoring its potential role in host defense during infection.21 This study aimed to investigate the impact of fibrinogen-bound M1 protein on fibrin clot formation, structure, and fibrinolytic potential.
Methods
Clot turbidimetric analysis and plasminogen activation microtiter assays
Whole-blood microtiter assays
A modified version of the halo method developed by Bonnard et al24 was used to quantify the effect of rM1 on whole-blood lysis. For full details, see the supplemental Methods.
Semiautomated coagulation analysis using KC4
Thrombin clotting time was measured using a KC4 delta coagulometer, a semiautomated mechanical clot detection analyzer. Clots were formed directly into KC4 cuvettes with the addition of plasma (50%) or 3 mg/mL purified fibrinogen and rM1 (0.94-60 μg/mL) with 0.5 IU/mL thrombin. Clot formation was defined as the time(s) taken for the fibrin clot to displace the steel ball from the magnetic sensor situated in the KC4 coagulometer.
ROTEM
Viscoelastic properties of whole blood, plasma, and purified fibrin clots in the presence of rM1 were determined using a rotational thromboelastography (ROTEM) delta instrument operated according to the manufacturer’s instructions. For full details, see the supplemental Methods.
Permeation studies
Permeation constants (Ks) were measured as described previously25-28 with minor modifications. For full details, see the supplemental Methods.
Fibrin crosslinking
Fibrin crosslinking analysis was developed from previously published methods29-32 and commercial assay kits, as described in the supplemental Methods.
Microscopy of fibrin clots
Scanning electron microscopy (SEM) was performed as previously described21 with amendments as detailed in the supplemental Methods.
Laser scanning confocal microscopy (LSCM) was performed on fully hydrated clots as described in the supplemental Methods. Fibrin networks and fibrin clot film were imaged using a 63× water immersion lens (Leica, HC PL APO CS2 63×/1.20) with a Leica TCS SP8X MP OPO spectral confocal microscope. Images were analyzed as per the protocol given in supplemental Methods.
Results
M1 protein affects fibrin clot formation
The impact of rM1 on fibrin clot formation was investigated using turbidimetric assays; the typical clotting profile is found in Figure 1A. Inclusion of increasing concentrations of rM1, in plasma and purified conditions, resulted in a decrease in maximum absorbance in a dose-dependent manner. In purified conditions (Figure 1C), a 1.6-fold decrease in maximum absorbance was observed at 30 μg/mL rM1 compared with the 0 μg/mL rM1 control (optical density [OD], 0.81 ± 0.03; and OD, 1.28 ± 0.02, respectively). Although, in plasma conditions (Figure 1B), a maximum of 2.4-fold decrease was observed at 60 μg/mL rM1 compared with the control (OD, 0.16 ± 0.013; and OD, 0.38 ± 0.01, respectively).
Representative turbidimetric clotting profiles. (A) Clotting profiles of purified fibrin (3 mg/mL) with increasing concentrations of rM1 (0-60 μg/mL) (n = 4). Maximum absorbance parameters extracted from the turbidity clotting profiles in (B) plasma and (C) purified conditions (n = 4). (D) Clotting time was analyzed using a thrombin time assay with a micro-mechanical clot detection KC4 coagulometer in varying concentrations of rM1 (0-60 μg/mL). The dotted lines represent the baseline (absence of M1) condition (n = 4). Error bars represent standard error of the mean (∗P < .05, ∗∗P < .01, ∗∗∗P < .001, ∗∗∗∗P < .0001, 1-way analysis of variance [ANOVA] with Dunnett post hoc test).
Representative turbidimetric clotting profiles. (A) Clotting profiles of purified fibrin (3 mg/mL) with increasing concentrations of rM1 (0-60 μg/mL) (n = 4). Maximum absorbance parameters extracted from the turbidity clotting profiles in (B) plasma and (C) purified conditions (n = 4). (D) Clotting time was analyzed using a thrombin time assay with a micro-mechanical clot detection KC4 coagulometer in varying concentrations of rM1 (0-60 μg/mL). The dotted lines represent the baseline (absence of M1) condition (n = 4). Error bars represent standard error of the mean (∗P < .05, ∗∗P < .01, ∗∗∗P < .001, ∗∗∗∗P < .0001, 1-way analysis of variance [ANOVA] with Dunnett post hoc test).
The clot formation time was measured using a KC4 delta coagulometer in plasma and purified conditions (Figure 1D). In purified fibrin conditions, rM1 concentrations below 7.5 μg/mL produced consistent clot formation times of ∼31.10 ± 0.3 seconds. Concentrations of rM1 above 7.5 μg/mL resulted in extended clotting times up to a maximum of 2.3-fold increase at 60 μg/mL rM1 (P ≤ .0001, relative to the purified control without the presence of rM1, 30.4 ± 0.3 seconds). A similar trend was observed in plasma conditions, with extended clotting times above 7.5 μg/mL, up to a maximum of approximately twofold at 60 μg/mL rM1 (58.28 ± 1.34 seconds, P ≤ .0001).
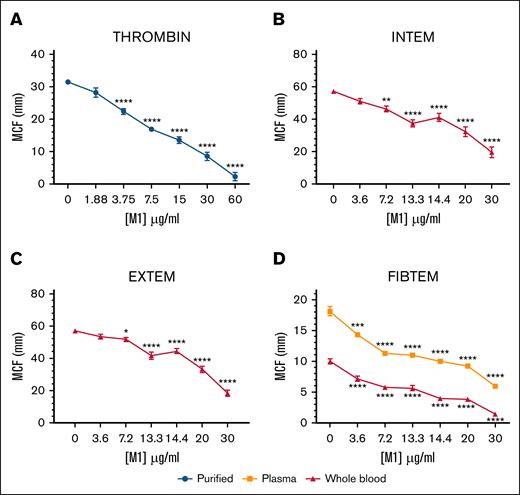
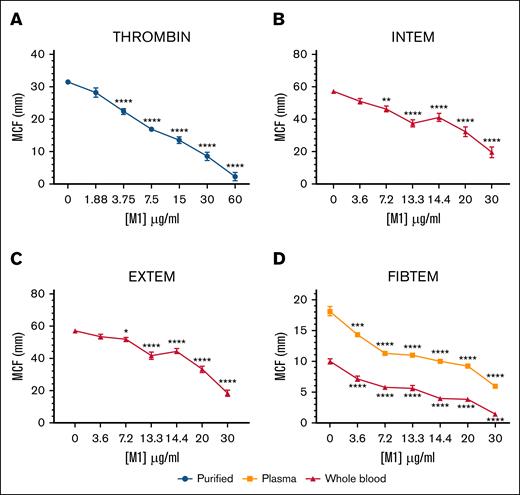
The effect of rM1 in purified, plasma, and whole-blood conditions was explored using ROTEM. The maximum clot firmness (MCF) decreased in each condition, with increasing concentrations of rM1 (Figure 2). In purified conditions (Figure 2A), where fibrinogen and rM1 clotting were initiated with a thrombin solution, MCF decreased in clot strength until almost undetectable levels at 60 μg/mL rM1 with an ∼14-fold reduction (2.25 ± 1.32 mm) in comparison to the control (31.42 ± 0.57 mm; P < .0001). A similar trend was also observed in whole-blood conditions, when the intrinsic clotting cascade was activated with ellagic acid using intrinsic rotational thromboelastometry-s assay (Figure 2B) and the extrinsic cascade was activated with tissue factor using an extrinsic rotational thromboelastometry-s assay (Figure 2C). At 13.3 μg/mL rM1 protein, there is a 1.5-fold and 1.4-fold decrease in MCF, respectively, in comparison to the 0 μg/mL rM1 control. The largest decrease was observed at 30 μg/mL rM1 with 2.9-fold and 3.1-fold decrease in MCF, respectively. Whole-blood and plasma fibrin clots were further investigated using a fibrin-based fibrinogen rotational thromboelastometry assay (Figure 2D) in which platelets were inhibited with cytochalasin D (isolating the contribution of fibrinogen). A significant decrease of MCF was observed from 3.6 μg/mL rM1 in both plasma (1.3-fold) and whole-blood conditions (1.4-fold) in comparison to the control. The largest decrease was observed at 30 μg/mL rM1, with almost undetectable levels in both the whole blood condition (sevenfold decrease) and plasma (threefold decrease).
M1 protein affects fibrin clot strength. Physical strengths of the clots were measured with the addition of (A) thrombin, (B) an intrinsically activated INTEM assay, (C) extrinsically activated EXTEM assay or (D) a fibrin-based FIBTEM assay performed using ROTEM. Maximum clot formation (mm) after 1 hour is illustrated. Error bars represent standard error of the mean (∗P < .05, ∗∗P < .01, ∗∗∗P < .001, ∗∗∗∗P < .0001, 1-way ANOVA with Dunnett post hoc test, relative to each condition 0 μg/mL); n ≥ 3. EXTEM, extrinsic rotational thromboelastometry; FIBTEM, fibrinogen rotational thromboelastometry; INTEM, intrinsic rotational thromboelastometry.
M1 protein affects fibrin clot strength. Physical strengths of the clots were measured with the addition of (A) thrombin, (B) an intrinsically activated INTEM assay, (C) extrinsically activated EXTEM assay or (D) a fibrin-based FIBTEM assay performed using ROTEM. Maximum clot formation (mm) after 1 hour is illustrated. Error bars represent standard error of the mean (∗P < .05, ∗∗P < .01, ∗∗∗P < .001, ∗∗∗∗P < .0001, 1-way ANOVA with Dunnett post hoc test, relative to each condition 0 μg/mL); n ≥ 3. EXTEM, extrinsic rotational thromboelastometry; FIBTEM, fibrinogen rotational thromboelastometry; INTEM, intrinsic rotational thromboelastometry.
M1 protein influences fibrin structure
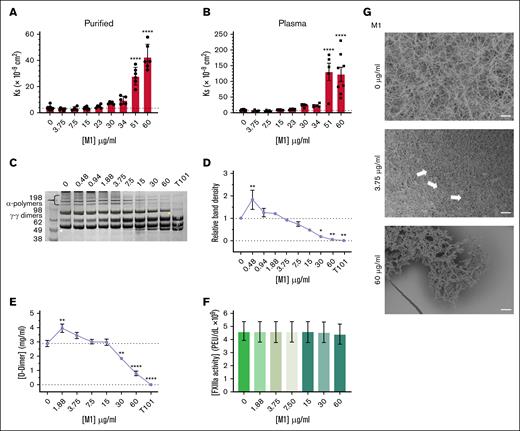
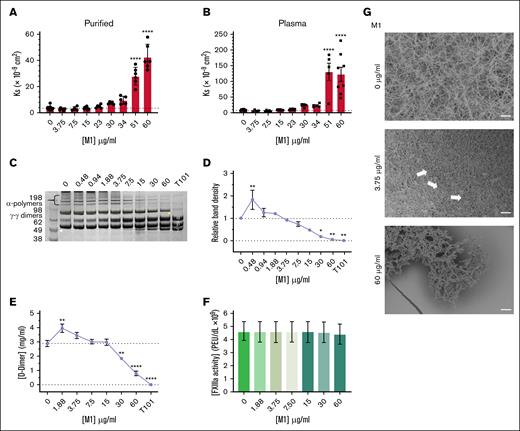
The effect of rM1 on Ks was investigated next, reflecting the average pore size of fibrin clots. Fibrin clots formed in the presence of <23 μg/mL rM1 did not demonstrate any significant differences in Ks in purified (Figure 3A) and plasma (Figure 3B) conditions. Above 23 μg/mL rM1, there was a gradual increase in porosity in both purified and plasma conditions up to a maximum of 12-fold increased permeability at 60 μg/mL in purified conditions (42.53 Ks × 109 cm2 ± 3.97 Ks × 109 cm2) and a 15-fold increase at 51 μg/mL in plasma conditions (131.04 Ks × 109 cm2 ± 27.51 Ks × 109 cm2) in comparison to the respective controls.
M1 protein affects fibrin clot structure. Porosity (Darcy’s constant, Ks (×10−9 cm2) of (A) purified and (B) plasma fibrin clots formed with thrombin in the presence of rM1 (0-60 μg/mL); n ≥ 3. Fibrin crosslinking by FXIIIa was investigated using (D) densitometry analysis of alpha-polymer chains from (C) SDS-PAGE analysis (n = 3) and (E) D-dimer quantification of lysed fibrin clots in the presence of rM1 (0-60 μg/mL). An FXIIIa inhibitor, T101, was included to mimic no fibrin clot crosslinking by FXIIIa. FXIIIa activity in the presence of rM1 (0-60 μg/mL) was calculated using an (F) AbCam Factor FXIIIa activity kit (N = 5). Fibrin clot architecture was visualized using (G) SEM in the presence of rM1 (0, 3.75, and 60 μg/mL). Fibrin clots, incorporating rM1 (0, 3.75, or 60 μg/mL), were formed in perforated Eppendorf lids and then fixed, dehydrated, critically point dried, and coated with 10-nm iridium. Clots were imaged at a minimum of 3 areas using Hitachi SU8230 (field emission scanning electron microscope) SEM. Arrows indicate the formation of irregular fiber bundles and compacted fibrin. Scale bar: 10 μm. n = 3. Error bars represent standard error of the mean. (∗P < .05, ∗∗P < .01, ∗∗∗P < .001, ∗∗∗∗P < .0001, 1-way ANOVA with Dunnett post hoc test).
M1 protein affects fibrin clot structure. Porosity (Darcy’s constant, Ks (×10−9 cm2) of (A) purified and (B) plasma fibrin clots formed with thrombin in the presence of rM1 (0-60 μg/mL); n ≥ 3. Fibrin crosslinking by FXIIIa was investigated using (D) densitometry analysis of alpha-polymer chains from (C) SDS-PAGE analysis (n = 3) and (E) D-dimer quantification of lysed fibrin clots in the presence of rM1 (0-60 μg/mL). An FXIIIa inhibitor, T101, was included to mimic no fibrin clot crosslinking by FXIIIa. FXIIIa activity in the presence of rM1 (0-60 μg/mL) was calculated using an (F) AbCam Factor FXIIIa activity kit (N = 5). Fibrin clot architecture was visualized using (G) SEM in the presence of rM1 (0, 3.75, and 60 μg/mL). Fibrin clots, incorporating rM1 (0, 3.75, or 60 μg/mL), were formed in perforated Eppendorf lids and then fixed, dehydrated, critically point dried, and coated with 10-nm iridium. Clots were imaged at a minimum of 3 areas using Hitachi SU8230 (field emission scanning electron microscope) SEM. Arrows indicate the formation of irregular fiber bundles and compacted fibrin. Scale bar: 10 μm. n = 3. Error bars represent standard error of the mean. (∗P < .05, ∗∗P < .01, ∗∗∗P < .001, ∗∗∗∗P < .0001, 1-way ANOVA with Dunnett post hoc test).
The effect of rM1 protein on fibrin crosslinking by factor XIIIa (FXIIIa) was investigated. The fibrin clots containing increasing concentrations of rM1 were reduced and subjected to sodium dodecyl sulfate (SDS)-polyacrylamide gel electrophoresis (PAGE) analysis (Figure 3C), and the alpha-polymer chains were evaluated through densitometry analysis (Figure 3D). A dose-dependent decrease in alpha-polymer density was observed at concentrations above 1.88 μg/mL up to 60 μg/mL where crosslinking was almost completely inhibited (0.049 ± 0.029 relative band density, P = .0027). An initial significant increase of 1.8-fold at 0.422 (P = .0099) in relative band density was observed at 0.48 μg/mL rM1. A D-dimer enzyme-linked immunosorbent assay plate assay was used to further investigate fibrin-clot crosslinking by FXIIIa. Above 15 μg/mL rM1, an overall dose-dependent decrease in D-dimer concentration was observed, up to 3.6 μg/mL decrease at 60 μg/mL rM1 (0.794 mg/mL ± 0.137 mg/mL vs 2.86 mg/mL ± 0.218 mg/mL; P ≤ .0001; Figure 3E). In addition, consistent with the densitometry analysis data, an initial increase in D-dimer concentration was observed. Between 1.88 μg/mL and 3.75 μg/mL rM1, there was a significant increase in D-dimer concentration up to ∼1.4-fold increase at 1.88 μg/mL rM1 (3.93 mg/mL ± 0.295 mg/mL and 2.86 mg/mL ± 0.218 mg/mL, respectively; P = .0019). When the impact of rM1 on FXIIIa activity was investigated, there were no significant differences with increasing concentrations of rM1 suggesting rM1 does not directly inhibit FXIIIa (Figure 3F).
The fibrin-clot architecture was investigated in human plasma using SEM. As found in Figure 3G, fibrin clots prepared in the absence of rM1 demonstrated a homogeneous structure. In contrast, at low concentrations of rM1 (3.75 μg/mL), the fibrin fibers appear more densely packed with an apparent decrease in the size of the pores, which is consistent with the porosity data. The white arrows indicate regions of irregular fiber bundles and compacted fibrin which are not present in the control condition (0 μg/mL rM1). At the high concentration of rM1 (60 μg/mL), the overall clot network structure is lost.
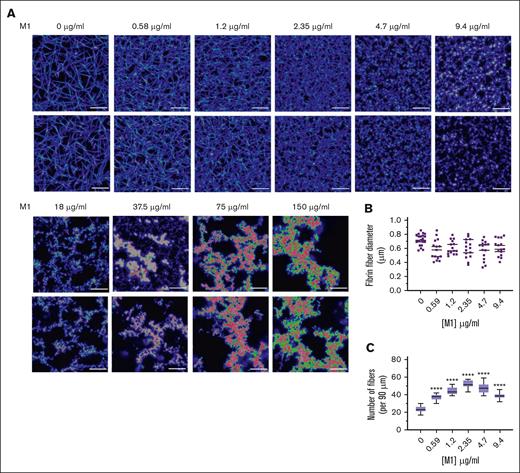
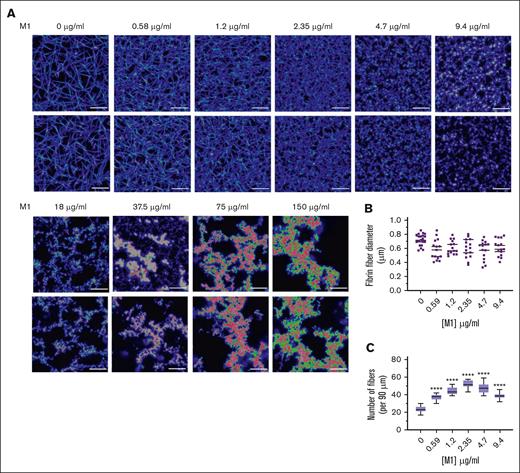
LSCM was used to investigate the native, fully hydrated structure of plasma fibrin clots in the presence of rM1 with a fluorescently labelled fibrinogen conjugate. As found in Figure 4A, in agreement with the SEM data, the addition of rM1 results in the formation of heterogeneous clots with irregular fiber bundles. At the lower levels of rM1 (0.59-9.4 μg/mL), individual fibrin fibers were visible and, therefore, analyzed for fibrin density. The fibrin fiber count per 90 μm (Figure 4C) demonstrated a dense clot formation at lower concentrations of rM1, with significant 2.2-fold increase at 2.35 μg/mL in comparison to the 0 μg/mL control (52.25 ± 1.29 fibers vs 23.88 ± 0.91 fibers; P < .0001). Above 2.35 μg/mL rM1, there is a gradual decrease in density, although still significantly higher than the 0 μg/mL control at 9.4 μg/mL rM1 (1.6-fold). Above concentrations of 9.4 μg/mL, the data cannot be obtained due to fibrin clustering and the limited resolution of LSCM. However, consistent with the SEM images, visually there is a decrease in clot density with increased fibrin clusters and larger pores. Analysis of fibrin fiber diameter by ImageJ did not reveal any significant differences (Figure 4B).
M1 protein affects fibrin clot architecture. (A) Representative LSCM images of plasma fibrin clots in the presence of rM1 protein (0-150 μg/mL) (n = 3). Clots were analyzed using a Leica TCS SP8X MP OPO spectral confocal microscope and images using 63× water immersion objective (pin hole: 1.0 airy, 16-bit resolution). (B) Fibers (n = 20) were selected at random per condition and quantified in terms of their diameters using ImageJ. (C) Fibrin fiber density was calculated from LSCM images by applying a grid overlay and counting the number of fibers crossing the lines (n = 3). Error bars represent standard error of the mean. (∗P < .05, ∗∗P < .01, ∗∗∗P < .001, ∗∗∗∗P < .0001, 1-way ANOVA with Dunnett post hoc test).
M1 protein affects fibrin clot architecture. (A) Representative LSCM images of plasma fibrin clots in the presence of rM1 protein (0-150 μg/mL) (n = 3). Clots were analyzed using a Leica TCS SP8X MP OPO spectral confocal microscope and images using 63× water immersion objective (pin hole: 1.0 airy, 16-bit resolution). (B) Fibers (n = 20) were selected at random per condition and quantified in terms of their diameters using ImageJ. (C) Fibrin fiber density was calculated from LSCM images by applying a grid overlay and counting the number of fibers crossing the lines (n = 3). Error bars represent standard error of the mean. (∗P < .05, ∗∗P < .01, ∗∗∗P < .001, ∗∗∗∗P < .0001, 1-way ANOVA with Dunnett post hoc test).
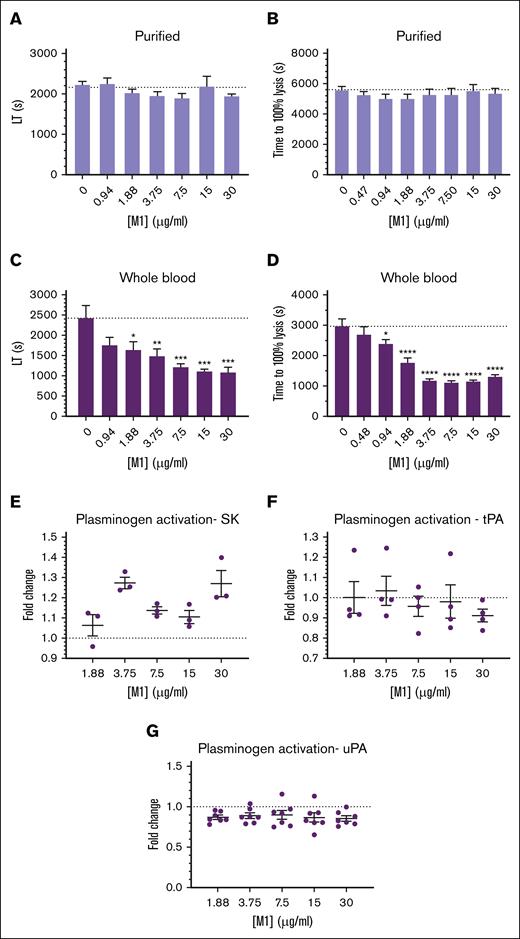
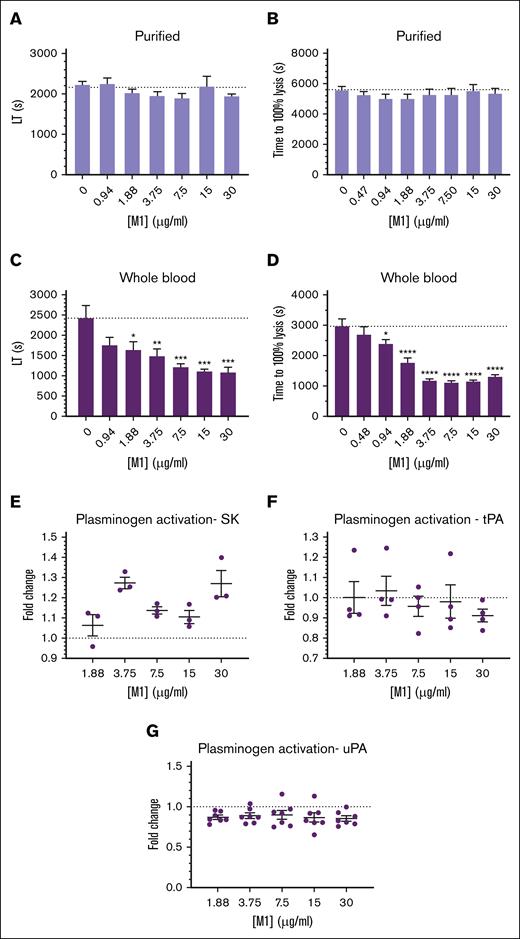
Changes in structural properties of fibrin can have large effects on its lysis by fibrinolytic enzymes, due to an increased (or decreased) ability to migrate through the fibrin fiber network. Clots formed with thrombin and purified fibrinogen incorporating increasing concentrations of rM1 demonstrated no significant differences in lysis time when measured with ROTEM (Figure 5A) or in a microtiter-based turbidity assay (Figure 5B). However, in whole-blood conditions using an extrinsically activated extrinsic rotational thromboelastometry assay (Figure 5C), an overall decrease in lysis time was observed with increasing concentrations of rM1. Below 1.88 μg/mL, a nonsignificant decrease in lysis time was observed, with reduced lysis times of ∼1.5-fold compared with the control with no rM1 added (1641.3 ± 195.6 seconds and 2428.5 ± 304.0 seconds, respectively; P = .0391). Above this concentration, a significant decrease in lysis time was observed up to a maximum of 2.2-fold decrease at 30 μg/mL rM1 in comparison to the control (1080 ± 126.7 seconds and 2428.5 ± 304.0 seconds, respectively; P = .0008). The modified halo assay24 (Figure 5D) also demonstrated a similar trend to the whole-blood ROTEM analysis. A 1.2-fold decrease in lysis time was observed at 0.94 μg/mL rM1 compared with the control without rM1 (2391 ± 135.0 seconds and 2967 ± 245.7 seconds, respectively; P = .0405). The largest decrease in time to lysis was observed at 7.5 μg/mL with a 2.7-fold reduction (1104 ± 73.5 seconds; P ≤ .0001). Above this concentration, time to 100% lysis begins increasing slowly in a dose-dependent manner.
M1 protein affects fibrin clot fibrinolytic potential. Fibrinolytic potential of fibrin clots was measured using (B,D) a microtiter plate assay and (A,C) ROTEM analysis. (C,D) Whole blood was activated with tissue factor, whereas (A,B) purified clots were activated with thrombin. The lysis time was then derived from the (A,C) ROTEM TEMogram or presented as (B,D) time to reach 100% lysis in the microtiter assays. (D) Halo assay; (B) purified turbidity assay. Plasminogen activation activity of (E) bacterial and host, (F) tPA, and (G) uPA plasminogen activators was measured in the presence of rM1 protein (0-30 μg/mL) using a chromogenic solution assay against S2251 (n ≥ 4). Error bars represent standard error of the mean. (∗P < .05, ∗∗P < .01, ∗∗∗P < .001, ∗∗∗∗P < .0001, 1-way ANOVA with Dunnett post hoc test). LT, lysis time; SK, streptokinase; tPA, tissue-type plasminogen activator; uPA, urokinase-type plasminogen activator.
M1 protein affects fibrin clot fibrinolytic potential. Fibrinolytic potential of fibrin clots was measured using (B,D) a microtiter plate assay and (A,C) ROTEM analysis. (C,D) Whole blood was activated with tissue factor, whereas (A,B) purified clots were activated with thrombin. The lysis time was then derived from the (A,C) ROTEM TEMogram or presented as (B,D) time to reach 100% lysis in the microtiter assays. (D) Halo assay; (B) purified turbidity assay. Plasminogen activation activity of (E) bacterial and host, (F) tPA, and (G) uPA plasminogen activators was measured in the presence of rM1 protein (0-30 μg/mL) using a chromogenic solution assay against S2251 (n ≥ 4). Error bars represent standard error of the mean. (∗P < .05, ∗∗P < .01, ∗∗∗P < .001, ∗∗∗∗P < .0001, 1-way ANOVA with Dunnett post hoc test). LT, lysis time; SK, streptokinase; tPA, tissue-type plasminogen activator; uPA, urokinase-type plasminogen activator.
The impact of rM1 on host and bacterial plasminogen activators was measured using clot overlay assays. The host plasminogen activators, urokinase-type plasminogen activator (Figure 5G) and tissue-type plasminogen activator (Figure 5F), demonstrated no significant differences in plasminogen activation activity with increasing concentrations of rM1. In addition, the bacteria’s native plasminogen activator, streptokinase, was incorporated (Figure 5E). However, no trend was observed with the streptokinase activity with increasing concentrations of rM1.
M1 protein disrupts fibrin film
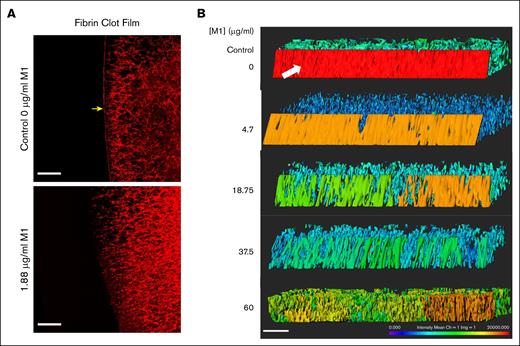
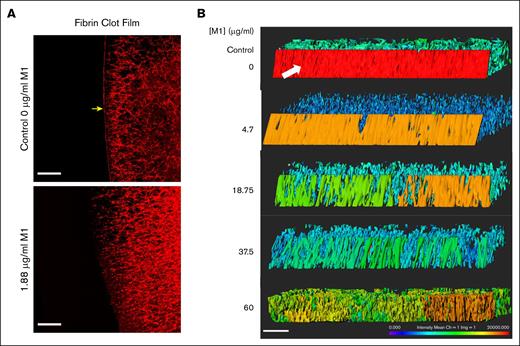
LSCM was used to visualize the impact of rM1 protein on fibrin clot film formation. Figure 6A reveals an LSCM image of a fibrin clot formed with 20% plasma, in the absence or presence of 1.88 μg/mL rM1, initiated with 0.2 IU/mL thrombin (1/578). The protective fibrin film which forms at the external surface of the clot is indicated by the yellow arrow. The fibrin film forms a continuous layer which is distinct from the fibrin fiber network underneath. As illustrated by Figure 6A, even low levels of rM1 protein (1.88 μg/mL) appeared to disrupt the formation of the fibrin film. A 3-dimensional image was constructed of the film by taking a 20-μm slice of each condition. As found in Figure 6B, the fibrin film is demonstrated in the control condition with a white arrow. The color indicates the intensity of the labelled fibrin. In the control condition, the fibrin film is red, demonstrating a high density of fibrin. As the rM1 protein increases, the number of pores in the film also increased, determined visually. The intensity of the film gradually decreases until at the highest concentration of rM1 protein (60 μg/mL), and the film is no longer distinguishable from the fibrin network underneath.
M1 protein impacts fibrin film formation. (A) LSCM of plasma fibrin film with and without the presence of rM1. Fibrin fibers were formed through the addition of thrombin in the presence or absence of 1.88 μg/mL rM1. Scale bar: 20 μm. n = 1. (B) LSCM of plasma fibrin film with increasing concentrations of rM1 (0-60 μg/mL). n = 3. Fibrinogen was fluorescently labelled with Alexa Fluor 594. Images were constructed in Imaris software. Scale bar: 20 μm. Fibrin film (arrow) forms a continuous layer on the surface of the clot, distinct from the fibrin fibers underneath.
M1 protein impacts fibrin film formation. (A) LSCM of plasma fibrin film with and without the presence of rM1. Fibrin fibers were formed through the addition of thrombin in the presence or absence of 1.88 μg/mL rM1. Scale bar: 20 μm. n = 1. (B) LSCM of plasma fibrin film with increasing concentrations of rM1 (0-60 μg/mL). n = 3. Fibrinogen was fluorescently labelled with Alexa Fluor 594. Images were constructed in Imaris software. Scale bar: 20 μm. Fibrin film (arrow) forms a continuous layer on the surface of the clot, distinct from the fibrin fibers underneath.
Discussion
Streptococcal infections can lead to severe systemic complications, including dysregulated hemostasis and microvascular thrombosis during invasive disease.5,33 Reports of M proteins forming insoluble complexes in the plasma date back to 1965, with this being identified due to interactions of M proteins and fibrinogen.34 Although the molecular basis of the M1-fibrinogen interactions has been extensively studied, the downstream effects of these interactions on fibrin formation remain poorly understood. This study investigated the effects of soluble M1 protein, which is likely to be present at sites of initial infection before accumulation of membrane-bound forms associated with invasive disease.17 The findings of this study reveal a novel role for soluble M1 protein in altering fibrin clot architecture and mechanical properties, providing insights into the pathophysiological consequences of Streptococcus pyogenes infections.
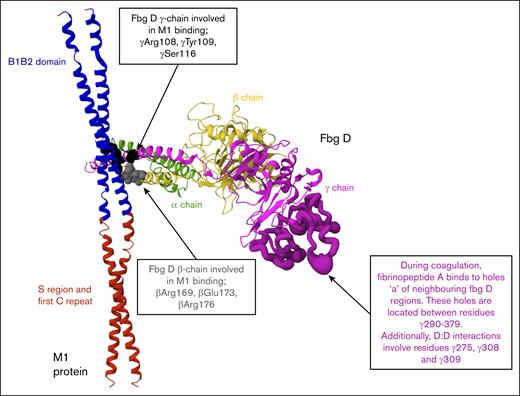
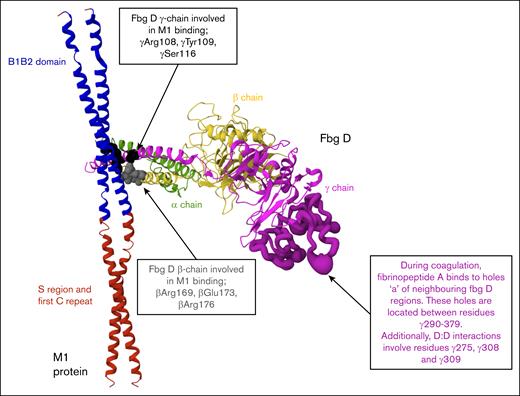
Although previous studies have typically used concentrations of recombinant or native M1 protein up to 10 μg/mL, the physiological concentration of M1 during infection has not been defined.12,14,34,35,36 This study included both lower concentrations, consistent with earlier work, and higher concentrations (up to 60 μg/mL) to model potential local accumulation of soluble M1 at infection sites and to evaluate concentration-dependent effects on clot structure and fibrinolysis. Early alterations to clot formation were evident across multiple assay formats. Clotting times, measured using a micromechanical clot detection system (KC4), were prolonged in both purified and plasma conditions at M1 concentrations above 7.5 μg/mL, indicating delayed fibrin formation. Turbidimetric assays also revealed a reduction in maximum absorbance with increasing M1 concentrations, suggesting impaired fibrin polymerization. Structural studies have revealed that M1 forms supramolecular complexes with fibrinogen through its B1B2 domains, engaging 4 fibrinogen D fragments in a crosslike pattern.12 To illustrate this interaction, we generated a model based on the published crystal structure, which displays 1 of the 4 fibrinogen D fragments bound to the M1 coiled-coil B1B2 domain (Figure 7). This simplified representation allows clear visualization of the M1-binding site, along with positions of key amino acids in the β- and γ-chains of fibrinogen. Although the E domain of fibrinogen, which contains the thrombin cleavage sites for fibrinopeptide A and B,18 was not resolved in this structure, its absence suggests that M1 does not block thrombin cleavage. Instead, M1 may impair the alignment or limit monomer accessibility, reducing the efficiency of network assembly. Consistent with this interpretation, ROTEM analysis (using intrinsic rotational thromboelastometry, extrinsic rotational thromboelastometry, and fibrinogen rotational thromboelastometry assays) revealed a concentration-dependent reduction in MCF across all matrices, indicating that M1 disrupts the formation of mechanically stable fibrin networks.
Structural representation of the M1-fibrinogen interaction. M1 protein fragment (residues 132-263, ∼17 kDa) and 1 fibrinogen fragment D domain structure (∼86 kDa) in ribbon representation. PDB: 2XNX. M1 binds fibrinogen through the B1B2 domain (blue). Fibrinogen D fragment binds to M1 through β-chains (βArg169, βGlu173, βArg176) and γ-chains (γArg108, γTyr109, γSer116) depicted by the gray and black spheres, respectively. The E domain of fibrinogen, where thrombin cleaves fibrinopeptides A and B to initiate polymerization, is not illustrated. The location of holes “a” and D:D interfaces are highlighted (dark purple) to demonstrate spatial separation from M1 binding regions.
Structural representation of the M1-fibrinogen interaction. M1 protein fragment (residues 132-263, ∼17 kDa) and 1 fibrinogen fragment D domain structure (∼86 kDa) in ribbon representation. PDB: 2XNX. M1 binds fibrinogen through the B1B2 domain (blue). Fibrinogen D fragment binds to M1 through β-chains (βArg169, βGlu173, βArg176) and γ-chains (γArg108, γTyr109, γSer116) depicted by the gray and black spheres, respectively. The E domain of fibrinogen, where thrombin cleaves fibrinopeptides A and B to initiate polymerization, is not illustrated. The location of holes “a” and D:D interfaces are highlighted (dark purple) to demonstrate spatial separation from M1 binding regions.
Imaging studies provided further insight into how M1 protein alters fibrin clot architecture. SEM and LSCM revealed progressive disruption of fibrin network organization with increasing M1 concentrations. At lower concentrations, clots appeared denser and more compact, whereas higher concentrations led to irregular fiber bundles, increased porosity, and near-complete structural breakdown. These qualitative observations were supported by quantitative porosity analysis (Ks), which revealed significant increase in clot porosity at concentrations above 23 μg/mL M1. Despite these pronounced architectural changes, confocal analysis indicated no measurable difference in fibrin fiber diameter in comparison to the control (without M1), suggesting M1 does not alter the thickness of individual fibrin strands. Instead, the disruption seems to occur at the level of fiber packing and spatial organization. This interpretation is consistent with the reduction in turbidity observed in earlier assays, particularly in plasma conditions where clot density strongly contributes to absorbance.37 The observed changes align with previous findings that more porous, loosely packed fibrin networks are associated with reduced mechanical stability and altered hemostatic function.38,39 These findings also extend earlier structural work demonstrating that M1 can organize fibrinogen into supramolecular lattices distinct from the native fibrin network.12 Although these complexes were described outside the context of clot formation, the data in this study suggest that similar interactions may interfere with spatial alignment of fibrin fibers during polymerization, contributing to impaired clot integrity. Interestingly, lower concentrations of M1 produced clots with visually denser fibrin networks; however, ROTEM analysis still revealed a reduced clot firmness under these conditions. This suggests that fibrin density alone does not equate to mechanical stability and that structural compactness may not compensate for impaired crosslinking or disordered protofibril alignment. These observations prompted further investigation into whether M1 also impairs clot stabilization through effects on FXIIIa-mediated crosslinking which can affect stability.40
The potential impact of M1 protein on fibrin crosslinking was assessed by measuring FXIII activity and evaluating fibrin α-chain polymerization through SDS-PAGE analysis and D-dimer formation. FXIIIa enzymatic activity remained unchanged in the presence of M1, indicating that the protein does not directly inhibit FXIIIa catalytic function. However, SDS-PAGE and D-dimer analysis revealed a concentration-dependent reduction in α-polymer density and fibrin degradation products at higher concentrations. At concentrations below 3.75 μg/mL, a slight increase in D-dimer levels and α-polymer density was observed, suggesting enhanced or preserved crosslinking at low M1 levels. This effect may reflect tighter fibrin packing or more favorable monomer alignment early in complex formation, potentially facilitating FXIIIa substrate accessibility. Structural data reveal that M1 binds to the D domain of fibrinogen, whereas the lysine and glutamine residues targeted by FXIIIa reside primarily in the α- and γ-chains in the αC regions which extend from the D domain.12,41-43 The spatial separation of these regions suggests that M1 is unlikely to obstruct FXIIIa binding directly. Instead, M1-fibrinogen complex formation may disrupt the molecular orientation of neighboring fibrin strands, limiting FXIIIa substrate accessibility despite preserved enzymatic activity. In light of these structural and mechanical alterations, the potential impact of M1 on clot susceptibility to lysis was next investigated.
Fibrinolysis assays revealed that the impact of M1 on clot breakdown was highly matrix dependent. In purified conditions, lysis times remained unchanged, indicating that M1 had no measurable effect on fibrinolysis in the absence of plasma proteins or cellular components. In contrast, in whole-blood clots, lysis occurred more rapidly with increasing concentrations, suggesting that M1 enhances susceptibility to fibrinolysis in more complex biological matrices. The absence of consistent trends with host plasminogen activators, tissue-type plasminogen activator and urokinase-type plasminogen activator, or the streptococcal plasminogen activator, streptokinase, indicates that M1 does not directly influence plasminogen activation, but it may instead alter fibrin network properties that affect its degradation. This interpretation is supported by the observed reduction in crosslinking and increased network porosity at higher M1 concentrations, both of which have been associated with enhanced fibrinolysis.39,44 Although platelet-derived factors are known to influence fibrinolytic resistance in whole blood,45 these effects are unlikely to explain the findings of this study. ROTEM analysis revealed reduced clot firmness, and whole blood was obtained from healthy donors unlikely to have high titers of anti-M1 immunoglobulin G, which is required for M1-fibrinogen–mediated platelet activation.15 Leukocyte-derived components, such as neutrophil extracellular traps, have been found to influence fibrinolysis26,46,47; however, this study did not directly assess leukocyte activity. Therefore, their potential to the observed effects cannot be excluded.
In addition to altering the internal fibrin network, M1 also appeared to disrupt the fibrin film, which is a distinct, surface-associated layer that forms on the surface of the clot and plays a protective role in hemostasis and host defense. This film was first described by Macrae et al,21 in which the fibrin film forms rapidly on the outer surface of clots and contributes to barrier function by limiting microbial invasion and loss of cellular components at sites of tissue injury. In this study, increasing concentrations of M1 protein were associated with progressive disruption of this film, as visualized by LSCM. At higher concentrations, the number of pores in the film increased until, at the highest concentrations of rM1 protein (60 μg/mL), the film was no longer distinguishable from the fibrin network underneath. The observed disruption may result from M1 binding to fibrinogen in solution before thrombin activation, potentially altering its interfacial behavior and interfering with early monomer assembly at the air-liquid interface, where the fibrin film rapidly forms. As the fibrin film has been proposed to contribute to innate immune protection, its loss would have functional consequences at infection sites where soluble M1 accumulates.
The findings of this study demonstrate that soluble M1 disrupts fibrin clot formation, weakens mechanical stability, impairs FXIIIa-mediated crosslinking, enhances fibrinolysis under whole-blood conditions, and compromises fibrin film integrity. These effects appear to be concentration dependent and are most pronounced in complex matrices, reflecting the likely importance of M1 accumulation at infection sites. In later stages of infection, membrane-bound M1 has been found to form a trimolecular complex with fibrinogen and plasminogen, promoting localized plasmin activity and contributing to tissue degradation.23,48 Together, these findings support a model in which M1 serves as a multifaceted virulence factor that modulates distinct aspects of the hemostatic response during the course of infection. Although therapeutic strategies targeting M1 are still under development, recent efforts have focused on vaccine candidates and monoclonal antibodies capable of neutralizing M1-mediated host interactions.49-52 These mechanistic insights not only expand our understanding of the role of M1 in GAS pathogenesis but also provide biological context to support ongoing efforts to target M1 through vaccination and antibody-based therapies.
Acknowledgments
The authors thank Robert J. Francis for the confocal microscopy expertise and Cédric Duval and Robert A. S. Ariëns for providing the protocols to perform the permeability experiments.
The authors received funding from The National Institute for Biological Standards and Control as part of their routine work for PhD research to S.C.
The funder had no role in the study design, data collection and analysis, decision to publish, or preparation of the manuscript.
Authorship
Contribution: S.C., C.T., H.P., and A.M. designed the studies; S.C. performed the experiments and collected the data; L.J.H. and S.C. performed the laser scanning confocal microscopy experiments to image the fibrin film; S.C. and C.T. drafted the manuscript; and all authors reviewed and approved the final version of the manuscript for submission.
Conflict-of-interest disclosure: The authors declare no competing financial interests.
Correspondence: Sophie Cherrington, Medicines and Healthcare products Regulatory Agency, South Mimms Laboratories, Potters Bar EN6 3QG, United Kingdom; email: sophie.cherrington@mhra.gov.uk; and Craig Thelwell, Standards Lifecycle, Science Research & Innovation, Medicines and Healthcare products Regulatory Agency, South Mimms, Hertfordshire, EN6 3QG; email: craig.thelwell@mhra.gov.uk.
References
Author notes
Data are available from the corresponding authors, Sophie Cherrington (sophie.cherrington@mhra.gov.uk) and Craig Thelwell (craig.thelwell@mhra.gov.uk), on request.
The full-text version of this article contains a data supplement.

![Representative turbidimetric clotting profiles. (A) Clotting profiles of purified fibrin (3 mg/mL) with increasing concentrations of rM1 (0-60 μg/mL) (n = 4). Maximum absorbance parameters extracted from the turbidity clotting profiles in (B) plasma and (C) purified conditions (n = 4). (D) Clotting time was analyzed using a thrombin time assay with a micro-mechanical clot detection KC4 coagulometer in varying concentrations of rM1 (0-60 μg/mL). The dotted lines represent the baseline (absence of M1) condition (n = 4). Error bars represent standard error of the mean (∗P < .05, ∗∗P < .01, ∗∗∗P < .001, ∗∗∗∗P < .0001, 1-way analysis of variance [ANOVA] with Dunnett post hoc test).](https://ash.silverchair-cdn.com/ash/content_public/journal/bloodvth/2/4/10.1016_j.bvth.2025.100094/2/m_bvth_vth-2025-000327-gr1.jpeg?Expires=1768612907&Signature=Exejzp2843F5W4TZQlMsE6b-8T6YphP3oNxyaWBVL2CBp~rfLEtFBchHBWIItVB2T32c9GGoVRE8s3Opc6-zKlUwsi8lWxvkgGrCnvTKM7LH5TAC9ReywvgjKyk51~8-9j1M5gyg8qZ9JJdHJcUQA19lOUOmY6j4P030pLjrgyDOggNez2bSK4NPnNRn6k5FhXRfNR~vihMt4CxEIpdsVOEwCLj4zN508hHStfPloOeKVSTX~OcjRHvpKXurstSuQxhM1p85JJPIZ8DFeB7h0K27Wi6kMWQp2WP7CVYwzDvH7DzL44v1rJQtOoIZCQaPgtbeoPsbyRCbO98KTLpKzg__&Key-Pair-Id=APKAIE5G5CRDK6RD3PGA)

![Representative turbidimetric clotting profiles. (A) Clotting profiles of purified fibrin (3 mg/mL) with increasing concentrations of rM1 (0-60 μg/mL) (n = 4). Maximum absorbance parameters extracted from the turbidity clotting profiles in (B) plasma and (C) purified conditions (n = 4). (D) Clotting time was analyzed using a thrombin time assay with a micro-mechanical clot detection KC4 coagulometer in varying concentrations of rM1 (0-60 μg/mL). The dotted lines represent the baseline (absence of M1) condition (n = 4). Error bars represent standard error of the mean (∗P < .05, ∗∗P < .01, ∗∗∗P < .001, ∗∗∗∗P < .0001, 1-way analysis of variance [ANOVA] with Dunnett post hoc test).](https://ash.silverchair-cdn.com/ash/content_public/journal/bloodvth/2/4/10.1016_j.bvth.2025.100094/2/m_bvth_vth-2025-000327-gr1.jpeg?Expires=1768656096&Signature=bSRDcx2GyHAg~8t2a0wYFMs-NnphXNuNOLte2MBZR5sJ-edToV4kWv8AdhfxnvIHacMN0KXVi8HyuG4zkiwvVf1MCbc2oATr4qv15SRmx9wdHi2t9Uqi8sVT17cruhBop2LGmbnQYRiUa6NLlQo3vi90c4bqJq0s5hLaihiaAFOaQbqZssg0pTAntGCqkMP3~mGvajYa5FhcOAU9ZB3tUrEyg2fZrpwrzteKFA2Ntd8WsSAMD7I2Khwp5bzOjvb-h6K6MZofxeLLmOO2rQg81iMQZ5sg8CuA0PaqL7iVNu43jNJy1bQttX7mK87iydYTnYHxl7tJzy1APOr~mk5hfQ__&Key-Pair-Id=APKAIE5G5CRDK6RD3PGA)
