Key Points
The in vitro cytoprotective, PAR1-dependent cell signaling by APC requires β-arrestin 2.
The in vivo neuroprotective action of APC requires β-arrestin 2.
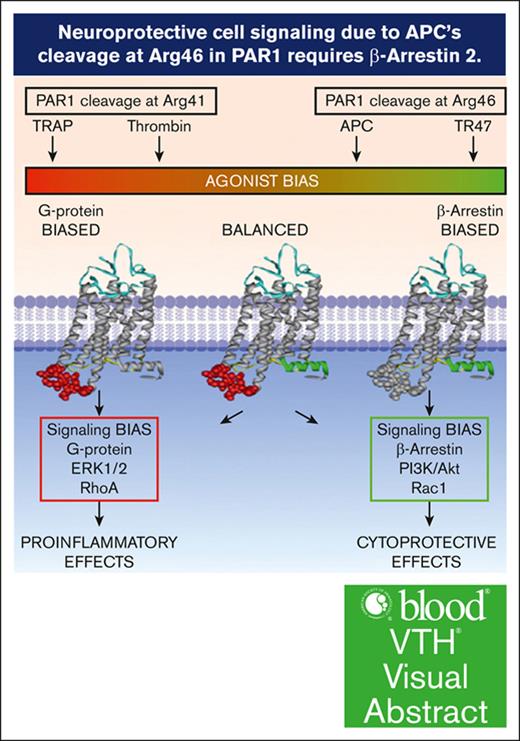
Visual Abstract
The protease activated protein C (APC) and its variants provide neuroprotection for murine ischemic stroke and mortality reduction for murine sepsis. For these actions, APC’s in vivo mechanism of action, similar to in vitro studies using cultured cells, involves protease activated receptor 1 (PAR1)–mediated biased signaling. APC/PAR1 signaling in vitro requires β-arrestin 2, an intracellular scaffold protein, and β-arrestin 2–initiated signaling can alter diverse intracellular signaling pathways. This study used a proximal transient middle cerebral artery occlusion model to study the neuroprotective actions of the signaling-selective APC variant, 3K3A-APC, in β-arrestin 2–deficient (Arrb2–/–) mice. Based on quantitation of brain injuries, 3K3A-APC significantly limited brain injury in control mice to relatively small, localized areas, whereas 3K3A-APC’s protection was lost in Arrb2–/– mice. Thus, the major in vitro mechanism of action that requires β-arrestin 2 for APC/PAR1 biased signaling is central to the in vivo mechanism of action for APC’s neuroprotection.
Introduction
The serine protease, activated protein C (APC), exerts 2 distinct types of activities: (1) anticoagulant activity and (2) cytoprotective activities, including endothelial barrier stabilization and antiapoptotic and anti-inflammatory activities.1-4 For the primary mechanism of action for cytoprotective actions, a primary role for cleavage of protease activated receptor 1 (PAR1) to initiate G protein–coupled receptor biased signaling was demonstrated.2,3,5 β-arrestin 2, a multifunctional intracellular scaffold protein, is required for APC’s biased PAR1-dependent signaling.6,7 Remarkably, for APC/PAR1 signaling, β-arrestin 2 can mediate multiple distinct signaling responses using different effectors to achieve APC’s cytoprotective effects, and phosphoproteome analysis revealed that a wide variety of intracellular proteins and pathways can be altered by APC-initiated signaling.8-10 Although detailed in vitro mechanistic studies are highly informative, it is intrinsically unclear whether in vitro studies using cultured cells can be extrapolated to in vivo mechanisms. In studies of a murine stroke model that used proximal transient middle cerebral artery occlusion (tMCAo), the neuroprotective actions of the signaling-selective APC variant, 3K3A-APC, were shown to require cleavage at Arg46 in PAR1, that is, a cleavage known to mediate APC’s in vivo biased PAR1 signaling.11 This in vivo proof of concept for APC’s PAR1-dependent biased signaling validated extensive in vitro data as indicative of APC’s in vivo mechanism of action. Here, we used a murine tMCAo stroke model and β-arrestin 2–deficient (Arrb2–/–) mice to provide in vivo evidence that APC’s neuroprotective actions require β-arrestin 2.
Study design
Materials
Murine recombinant 3K3A-APC was prepared as described previously.12
Animals
All procedures were approved by the Institutional Animal Care and Use Committee at the University of Southern California with National Institutes of Health guidelines. Three-month-old male C57BL/6J wild-type control mice and β-arrestin 2–deficient (Arrb2–/–) mice on C57BL/6J genetic background (strain number 023852) were obtained from The Jackson Laboratory (Bar Harbor, ME). To induce stroke, all mice underwent proximal tMCAo. Mice were then treated with either vehicle or 3K3A-APC. To evaluate postischemic brain injury, magnetic resonance (MR) brain imaging was performed 24 hours after stroke. Mice were euthanized after MR scanning, and brains were removed and frozen on dry ice and kept at –80°C until use. See Figure 1 for the study design.
Time course for experimental stroke and 3K3A-APC treatment. Mice were subjected to proximal tMCAo for 45 minutes starting at 0 minutes, as described elsewhere.13 Mice were treated with either vehicle or recombinant murine 3K3A-APC (0.8 mg/kg) intraperitoneally at 10 minutes and at 4 hours after the initiation of tMCAo. In vivo MR imaging (MRI) was performed 24 hours after tMCAo initiation. MRI was then followed by tissue collection and analysis.
Time course for experimental stroke and 3K3A-APC treatment. Mice were subjected to proximal tMCAo for 45 minutes starting at 0 minutes, as described elsewhere.13 Mice were treated with either vehicle or recombinant murine 3K3A-APC (0.8 mg/kg) intraperitoneally at 10 minutes and at 4 hours after the initiation of tMCAo. In vivo MR imaging (MRI) was performed 24 hours after tMCAo initiation. MRI was then followed by tissue collection and analysis.
One mouse among controls, 2 mice from the Arrb2–/– vehicle-treated groups, and 1 mouse from the Arrb2–/– group treated with 3K3A-APC died after MR imaging. Brains from these animals were not harvested or used for tissue analysis.
Proximal tMCAo and 3K3A-APC treatment
Mice were anesthetized intraperitoneally with 100 mg ketamine/10 mg xylazine per kilogram body weight. Rectal temperature was maintained between 36.5 and 37.0°C during the procedure using a feedback-controlled heating system (Harvard Apparatus). The middle cerebral artery was occluded for 45 minutes using a silicon-coated nylon monofilament (Doccol Co) as described.13 3K3A-APC (0.8 mg/kg) or vehicle were administered intraperitoneally 10 minutes and 4 hours after tMCAo initiation (Figure 1). At 24 hours after tMCAo, mice were anesthetized and euthanized under 5% isoflurane, followed by transcardial perfusion with phosphate-buffered saline containing 5 mM EDTA. Brains were then removed, flash frozen over dry ice, and stored at –80°C.
MR imaging
In vivo MR imaging was performed using a cryogen-free 7T MR scanner (MR Solutions) at 24 hours after tMCAo. Mice were anesthetized using 1.5% isoflurane/air, and the isoflurane level was adjusted between 0.5% and 1.5% to maintain a stable respiration rate above 60 breaths per minute. T2-weighted fast spin echo sequence covering the whole mouse brain (repetition time and time to echo, 4900/45 millisecond; 2 averages; field of view, 18 × 18 × 17 mm; matrix size, 238 × 256; voxel size, 0.0756 × 0.0703 × 0.5 mm) was collected in vivo to determine the injury volume, infarct volume, and edema volume. Images are presented in the same orientation as those of cresyl violet histological staining.
Calculations of postischemic lesions
Postischemic injury lesions were measured using Fiji software (Fiji/ImageJ, version 2.1.0/1.53c). On each MR image, the ischemic area was visually identified and defined by hyperintense signals with respect to healthy brain tissue.14-18 The identified injury area was manually delineated using the freehand polygon tool. The injury volume was calculated by multiplying the number of voxels in the injury volume by the size of each voxel. The edema volume (tissue swelling) was calculated by subtracting the volume of the contralateral nonischemic hemisphere from the volume of the ipsilateral ischemic hemisphere.19 The infarction volume was obtained by subtracting the edema volume from the injury volume.19
Cresyl violet staining
Coronal 20-μm brain sections were cut on a cryostat (Leica CM3050S). Sections from 5 equidistant rostrocaudal brain levels, at –1.4, –0.6, +0.2, +1.0, and +1.8 mm from the bregma, were evaluated. Sections were fixed with 100% methanol for 10 minutes and dried for 30 minutes before staining with FD Cresyl Violet Solution (FD Neurotechnologies, Inc; catalog no. PS102-2). Sections were imaged using a Keyence BZ-9000 microscope at ×20 magnification, and individual images were stitched with accompanying Keyence software to generate images of full tissue sections.
Incidence and topography of injury area
For each mouse, a binary mask of the ischemic injury area was generated based on cresyl violet images at the level of optic chiasm using ImageJ Fiji software. The binary masks were then used to generate a topographic injury map of the brain by calculating the percentage of animals in each group showing injury on a pixel-by-pixel basis and superimposing the map onto a mouse brain atlas.
Statistics
GraphPad Prism 8.0 was used for statistical analysis calculations. No outliers were identified using Prism's Robust Regression and Outlier Removal (ROUT) method with the maximum false discovery rate (Q) of 1%. One-way analyses of variance followed by Tukey multiple comparison test was performed for injury volume, edema volume, and infarct volume measurements. The assumption of normality was tested by Kolmogorov-Smirnov tests and by inspecting residuals with quintile-quintile (QQ) plots. P values <.05 indicated significance. Data are shown as dot plots representing single points per mouse. Bar graphs represent mean ± standard error of the mean.
Results and discussion
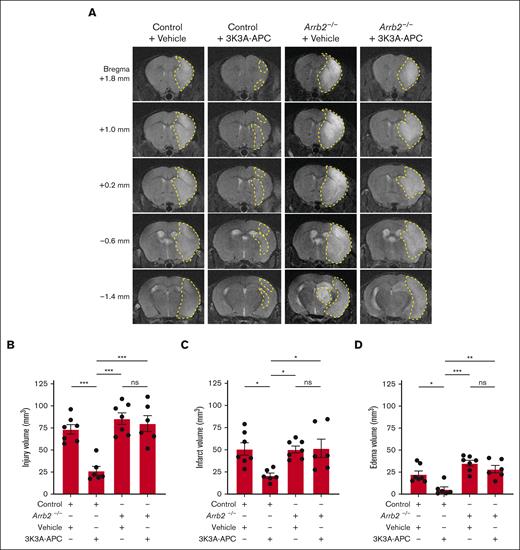
Treatment with 3K3A-APC substantially reduced postischemic injury in normal control mice 24 hours after tMCAo, as shown by significant reductions in the hyperintense signals on T2-weighted structural MR images on all studied MR sections, ranging from +1.8 mm to –1.4 mm from the bregma (Figure 2A). Vehicle-treated Arrb2–/– mice developed similar postischemic injury in all the studied levels from the bregma as control mice treated with vehicle, showing that β-arrestin 2 deficiency20 did not significantly alter the neuropathology of tMCAo. However, the protective effect of 3K3A-APC was lost in Arrb2–/– mice that developed brain damage after stroke similar to control and Arrb2–/– mice treated with vehicle (Figure 2A). Quantification analyses for control mice compared with 3K3A-APC–treated mice indicated that 3K3A-APC relative to vehicle significantly reduced the injury, infarct, and edema volumes by 64%, 59%, and 76%, respectively (Figure 2B-D). However, 3K3A-APC treatment had no significant effect on injury, infarct, and edema volumes in Arrb2–/– mice that developed comparable damage as control mice treated with vehicle (Figure 2B-D).
3K3A-APC protection against ischemic stroke in vivo requires β-arrestin 2. (A) Representative T2-weighted (structural) coronal MR scans showing postischemic injury area (hyperintense signal) in the ipsilateral cortex 24 hours after tMCAo in control and Arrb2–/– mice on C57BL/6J genetic background treated with vehicle or 3K3A-APC (0.8 mg/kg intraperitoneally 10 minutes and 4 hours after the start of tMCAo). Postischemic injury areas are delineated by yellow dashed lines. (B-D) Injury (B), infarct (C), and edema volumes (D) 24 hours after tMCAo in control and Arrb2–/– mice treated with vehicle or 3K3A-APC as above in panel A. Control + vehicle (n = 7); Control + 3K3A-APC (n = 6); Arrb2–/– + vehicle (n = 7); and Arrb2–/– + 3K3A-APC (n = 6). All volume measurements derived from structural T2-weighted MR images. Data in panels B-D are shown as dot plots representing single points per mouse. Each bar represents mean ± standard error of the mean. Statistical significance was determined by 1-way analyses of variance followed by Tukey multiple comparison test. ∗P < .05; ∗∗P < .01; ∗∗∗P < .001. ns, nonsignificant. The panels B-D in Figure 2 were modified to have the same y-axes, but the data are the same as originally submitted.
3K3A-APC protection against ischemic stroke in vivo requires β-arrestin 2. (A) Representative T2-weighted (structural) coronal MR scans showing postischemic injury area (hyperintense signal) in the ipsilateral cortex 24 hours after tMCAo in control and Arrb2–/– mice on C57BL/6J genetic background treated with vehicle or 3K3A-APC (0.8 mg/kg intraperitoneally 10 minutes and 4 hours after the start of tMCAo). Postischemic injury areas are delineated by yellow dashed lines. (B-D) Injury (B), infarct (C), and edema volumes (D) 24 hours after tMCAo in control and Arrb2–/– mice treated with vehicle or 3K3A-APC as above in panel A. Control + vehicle (n = 7); Control + 3K3A-APC (n = 6); Arrb2–/– + vehicle (n = 7); and Arrb2–/– + 3K3A-APC (n = 6). All volume measurements derived from structural T2-weighted MR images. Data in panels B-D are shown as dot plots representing single points per mouse. Each bar represents mean ± standard error of the mean. Statistical significance was determined by 1-way analyses of variance followed by Tukey multiple comparison test. ∗P < .05; ∗∗P < .01; ∗∗∗P < .001. ns, nonsignificant. The panels B-D in Figure 2 were modified to have the same y-axes, but the data are the same as originally submitted.
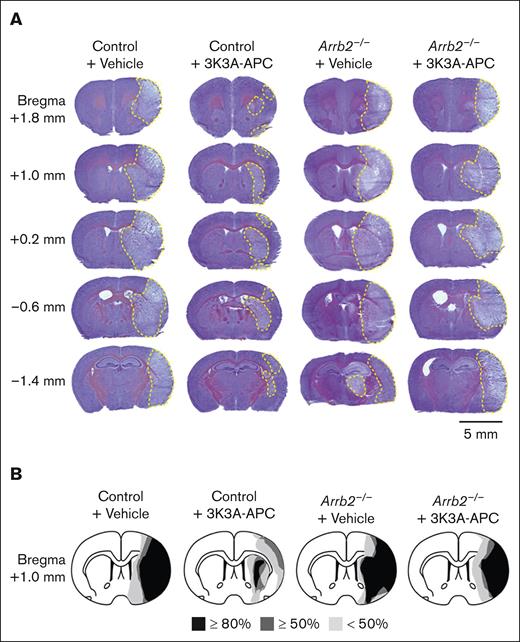
Cresyl violet images taken from the same locations relative to the bregma as MR scans confirmed in vivo MR observations, showing substantially reduced injury at all different levels in 3K3A-APC–treated control mice and the loss of 3K3A-APC protection in Arrb2–/– mice (Figure 3A). Notably, the size and shape of injury areas were similar in vehicle-treated control and Arrb2–/– mice and in 3K3A-APC–treated Arrb2–/– mice (Figure 3A).
3K3A-APC reduces postischemic injury areas in control mice but not in Arrb2–/– mice. (A) Representative images of cresyl violet staining of brain sections 24 hours after tMCAo from control and Arrb2–/– mice on a C57BL/6J genetic background treated with vehicle or 3K3A-APC as in Figure 1. Injury areas are delineated by yellow dashed lines. Mice used for representative images in panel A are the same as in Figure 2A. The tissue sections for cresyl violet staining were taken from the same locations relative to the bregma as for T2-weighted MR scans in Figure 2; scale bar, 5 mm. (B) Incidence and topography of injury area at the level of optic chiasm (ie, image for the bregma +1.0 mm) in control mice and Arrb2–/– mice treated with vehicle or 3K3A-APC. Control + vehicle (n = 6); control + 3K3A-APC (n = 6); Arrb2–/– + vehicle (n = 5); Arrb2–/– + 3K3A-APC (n = 5).
3K3A-APC reduces postischemic injury areas in control mice but not in Arrb2–/– mice. (A) Representative images of cresyl violet staining of brain sections 24 hours after tMCAo from control and Arrb2–/– mice on a C57BL/6J genetic background treated with vehicle or 3K3A-APC as in Figure 1. Injury areas are delineated by yellow dashed lines. Mice used for representative images in panel A are the same as in Figure 2A. The tissue sections for cresyl violet staining were taken from the same locations relative to the bregma as for T2-weighted MR scans in Figure 2; scale bar, 5 mm. (B) Incidence and topography of injury area at the level of optic chiasm (ie, image for the bregma +1.0 mm) in control mice and Arrb2–/– mice treated with vehicle or 3K3A-APC. Control + vehicle (n = 6); control + 3K3A-APC (n = 6); Arrb2–/– + vehicle (n = 5); Arrb2–/– + 3K3A-APC (n = 5).
Most control vehicle-treated mice (>80%) developed significant injury in the ipsilateral cortex and lateral striatum (Figure 3B). More than 50% of these mice exhibited changes in the medial striatum and dorsomedial cortex, whereas <50% had changes in the medial striatum and ventromedial cortex. 3K3A-APC limited brain injury in control mice to a relatively small, localized area in the lateral striatum, and it significantly reduced injury in other brain regions (Figure 3B). However, these protective effects of 3K3A-APC were lost in Arrb2–/– mice. In >80% of 3K3A-APC–treated Arrb2–/– mice, injury developed in both the ipsilateral cortex and other regions, similar to control and Arrb2–/– mice treated with vehicle.
These data indicate that the in vivo mechanism of action for APC’s neuroprotection mirrors APC’s in vitro requirement for β-arrestin 2 for APC’s PAR1-dependent cytoprotective biased signaling.6-10 β-arrestin 2 is a commonly expressed intracellular scaffold protein that is capable of influencing signaling via a diverse number of signaling pathways.21 As noted above for APC-initiated in vitro signaling, β-arrestin 2 can mediate multiple distinct signaling responses in endothelial cells.8,9 The new findings here can help understand multiple potential β-arrestin 2–dependent mechanisms for pathways that mediate APC’s in vivo neuroprotective effects that may involve multiple distinct PAR1/β-arrestin 2–dependent signalosomes.22 Given the remarkably wide array of APC’s in vivo benefits in diverse murine injury models,1-5 extensive future studies are needed to clarify which signaling pathways mediate the APC/PAR1 in vitro and in vivo cytoprotective activities in different cell types and in different organs.
Acknowledgments
This research was supported by National Institute of Neurological Disorders and Stroke grant R01NS117827 (B.V.Z. and W.J.M.) and National Heart Lung and Blood Institute grant R01HL142975 (J.H.G.) from the National Institutes of Health.
Authorship
Contribution: B.X., Y.W., B.V.Z., W.J.M., and J.H.G. designed the study; B.X., Y.W., R.R., K.K., and J.A.F. performed experiments and contributed to data analysis; B.X., Y.W., W.J.M., B.V.Z., and J.H.G. wrote the manuscript; and all authors read and approved the version of the submitted manuscript.
Conflict-of-interest disclosure: J.H.G. is a coinventor for Scripps-owned patents related to some studies in this report. B.V.Z. is the scientific cofounder of ZZ Biotech LLC. B.V.Z. and J.H.G. are on the scientific advisory board of ZZ Biotech LLC. The remaining authors declare no competing financial interests.
Correspondence: Berislav V. Zlokovic, Department of Physiology and Neuroscience, Keck School of Medicine, University of Southern California, 1591 San Pablo St, Los Angeles, CA 90089; email: berislav.zlokovic@med.usc.edu; and John H. Griffin, Department of Molecular Medicine, Scripps Research Institute, 10550 N Torrey Pines Rd, IMM316, La Jolla, CA 92037; email: jgriffin@scripps.edu.
References
Author notes
B.X. and Y.W. contributed equally to this study.
B.V.Z. and J.H.G. are joint senior authors.
Raw uncropped magnetic resonance imaging data (884 images) for all 26 animals and uncropped representative images used in Figure 2 with slice ID numbers are available from the Zenodo.org data repository (https://doi.org/10.5281/zenodo.13138754).


