We have investigated the expression of interleukin-3 receptor α (IL-3Rα) chain in primary blasts from 79 patients with acute myeloid leukemia (AML), 25 patients with B-acute lymphoid leukemia (B-ALL), and 7 patients with T-acute lymphoid leukemia (T-ALL) to evaluate a linkage between the expression of this receptor chain, blast proliferative status, and disease prognosis. Although IL-3Rα chain was scarcely expressed in most patients with T-ALL, it was overexpressed in 40% and 45% of patients with B-ALL and AML, respectively, compared with the levels observed in normal CD34+ progenitors. The biological and clinical significance of this overexpression pattern was investigated in AML. At the biological level, elevated IL-3Rα expression was associated with peculiar properties of leukemic blasts, specifically in 3 areas. First, in all patients the blasts expressing elevated IL-3Rα levels exhibited higher cycling activity and increased resistance to apoptosis triggered by growth factor deprivation. Second, spontaneous signal transducer and activator of transcription 5 (Stat5) phosphorylation was observed in 13% of AML patients, all pertaining to the group of patients exhibiting high IL-3Rα expression. Third, following IL-3 treatment, Stat5 was activated at higher levels in blasts with elevated IL-3Rα expression. At the clinical level, a significant correlation was observed between the level of IL-3Rα expression and the number of leukemic blasts at diagnosis, and patients exhibiting elevated IL-3Rα levels had a lower complete remission rate and survival duration than those showing normal IL-3Rα levels. These findings suggest that in AML, deregulated expression of IL-3Rα may contribute to the proliferative advantage of the leukemic blasts and, hence, to a poor prognosis.
Introduction
Blood cells are derived from a small number of pluripotent hemopoietic stem cells (HSCs) endowed with the capacity to self-renew and to differentiate into hemopoietic progenitor cells (HPCs) progressively committed to proceed along one of the maturation pathways.1 Survival, growth, and differentiation of HPCs are, at least in part, regulated by a network of hematopoietic growth factors (HGFs) called colony-stimulating factors (CSFs) or interleukins (ILs).
Acute leukemias are characterized by an arrest of cell maturation and the accumulation of undifferentiated cells in marrow, blood, and other tissues.2 As observed in normal hematopoiesis, most leukemic cells descend from a relatively small pool of progenitor cells with high proliferative activity. In line with this hypothesis, recent studies have shown that acute myeloid leukemia (AML) cells with the membrane phenotype CD34+Thy-1−,3CD34+CD38−,4 or CD34+CD71−HLA-DR−5 are capable of engrafting immunodeficient mice.
Acute leukemia cells have usually retained responsiveness to HGF stimulation in the promotion of cell survival and cell proliferation; however, leukemic cells show little maturation under stimulation with HGFs.6 More particularly, recombinant IL-3 and granulocyte macrophage–CSF (GM-CSF) induce leukemic colonies and activate DNA synthesis in more than 80% of AMLs.7-10 No clear relationship between IL-3 and GM-CSF responses and the French-American-British (FAB) classification of acute leukemias was observed.6 Furthermore, leukemic cells may produce one or more of the principal HGFs, including IL-3 and GM-CSF.11 12 Thus, the concomitant expression of receptors for IL-3 and GM-CSF and the production of the respective ligands by leukemic cells determine the formation of complete autocrine circuits of HGF stimulation. According to these observations, it was suggested that autonomous mechanisms of growth contribute to the clinical biology of leukemia.
IL-3 and GM-CSF exert their biological activities through interaction with cell surface receptors that consist of 2 subunits, the α subunit specific to each and the β common chain (βc).13,14 The α chain (IL-3Rα, GM-CSFRα) binds IL-3 and GM-CSF, respectively, with high specificity but with low affinity.15 The interaction of an α chain with a β chain leads to the formation of a high-affinity receptor complex able to bind the respective ligand in the range of its physiological concentrations and to transduce proliferative, antiapoptotic, and differentiative signals.15-17 The βc expressed alone, in the absence of a specific α chain, confers little binding affinity for either IL-3 or GM-CSF.18 19
Studies on AML blasts have shown that receptors for IL-3 and GM-CSF are often coexpressed on these cells.20-22 Furthermore, specific IL-3 binding was observed in approximately 50% of B-ALL.23 Finally, a recent study showed that IL-3Rα chain was overexpressed in CD34+CD38− AML blasts compared with the expression of this receptor chain observed in the corresponding normal counterpart.24
Other studies have shown that in a significant proportion of myeloid and lymphoid acute leukemias, transducers of the signal originated from IL-3R/GM-CSFR, such as Janus kinase 2 (JAK2) and signal transducer and activator of transcription (Stat5), are constitutively activated.25,26 On the other hand, studies carried out on IL-3–dependent cell lines have shown that the overexpression of IL-3Rα chains leads to cell proliferation in the presence of suboptimal IL-3 concentrations or in the absence of growth factors.27
According to the ensemble of these observations, it seemed of interest to investigate the pattern and the level of IL-3Rα chain expression in acute leukemias, particularly in view of evaluating a possible linkage between the level of this receptor chain and the proliferative status of leukemic blasts. Our findings support the hypothesis that a deregulated expression of IL-3Rα may contribute to the proliferative advantage of leukemic blasts. Indeed, the level of IL-3Rα chain expression directly correlates with the number of leukemic blasts present in the blood at diagnosis and is a negative prognostic factor.
Materials and methods
Cells
Fresh leukemic blasts from 79 patients with AML, 25 patients with B-ALL, and 7 patients with T-ALL, obtained after informed consent, were isolated from either bone marrow or peripheral blood by Ficoll-Hypaque density-gradient centrifugation and were immediately processed. All these patients had newly diagnosed leukemia consecutively observed at the Department of Cellular Biotechnology and Hematology of the University La Sapienza (Rome, Italy). Leukemias were classified by morphologic criteria according to FAB classification and contained more than 80% leukemic blasts. Acute leukemia subtypes were classified according to standard cytochemical criteria and membrane antigen analysis using specific monoclonal antibodies. Peripheral blood was obtained from healthy adult donors after informed consent was given. HPCs were purified as reported28 and modified.29 30 Approval was obtained from the institutional review board at the Department of Cellular Biotechnology, University La Sapienza (Rome, Italy) for these studies. Informed consent was provided according to the Declaration of Helsinki.
Cell culture
In some experiments, leukemic blasts or purified HPCs were grown in vitro in Iscove modified Dulbecco medium containing 20% fetal calf serum (FCS) in the absence or in the presence of recombinant human IL-3 (1 or 100 U/mL). IL-3 and GM-CSF were obtained from Genetics Institute (Cambridge, MA).
TF-1 cells were grown in RPMI 1640 medium supplemented with 10% FCS and 10 ng/mL GM-CSF. In some experiments TF1 cells were deprived for 24 hours of GM-CSF and then exposed for short periods of time either to IL-3 (100 U/mL) or to GM-CSF (10 ng/mL).
Analysis of cell surface antigens
Analysis of cell surface antigens was performed by flow cytometry using a FACScan Flow Cytometer (Becton Dickinson, Bedford, MA). The following antibodies to membrane antigens were used: anti-CD3, -CD7, -CD11a, -CD11b, -CD11c, -CD14, -CD18, -CD19, -CD20, -CD21, -CD22, -CD33, -CD34, -CD38, -CD41, -CD61, -CD71, -CD90, -CD117, glycophorin A, and HLA-DR. Cells were labeled with these antibodies and were analyzed as previously reported.31
Hematopoietic growth factor receptor expression
Phycoerythrin (PE)-labeled anti–IL-3R α chain monoclonal antibody (mAb) clone 9G532 was purchased from PharMingen (San Diego, CA); PE-labeled anti–c-kit and anti–M-CSFRα chain mAbs were obtained from Immunotech (Marseilles, France); and purified anti–c-fms, clone 3-4A433 and anti–IL-3R/GM-CSFR βc (clone 5-16) were purchased from Santa Cruz Biotechnology (Santa Cruz, CA). Cells were incubated with optimal concentrations of the antibodies and were processed for flow cytometry analysis as described above.
For G-CSF receptor analysis, cells were incubated for 60 minutes at 4°C with PE-labeled G-CSF, washed, and analyzed by flow cytometry. All controls necessary to verify the specificity of each of these reagents are reported.34
Cell sorting
Leukemic blasts stained with PE-labeled anti–IL-3Rα antibody were sorted according to fluorescence intensity into IL-3Rαdim and IL-3Rαbright fractions using a FACS Vantage (Becton Dickinson).
IL-3 binding and internalization assays
Binding reactions were performed in 25-mm × 75-mm polypropylene tubes in RPMI 1640 containing 0.1% bovine serum albumin (BSA, Fraction V; Sigma, Milan, Italy). Cell concentrations were 10 × 106 cells/mL. Cells were incubated for 60 minutes at 4°C in the presence of 20 ng/mL sodium iodide I 125 IL-3 (125I–IL-3; Amersham Italia, Milan, Italy). Unbound ligand was removed by centrifugation of the cells through a density cushion, as described previously.35After incubation, 200-μL aliquots of the cell suspension were layered over 150 μL dibutyl phthalate and dinonyl phtalate (Merck, Darmstadt, Germany) mixture, to a final density to 1.0125, in 400-μL plastic microcentrifuge tubes and were centrifuged in an Eppendorf (Milan, Italy) microcentrifuge (10 000g for 2 minutes). At the end of centrifugation, the supernatant and most of the dibutyl phtalate cushion were aspirated. Vial tips containing the cell pellet were then cut off with a scalpel and were transferred to plastic vials, and radioactivity was measured in a γ counter. Total binding corresponded to the radioactivity in the cell pellet when cells were incubated with 125I–IL-3 alone. Nonspecific binding was represented by the radioactivity bound to the cells in the presence of radioactive IL-3 (20 ng/mL) and cold IL-3 (20 μg/mL). Specific binding was the difference between total and nonspecific binding.
IL-3 internalization on intact cells was evaluated as described previously.36 Cells were incubated for 90 minutes at 4°C in RPMI 1640 medium with 10 ng/mL 125I–IL-3, rinsed twice at 4°C in phosphate-buffered saline (PBS), and incubated in RPMI 1640 medium at 37°C. At different times, aliquots of cells were removed and processed as follows: (1) cells were first centrifuged (2 minutes, 3000 rpm, 4°C), and the radioactivity present in the supernatant was counted; (2) cell pellet was incubated for 2 minutes at 4°C with saline acid solution (pH 3), a procedure that allows detachment of surface-bound IL-336; and (3) cells were then centrifuged, and the radioactivity present in the supernatant and cell pellet was counted in a γ counter.
Evaluation of apoptosis
Apoptosis of leukemic cells was evaluated by double staining with fluorescein isothiocyanate (FITC)–labeled annexin V and propidium iodide (PI).37 Briefly, 2 × 10⁴ cells were washed twice in cold PBS and were resuspended in 0.25 mL binding buffer (HEPES [N-2-hydroxyethylpiperazine-N′-2-ethanesulfonic acid]-buffered saline solution supplemented with 0.25 mM CaCl2). Five microliters FITC–annexin V and 5 μL PI reagents were added to the cells, and the mixtures were gently vortexed and incubated for 15 minutes at room temperature in the dark. Within 1 hour, cells were analyzed at 488 nm in a FACS Sort Cytometer (Becton Dickinson).
Cell-cycle analysis
Cell-cycle analysis was carried out on nuclei stained with PI, as described.38 Briefly, the cells were first washed in Ca++- and Mg2+-free PBS and were fixed overnight in cold 90% ethanol; after 3 washings, the cells were resuspended in PBS containing 1% BSA, 50 μg/mL PI, and 1 mg/mL boiled ribonuclease A (RNase A; Sigma). Cells were then analyzed by flow cytometry using a FACS scan equipped with software for cell-cycle analysis.
Western blotting
Cell samples were lysed at a concentration of approximately 1 × 10⁷ cells/mL in cell lysis buffer (20 mM HEPES, pH 7.20, 50 mM NaCl, 10 mM EDTA [ethylenediaminetetraacetic acid], 2 mM EGTA [ethyleneglycoltetraacetic acid], 0.5% nonidet P-40 [NP40], 0.5 mM phenylmethylsulfonyl fluoride [PMSF], 10 μg/mL, 0.5 mM dithiothreitol [DTT], 10 mM Na2MoO4 · H2O, 10 mM Na3VO4, 100 mM NaF), incubated for 20 minutes on ice, and centrifuged at 10 000 rpm for 10 minutes to remove cell debris. The resultant protein lysate was then aliquoted and stored at −80°C until analysis. For immunoblot analysis, lysates were first adjusted to contain equal amounts of proteins (4 μg total proteins), using the Bradford assay and were then boiled for 5 minutes in an equal volume of sodium dodecyl sulfate (SDS) sample buffer before loading on a 7.5% SDS polyacrylamide gel. Proteins were then transferred onto a nitrocellulose membrane (Amersham Life Sciences, Arlington Heights, IL). Filters were blocked with 5% low-fat milk and incubated overnight with antibodies against human Stat5 or phosphorylated Stat5 A/B (Upstate Biotechnology, Lake Placid, NY) diluted 1:1000 (1 μg/mL final concentration). Western blots were developed using horseradish peroxidase–conjugated secondary antibody—goat antirabbit or antimouse immunoglobulin (1:3000 dilution; Bio-Rad, Hercules, CA) and enhanced chemiluminescence (Amersham) according to the manufacturer's protocol.
DNA electrophoretic mobility shift assay
Electrophoretic mobility shift assay (EMSA) experiments were performed on total cell extracts, as previously described.39 Where indicated, 1 μL anti–Stat5a-b (Santa Cruz Biotechnology) was added to 20 μg cell extract in the reaction mixture. Analysis of DNA-protein complexes was carried out on 6% polyacrylamide gels with 0.5× TBE (1× TBE is 50 mM Tris-borate [pH 8.2], 1 M EDTA), as previously described.39 The oligonucleotide probe used was β casein Stat binding element (SBE) 5′-AGATTTCTAGGAATTCAATCC-3′.
RT-PCR analysis of IL-3Rα chain mRNA
Clinical outcome
Response to therapy was evaluated in 34 AML patients receiving intensive chemotherapy; patients with acute promyelocytic leukemia (APL) and elderly patients with AML who received only palliative or supportive therapy were not included in this analysis. Intensive therapy consisted of an induction phase with anthracycline and cytarabine with or without etoposide, followed by one cycle of consolidation using the same drugs and, in patients younger than 60 years, by autologous or allogeneic bone marrow transplantation.
Statistical analysis
Patient characteristics and complete remission rates were compared using the χ2 analysis. Overall survival time was calculated from the rate of diagnosis until death or last follow-up examinations. Survival curves were estimated using the product-limit method of Kaplan-Meier and were compared using the log-rank square test.
Results
IL-3Rα and -β expression in acute leukemias
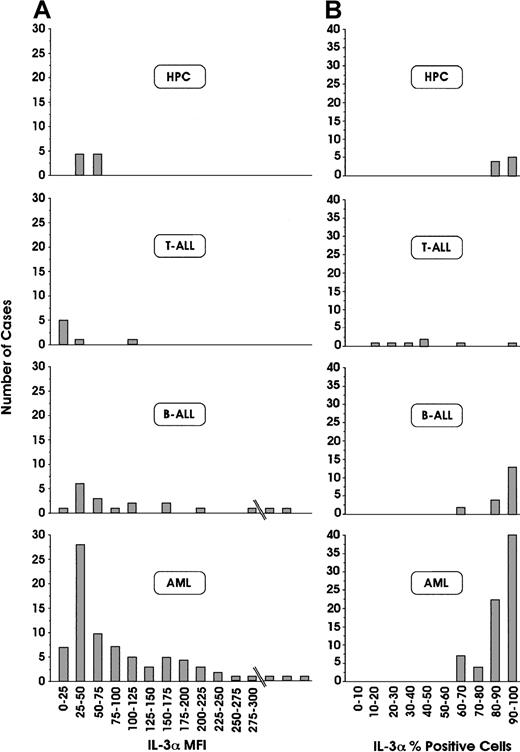
We have investigated the expression of IL-3Rα and βc chain expression in leukemic blasts derived from 111 patients with acute leukemia, classified according to FAB and immunophenotypic criteria (79 AML, 25 B-ALL, and 7 T-ALL). Among 79 patients with AML, IL-3Rα chain was constantly expressed on more than 60% of leukemic blasts (Figure1). In acute lymphoid leukemias, a more heterogeneous situation is found—in all patients with B-ALL, IL-3Rα chain was expressed, whereas in most patients with T-ALL, this receptor chain was only scarcely expressed (Figure 1). Analysis of the fluorescence intensity labeling of IL-3Rα chain provided some interesting findings (Figure 1): (1) normal HPCs exhibited positivity ranging from 50 to 70 (data expressed in arbitrary units of fluorescence intensity); (2) approximately 46% of patients with AML exhibited fluorescence intensity values significantly higher than those of normal HPCs, and the remaining patients had values in the range of healthy controls; (3) approximately 40% of patients with B-ALL had fluorescence intensity values distinctly higher than those observed for normal HPCs. Among AML patients, the frequency of occurrence of different leukemia subtypes (M0 to M7) was similar in the group of patients with normal IL-3Rα fluorescence intensity values (up to 100) compared with those with high IL-3Rα fluorescence intensity values (more than 100) (data not shown).
Flow cytometric analyses of IL-3Rα chain.
Percentages of positive cells (A) and mean fluorescence intensity (MFI; B), in leukemic blasts derived from 79 patients with AML, 25 patients with B-ALL, and 7 patients with T-ALL, and from normal HPCs. Results are expressed in terms of the number of patients displaying a given range of expression of IL-Rα, either as a percentage of positive cells or of MFI.
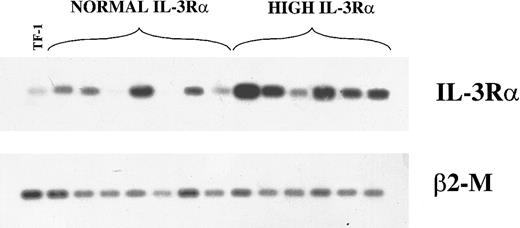
We evaluated also the levels of mRNA encoding IL-3Rα chain by semiquantitative RT-PCR in 7 patients in the group with normal IL-3Rα levels and 6 patients with high IL-3Rα levels. This analysis showed that, with the exception of one patient, the group of patients with high IL-3Rα levels displayed higher levels of IL-3Rα mRNA than the group of patients with normal IL-3Rα levels (Figure2).
RT-PCR analysis of IL-3Rα and β2-M mRNA.
Analysis in 13 AML patients (7 in the group with normal IL-3Rα levels and 6 in the group with high IL-3Rα levels) and in TF-1 control cells.
RT-PCR analysis of IL-3Rα and β2-M mRNA.
Analysis in 13 AML patients (7 in the group with normal IL-3Rα levels and 6 in the group with high IL-3Rα levels) and in TF-1 control cells.
In parallel, we have evaluated in the same patients the expression of GM-CSFRα chain (data not shown). Our analysis showed that the GM-CSFRα chain was expressed in most patients with acute leukemias, including AML, B-ALL, and T-ALL; however, the positivity observed in lymphoid leukemias was markedly lower than that observed in myeloid leukemias. Our analysis also showed that 60% of patients with AML displayed more than 50% of GM-CSFRα+ cells, whereas only 10% of patients with B-ALL displayed this property.
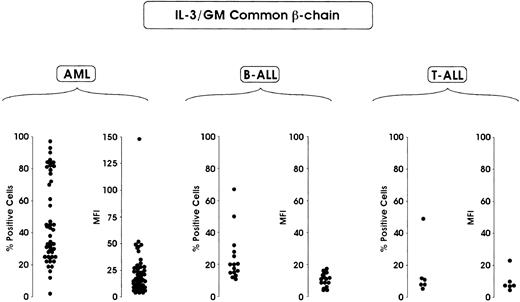
Finally, we evaluated the expression of IL-3/GM-CSFRs βc. This analysis showed that IL-3/GM-CSFRs βc was preferentially expressed in AML compared with B-ALL and T-ALL. Approximately 50% of patients with AML displayed more than 40% positive cells, whereas only 10% of patients with B-ALL exhibited more than 40% of positive cells (Figure3). An analysis of mean fluorescence intensity showed a relatively homogeneous distribution of this parameter in AML and B-ALL, with only 12% of patients with AML (pertaining to M2, M3, and mostly M4 subtypes) exhibiting a fluorescence intensity corresponding to more than 30 fluorescence intensity units (Figure 3).
Flow cytometric analysis of IL-3/GM-CSFR βc chain.
Evaluations were made in terms of percentage of positive cells and percentage of MFI in leukemic blasts derived from 63 patients with AML, 16 patients with B-ALL and 6 patients with T-ALL.
Flow cytometric analysis of IL-3/GM-CSFR βc chain.
Evaluations were made in terms of percentage of positive cells and percentage of MFI in leukemic blasts derived from 63 patients with AML, 16 patients with B-ALL and 6 patients with T-ALL.
Interestingly, the expression of receptors with a more limited spectrum of biological activity, such as the M-CSFR, was restricted to AML (data not shown). Similarly, c-kit expression was observed in most (71%) patients with AML, but relatively few patients with B-ALL (7%) expressed this membrane receptor (data not shown).
In AML patients a possible correlation between these parameters was evaluated. No significant correlation was observed between IL-3Rα and GM-CSRα values (P = .32), but a significant correlation was found between IL-3Rα and IL-3/GM-CSFRs βc (P = .002), particularly between GM-CSFRα and IL-3/GM-CSFRs βc levels (P = .001). No correlation between M-CSFR or c-kit expression or between IL-3Rα, GM-CSFRα, or IL-3/GM-CSFRs βc was observed.
Leukemic blasts do not down-modulate IL-3Rα chain
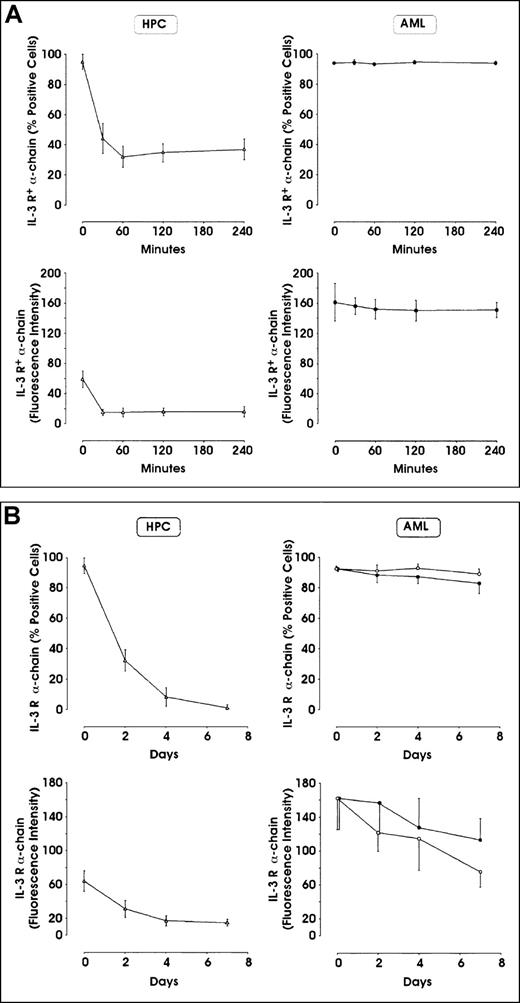
Given the elevated expression of IL-3Rα observed in approximately 45% of AML patients, we evaluated whether incubation of AML blasts with exogenous IL-3 down-modulated the surface IL-3Rα chain. Control experiments performed on purified HPCs (Figure4A, B) and in TF-1 erythroleukemic cells (data not shown) showed that incubation with IL-3 (100 U/mL) leads to a marked and rapid down-modulation of surface IL-3R α chain. In contrast, leukemic blasts showed only a moderate IL-3Rα chain down-modulation; more particularly, in the first hours following the addition of IL-3, leukemic blasts did not modify IL-3Rα chain expression (Figure 4A), but in the days following ligand addition, a moderate decline in IL-3Rα chain was observed (Figure 4B). Similarly, leukemic blasts failed to down-modulate GM-CSFRα chain following incubation with GM-CSF (data not shown).
Effect of incubation in the presence of IL-3 on IL-3Rα expression in leukemic blasts and normal HPCs.
Cells were incubated in the presence of 100 U/mL recombinant human IL-3, washed, and analyzed at different time intervals for IL-3Rα expression by flow cytometry. (A) Analysis at 0-240 minutes. (B) Analysis at 0-7 days. The results represent mean ± SEM values observed in 5 separate experiments. In panel B, right side, closed circles indicate samples minus IL-3, whereas open circles indicate samples plus IL-3.
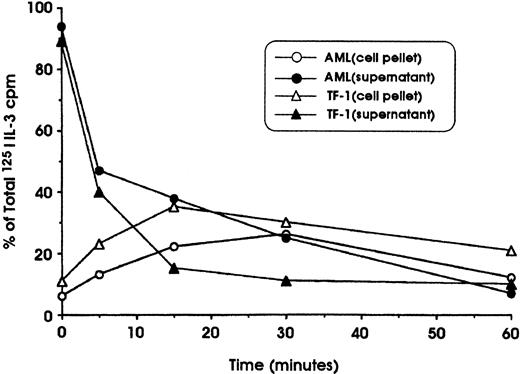
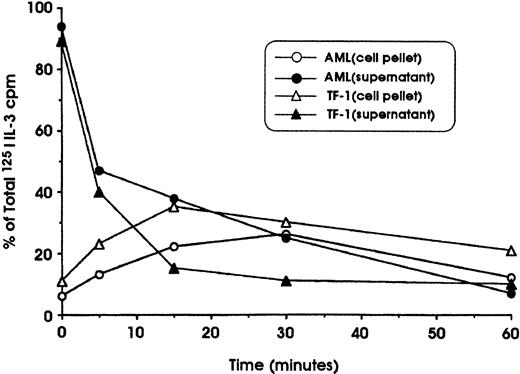
To determine whether the lack of IL-3R down-modulation observed in leukemic cells could be attributed to defective internalization, specific experiments were performed in which the cells were first incubated at 4°C with 125I–IL-3 and then were shifted at 37°C to allow the internalization of surface-bound IL-3. These experiments showed that leukemic blasts and TF-1 cells (used as a positive control) are able to bind with high affinity and to internalize IL-3 with comparable efficiency (Figure5). This observation indicates that the deficient IL-3Rα down-modulation observed in leukemic blasts cannot be related to a defective internalization of IL-3.
Study of 125I–IL-3 internalization into leukemic blasts and erythroleukemic TF-1 cells.
Cells were first incubated for 120 minutes at 4°C in the presence of 20 ng/mL 125I–IL-3, washed, and incubated at 37°C in RPMI 1640 medium. At regular time intervals (from 0 to 60 minutes), aliquots of cell suspensions were harvested and centrifuged; the cell pellet was then resuspended in an acid solution and centrifuged again. Finally, after centrifugation, the radioactivity in cell supernatant and pellet was determined. The radioactivity in the supernatant represents cell-surface–associated IL-3, whereas the radioactivity in the cell pellet represents internalized IL-3.
Stat5 expression and activation in AML
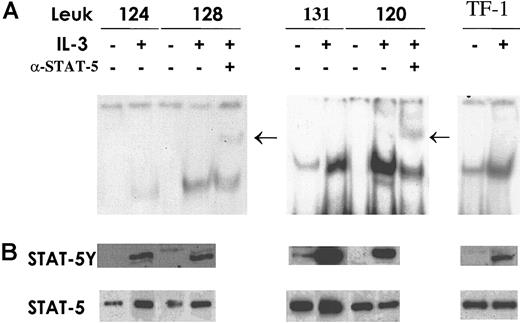
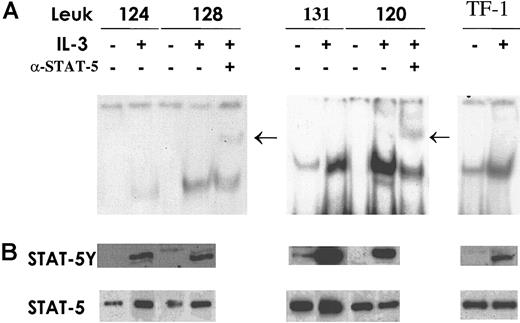
To evaluate whether the differences in IL-3Rα expression in AML correlate with differences in the activation of Stat5, the key transcription factor in IL-3 signaling, EMSA and Western blot analysis were performed. Total cell extracts were prepared from patients with AML who displayed normal IL-3Rα chain levels and from patients with AML who had elevated IL-3Rα chain levels, treated or not treated with IL-3. Stat5 activation was evaluated with EMSA using a labeled, double-stranded oligonucleotide corresponding to the SBE present in the β-casein gene promoter (the sequence is indicated in “Materials and methods”). Composition of the specific complex observed was determined by supershift analysis with antibodies recognizing Stat5. The results of this analysis indicate that the extent of specific Stat5 activation correlates with the level of IL-3Rα chain expression: patients displaying low or normal IL-3Rα expression exhibited after IL-3 stimulation a level of Stat5 activation distinctly lower than that observed in patients with high IL-3Rα levels (Figure6A). Constitutive Stat5 activation was observed in only 2 of 15 patients studied; interestingly, the 2 patients with constitutive Stat5 activation were part of the group of AML patients with elevated IL-3Rα expression. Western blot analysis (Figure 6B), performed with anti-Stat5 phosphotyrosine antibody, confirmed the results obtained using EMSA.
Stat5 expression and activation.
Cells from AML patients in the group with normal IL-3Rα levels and patients exhibiting high IL-3Rα expression were incubated for 15 minutes at 37°C either in the absence (−) or in the presence (+) of IL-3. TF1 cells were used as a control for Stat5 activation by IL-3. (A) Total cell extracts (20 μg) were analyzed by EMSA using a specific radiolabeled oligonucleotide corresponding to the SBE motif present within the β-casein promoter. Supershift assay was performed after incubation of cell extracts with anti-Stat5 as indicated. Arrows indicate the supershifted band. (B) Thirty micrograms whole-cell lysates was separated on 7% SDS-PAGE, transferred to a nitrocellulose membrane, and blotted sequentially with the indicated antibodies to evaluate Stat phosphorylation status (STAT-5Y) and protein content (STAT-5). These are representative EMSA and immunoblot experiments that were repeated 3 times with cell extracts from different AML patients.
Leukemic blasts with elevated expression of IL-3Rα chain are cycling
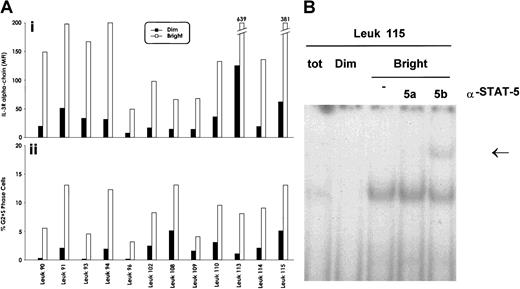
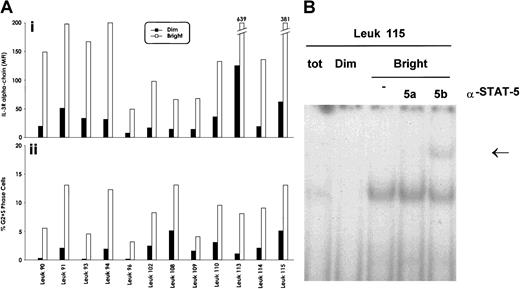
To evaluate whether the elevated expression of IL-3Rα chain observed in a significant proportion of acute leukemias may offer a growth advantage to leukemic blasts, we have sorted within the leukemic population, present in each patient, cells displaying strong and low reactivity with anti–IL-3Rα chain mAb. We then determined immediately after sorting the proportion of cycling cells within the IL-3Rαbright and IL-3Rαdim populations. This analysis, performed in 12 AML patients, showed that IL-3Rαbright blasts displayed a significantly higher proportion of cycling cells (Figure 7A) than IL-3Rαdim blasts (8.6 ± 2.8 vs 2.08 ± 1.6;P < .001).
Cell cycle status and IL-3Rα expression of AML blasts.
(A) Evaluation of the proportion of cycling blasts at the level of IL-3Rαbright and IL-3Rαdimsubpopulations, separated as reported in panel A. (i) The mean fluorescence intensity values of the separated IL-3Rαbright and IL-3Rαdimsubpopulations; (ii), the percentage of cycling cells of the IL-3Rαbright and IL-3Rαdim populations. Data from 12 AML patients are reported. (B) Stat5 DNA binding activity was evaluated in the IL-3Rαbright and IL-3Rαdim subpopulations by EMSA using SBE sequence on the β-casein promoter.
Interestingly, Stat5 DNA-binding activity was preferentially observed in the IL-3Rαbright population compared with the IL-3Rαdim population (Figure 7B), indicating that high IL-3Rα expression correlates with elevated IL-3 responsiveness.
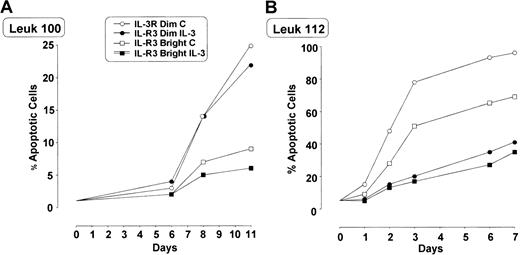
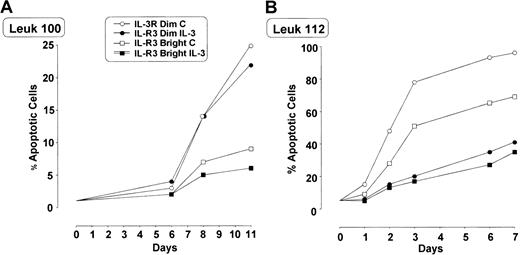
In some patients we evaluated whether IL-3Rαbright blasts exhibited a different sensitivity to apoptosis compared with IL-3Rαdim blasts. In these experiments leukemic blasts were grown either in the absence or in the presence of IL-3 (10 U/mL). Leukemic cells grown in vitro in the absence of IL-3 exhibited a progressive increase in the percentage of apoptotic cells (variable from one patient to another), whose extent was significantly lower in IL-3Rαbright cells than in IL-3Rαdim cells (Figure 8). The addition of IL-3 usually reduced the number of apoptotic cells.
Percentage of apoptotic IL-3Rαdim and IL-3Rαbright cells separated from total blast population growing in culture with and without IL-3.
Cells derived from 2 AML patients (patient 100, panel A; patient 112, panel B) were grown in the absence or in the presence of IL-3, and the proportion of apoptotic cells was evaluated by annexin V–FITC binding.
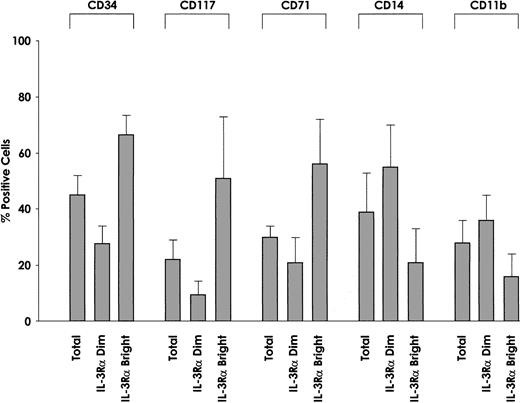
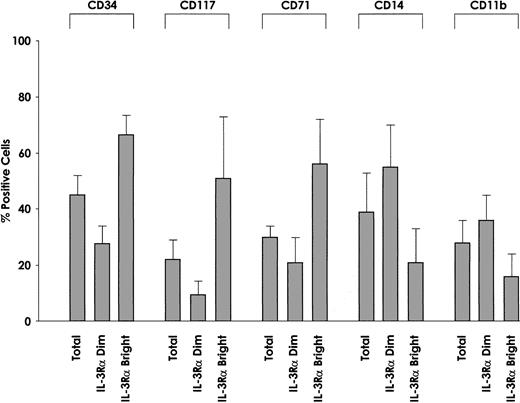
We also evaluated the membrane phenotype of IL-3Rαbrightand IL-3Rαdim cells. This analysis showed some interesting differences with regard to CD34 antigen expression. In fact, we observed that the proportion of CD34+ cells was significantly higher among IL-3Rαbright cells than IL-3Rαdim cells (P = .002) (Figure9), and c-kit was preferentially expressed among IL-3Rαbright cells than among IL-3Rαdim cells. The proportion of cells displaying maturation-related membrane markers, such as CD11b and CD14, was significantly lower among IL-3Rαbright than IL-3Rαdim cells (CD11b, P = .01; CD14,P = .005). Furthermore, the proportion of cells exhibiting proliferation-related membrane markers, such as CD71, was markedly higher among IL-3Rαbright cells than IL-3Rαdim cells (P = .001). Finally, IL-3Rαbright and IL-3Rαdim cells express similar levels of GM-CSFRα and IL-3/GM-CSFRβc.
Membrane phenotype of IL-3Rαdim and IL-3Rαbright cells.
IL-3Rαdim and IL-3Rαbright cells were separated from 5 AML patients, whose membrane phenotypes were then analyzed for the expression of CD34, CD117, CD71, CD14, and CD11b. The percentage of positive cells and mean values observed in 5 separate experiments.
IL-3Rα levels correlate with the number of leukemic blasts at diagnosis and are a negative prognostic factor
Because it is well known that the IL-3R stimulates the proliferation of normal and leukemic progenitors and we observed that leukemic cells expressing high levels of IL-3Rα chain are cycling (see above), it was of interest to evaluate a possible correlation between IL-3Rα levels and number of leukemic blasts detected at diagnosis. This analysis showed that a good correlation exists between IL-3Rα levels and the number of leukemic blasts at diagnosis among AML patients (P < .001), suggesting a role for IL-3Rα in leukemic blast proliferation/survival.
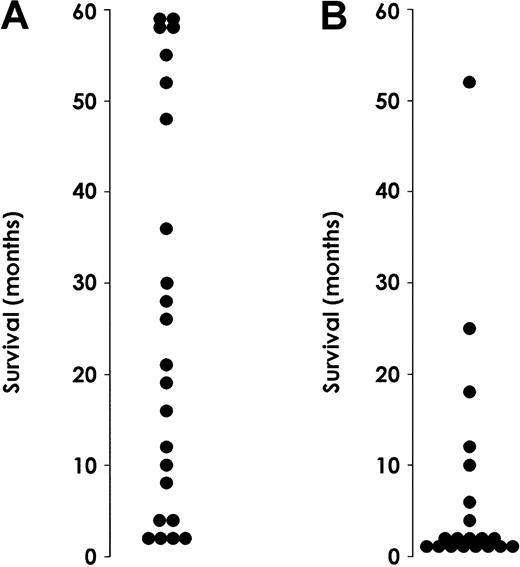
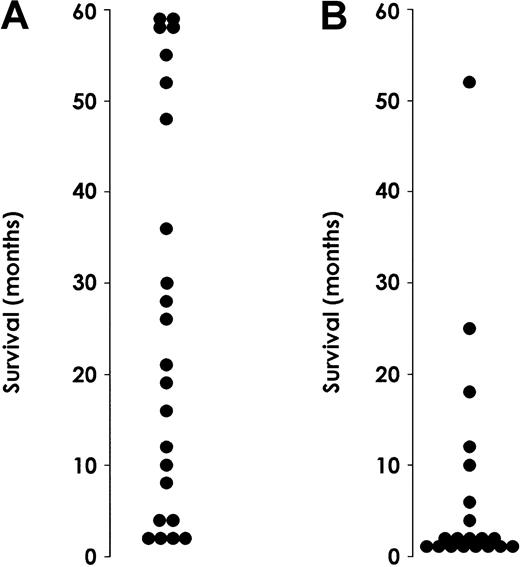
This observation prompted us to evaluate whether the level of IL-3Rα in AML patients might have a prognostic value (Figure10). We performed this analysis on a group of 43 AML patients. M3 patients were excluded because they received different treatment and their prognosis was different from that observed for the rest of the AML patients. Of these 43 patients, 23 belonged to the group of patients with low IL-3Rα expression and 20 to the group of patients with high IL-3R α expression (Table1). The median WBC count at presentation was significantly higher in patients with elevated (81 × 109/L) IL-3Rα levels than in those with low (22.5 × 10⁹/L) IL-Rα levels (P < .05). Thirty-four patients (20 in the high and 14 in the low IL-3Rα group) received intensive chemotherapy, and the remaining 9 were treated with supportive or palliative therapies only. A significant difference in the induction response rate was observed based on IL-3Rα expression, with a significantly higher number of complete remissions in the low IL-3Rα group (14 of 20 or 70% vs 5 of 14 or 36%, respectively;P < .05). Moreover, the relapse rate was significantly higher in the high than in the low IL-3Rα group (4 of 5 vs 6 of 14;P < .05). Finally, survival analysis indicated that median observed survival (OS) was more than 24 months in the low IL-3Rα group compared with 6 months in the high IL-3Rα group.
Survival of AML patients.
Survival rates for patients exhibiting normal (A) or high (B) IL-3Rα levels. Patients with M3 AML were excluded from this analysis because they received different treatment than the rest of AML patients.
Survival of AML patients.
Survival rates for patients exhibiting normal (A) or high (B) IL-3Rα levels. Patients with M3 AML were excluded from this analysis because they received different treatment than the rest of AML patients.
Discussion
Leukemogenesis and, more generally, tumorigenesis are considered multistep processes by which a sequence of transformation events progressively modifies the capacity of hemopoietic progenitors to proliferate, survive, and differentiate. Recent studies have shown that several molecular mechanisms are responsible for the autonomous proliferation and increased survival of leukemic cells.40
Acute leukemia cells are known to respond to exogenous HGFs, showing an induction of cell proliferation uncoupled to the induction of cell differentiation.6 Studies have shown that in most patients, however, leukemic cells are endowed with a consistent capacity of autonomous proliferation.41 The level of autonomous proliferation represents a major determinant of prognosis in AML in that a high rate of autonomous proliferation is associated with a highly aggressive phenotype and a poor prognosis.41Several lines of evidence suggest that the autonomous proliferation of leukemic blasts may be related to autocrine mechanisms of HGF production6 or to constitutive activation of the signal transduction machinery triggered by HGFR.42,43Furthermore, other studies have shown that AML patients, whose leukemic cells have a positive proliferation response to IL-3 and Kit ligand (KL), have poorer outcomes that result in lower remission rates and shorter survival times.44
In the present study we have investigated the level of IL-3Rα in acute leukemia, with the particular aim of evaluating whether this parameter may be related to the autonomous growth of leukemic cells. Our observations indicate that 45% of AML samples express IL-3Rα at significantly higher levels than controls. Two sets of independent observations suggest that elevated IL-3Rα chain expression may have a role in the proliferation of these cells. The first is that a direct correlation was observed between the level of IL-3Rα chain and the number of leukemic blasts observed at diagnosis. The second is that within each leukemic sample, the fraction of cycling blasts was preferentially observed in the fraction of cells expressing the highest IL-3Rα levels. Furthermore, the elevated IL-3Rα expression also represented a negative prognostic factor in that AML patients with elevated IL-3Rα levels had shorter survival times than patients with low IL-3Rα levels.
The mechanisms through which elevated IL-3Rα expression may confer a growth advantage to leukemic blasts remain to be determined. In this context, we have explored a possible effect of elevated IL-3Rα expression on Stat5 activation. Our results in part support a possible role for Stat5 in this phenomenon, as demonstrated by several lines of evidence: (1) IL-3–induced Stat5 phosphorylation and DNA-binding activity were generally higher in AML blasts exhibiting high IL-3Rα expression than in blasts with normal IL-3Rα expression; (2) analysis of sorted IL-3Rαdim and IL-3Rαbrightpopulations in each AML sample showed that Stat5 was preferentially observed in leukemic blasts expressing elevated IL-3Rα levels; (3) Stat5 was constitutively activated in only 2 of 15 patients, all in the group of patients exhibiting high IL-3Rα expression. Altogether these results point to a possible relationship between the level of IL-3Rα expression and the level of activation of the Stat 5 signaling pathway in AML blasts.
The mechanisms underlying the elevated IL-3Rα expression observed in AML blasts are unclear. The increased IL-3Rα expression observed in AML could be mainly related to a transcriptional mechanism, as suggested by the observation that increased levels of IL-3Rα mRNA are observed in most patients exhibiting high IL-3Rα levels. However, we cannot exclude that posttranscriptional and posttranslational mechanisms could play a relevant role in inducing elevated IL-3Rα expression. In this context, it is of interest to note that the IL-3Rα gene was one of the genes most abundantly expressed in normal CD34+ cells.45 To explain the elevated IL-3Rα expression observed on leukemic CD34+CD38− cells, the possible involvement of the transcription factor, interferon regulatory factor 1 (IRF-1), in this phenomenon has been suggested.45 This hypothesis is supported by 2 lines of evidence indicating that the IRF-1 factor is overexpressed in leukemic blasts compared with their normal counterparts, and it stimulates the transcription of the IL-3Rα gene.46 Interestingly, Stat 5 has been shown to bind to the GAS element present on the IRF-1 promoter.47It remains to be established whether the Stat5 activation described in our study plays any role in the IRF-1 overexpression observed in primary AML specimens.46
Our results also suggest that the elevated IL-3Rα expression observed in a significant proportion of patients with AML may play a central role in the biology of these leukemias. In fact, the overexpression of IL-3Rα in IL-3–dependent cell lines allowed an increased responsiveness to IL-3 (ie, the cells proliferate in the presence of suboptimal IL-3 concentrations) and induced a significant level of mutants exhibiting growth factor independence (ie, the cells proliferate in the absence of IL-3).48 Furthermore, overexpression of GM-CSF in mice induces the development of a fatal myeloproliferative disease.49 Third, the lack of expression of JunB in mice induces a marked overexpression of GM-CSFRα that leads to an increased responsiveness to GM-CSF that is responsible for the induction of increased levels of the antiapoptotic molecules Bcl-XL and Bcl-2 and, in turn, for the development of chronic myeloproliferative disease.50 In keeping with these observations, we suggest that the increased IL-3Rα expression observed in approximately 40% of patients with AML may be partly responsible for the more aggressive leukemic phenotype of these cells and for their reduced response to standard chemotherapy, as observed in the patient population hereby analyzed for treatment outcome. Larger clinical trials will allow a definite assessment of the prognostic value of IL-3Rα levels in AML.
We thank M. Blasi, M. Fontana, and A. Zito for editorial assistance.
Prepublished online as Blood First Edition Paper, June 14, 2002; DOI 10.1182/blood-2002-03-0852.
Supported by Associazione Italiana per la Ricerca sul Cancro, Associazione Italiana contro le Leucemie, Ministero della Salute and MURST Cofin. 70%, Ministero della Salute, Fondi 1% “Sviluppo di bioterapie innovative anti-tumorali.”
The publication costs of this article were defrayed in part by page charge payment. Therefore, and solely to indicate this fact, this article is hereby marked “advertisement” in accordance with 18 U.S.C. section 1734.
References
Author notes
Ugo Testa, Department of Hematology and Oncology, Istituto Superiore di Sanità, Viale Regina Elena 299, 00161 Rome, Italy; e-mail: u.testa@iss.it or u.testa@tiscali.it.

