Hematopoietic stem cells (HSCs) maintain hematopoiesis by giving rise to all types of blood cells. Recent reports suggest that HSCs also possess the potential to generate nonhematopoietic tissues. To evaluate the underlying mechanisms in the commitment of HSCs into multitissue and multihematopoietic lineages, we performed oligonucleotide array analyses targeting for prospectively purified HSCs, multipotent progenitors (MPPs), common lymphoid progenitors (CLPs), and common myeloid progenitors (CMPs). Here we show that HSCs coexpress multiple nonhematopoietic genes as well as hematopoietic genes; MPPs coexpress myeloid and lymphoid genes; CMPs coexpress myeloerythroid, but not lymphoid genes, whereas CLPs coexpress T-, B-, and natural killer–lymphoid, but not myeloid, genes. Thus, the stepwise decrease in transcriptional accessibility for multilineage-affiliated genes may represent progressive restriction of developmental potentials in early hematopoiesis. These data support the hypothesis that stem cells possess a wide-open chromatin structure to maintain their multipotentiality, which is progressively quenched as they go down a particular pathway of differentiation.
Introduction
Hematopoietic stem cells (HSCs) are clonogenic cells that possess properties of both self-renewal and multilineage potential, giving rise to all types of mature blood cells.1 Recent reports suggest that murine bone marrow fractions that are enriched for HSCs can give rise to nonhematopoietic tissues including neural cells, hepatocytes, myocytes, muscle tissue, and multiple organ tissues (for reviews, see Graf,2 Goodell et al,3 and Lagasse et al4). Thus, it is suggested that HSCs possess the potential for differentiating into nonhematopoietic tissues, although the plasticity of somatic stem cells is still under question according to recent reports.5 6 Transdifferentiation from HSCs into nonhematopoietic tissues suggests that HSCs maintain accessibility to multiple differentiation programs for nonhematopoietic as well as hematopoietic systems. Therefore, systematic analyses of gene expression profiles at various stages of physiologic hematopoiesis initiating from HSCs may provide insight into understanding developmental potential and plasticity of hematopoietic stem and progenitor cells.
Changes in chromatin structure, allowing access for RNA polymerase to initiate transcription, are essential for genetic programs to be transcribed.7,8 The activation of chromatin remodeling can occur prior to significant expression of genes.9,10 It has been hypothesized that a wide-open chromatin structure is maintained in early hematopoietic progenitors, enabling access to multilineage-affiliated programs.11 This may lead to “promiscuous” expression of genes affiliated with multiple lineages in stem or progenitor cells prior to their lineage determination. In fact, the coexpression of myeloerythroid genes, including myeloperoxidase (MPO) and β-globin, has been demonstrated in a fraction of a multipotential hematopoietic cell line and in immature progenitors in human bone marrow cells and mouse intraembryonic aorta-gonad-mesonephros (AGM) regions by single-cell multiplex reverse transcription–polymerase chain reaction (RT-PCR) analysis.12,13 Furthermore, we have reported that at the single-cell level, the earliest myeloid progenitors (common myeloid progenitors [CMPs]) coexpress both granulocyte/monocyte (GM)–affiliated and megakaryocyte/erythrocyte (MegE)–affiliated genes, whereas a fraction of the earliest lymphoid progenitors (common lymphoid progenitors [CLPs]) coexpress both B- and T-lymphoid genes.14 The existence of myeloid and lymphoid promiscuity at the major branch points of myeloid and lymphoid pathways, respectively, suggests that the accessibility of multiple lineage-affiliated programs allows for flexibility in fate commitment of each progenitor.14 These PCR studies, targeted for single cells, covered only representative myeloid and lymphoid genes. Thus, a global view of gene expression profiles including hematopoietic and nonhematopoietic genes is essential to unravel the complexity of activation of multiple genetic programs in early hematopoiesis.
In this report, we systematically profiled gene expression in rigorously purified self-renewing HSCs,15,16non–self-renewing multipotential progenitors (MPPs),15,16and lineage-restricted CLPs17 and CMPs.18 We found that HSCs possess transcriptional accessibility for multiple differentiation programs for nonhematopoietic as well as hematopoietic systems. Promiscuous expression of lineage-related genes decreases progressively as cells lose their multipotentiality and become lineage restricted. These data support the concept that HSCs maintain a wide-open chromatin structure that may allow HSCs to access nonhematopoietic as well as hematopoietic developmental programs at least at the transcriptional level, and that lineage potential is hierarchically controlled by stepwise-regulated epigenetic programs that guide transcriptional accessibility specific for each hematopoietic stage.
Materials and methods
Isolation and characterization of stem/progenitor cells
HSCs and progenitors were isolated from C57B6-J mice following published protocols with slight modification15-19(website:http://www.stowers-institute.org/labs/lilab/hscdb.asp). Lineage-negative/low (Lin−/lo) bone marrow cells, obtained through Lin+ depletion by sequentially using Dynabeads and fluorescence-activated cell sorter (FACS), were stained with APC-c-Kit–, PE-Sca-1–, and biotin/SA-PerCPCy5.5–conjugated Thy-1. The c-Kit+Thy1loLin−/loSca-1+(KTLS) cell population was separated into rhodamine 123 Rhlo HSC and Rhhi MPP populations.16,20 CLPs are interleukin 7 receptor α-positive (IL-7Rα+) c-KitloSca-1lo cells, whereas CMPs are IL-7α−c-Kit+Sca-1−CD34+FcγRII/III+ cells. Cell cycle analysis was performed by using Hoechst 33342 (10 μM/L).20CD45+ HSCs were sorted as CD45+Lin−Kit+Sca-1+CD34−cells. Cells were purified mainly by a trilaser (488 nm, 350 nm, and 647 nm) high-speed FACS (Moflo, Cytomation, Fort Collins, CO). Double-sorted populations with more than 99% purity were used for the study.
RNA purification, labeling, and hybridization
Total RNA was extracted from 8 × 10⁴ each of 4 purified populations by the Trizol method; a minimum of 50 000 cells is required to obtain a linear amplification of RNA using T-7 promoter-based RNA amplification.21 The amount of RNA was measured using Microplate SpectraMax (Molecular Devices, Sunnyvale, CA). Approximately 300 ng total RNA was obtained from each cell population. cDNA and the corresponding cRNA were synthesized following the manufacturer's procedure.22 cRNA was purified using Qiagen RNeasy columns (Qiagen, Valencia, CA), and fragmented to sizes of 35 to 200 bases. The Affymetrix GeneChip MU-U74 (version 2) arrays A and B (Affymetrix, Santa Clara, CA) cover 6000 known murine genes and 18 818 expressed sequence tag (EST) Unigene cluster sequences. Equal amounts of biotinylated cRNA derived from each population of cells were mixed with antisense biotinylated control cRNA (bioB, bioC, bioD, and cre) and were then individually hybridized with chips A and B. The chips were then washed, stained, scanned, and normalized (enabling comparison of data among chips) following the standard procedure (Affymetrix).22 We obtained replicate results of hybridization data for HSCs and MPPs from 2 independent experiments, from isolation of cells (from 120 C57BL/6 mice in each experiment) to hybridization. The 2 sets of independent results were well reproduced and demonstrated very similar expression patterns. The average of these 2 results was used for data analysis. We could obtain CLPs and CMPs for one set of hybridization; however, expression patterns of some representative genes are consistent with data obtained by single cell–based or semiquantitative RT-PCR assays.14 18
Single-cell RT-PCR
Single-cell RT-PCR was carried out based on a published procedure12 with the following modifications. (1) Single cells of HSCs and MPPs were directly triple sorted into 96-well arrays of 0.2-mL microamp tubes. (2) The lysis buffer contained 0.5% Triton X-100 instead of 0.4% NP-40. Primer information used in this assay can be obtained on request.
Data analysis
Pearson correlation coefficient.
Let yjk represent the expression level of the jth gene in kth sample, here k = 1,…m, andj = 1,…,n, with m = 4, andn = 24 818 in our sample data. Let k = 1 correspond to the sample gene expression observed in HSCs,k = 2 in MPPs, k = 3 in CLPs, andk = 4 in CMPs. The Pearson correlation coefficient between any 2 samples is given by
where
are the mean and standard deviation (SD) of the kthsample, respectively
Cutoff line and basal levels.
The analysis software (Affymetrix) that converts raw hybridization intensities into expression levels (“average difference” in Affymetrix terms) for each gene is based on the comparison between the hybridization signals of perfect match (PM) and mismatch (MM).22 Thus, many negative values were obtained if the MM value was higher than the PM value, making it difficult to compare the expression patterns between 2 or more conditions when one of the conditions is a negative value. Therefore, we converted all negative values to a positive 20, using 20 as the background level.23 To estimate how many genes were expressed in each population of cells, “expressed” was defined as the expression level of a given gene being more than 100.23
Prescreening using screening filter.
The genes in our microarray data were considered as differentially expressed and were screened for clustering analysis if they passed the filter given by ‖yj(m) − yj(1)‖> 100 andyj(m)/yj(1) > 2 forj = 1,…,n, whereyj(m) and yj(1) are the order statistics with yj(1) ≤…≤yj(m) for the jth gene. This filtering criterion considers simultaneously the absolute difference (> 100) of the gene expression levels and the fold change (> 2-fold) of the expression levels for each gene (> 100). Thus, 5223 genes were selected for clustering analysis including 137 initial seeds.
K-means clustering.
The K-means clustering method groups items together according to their similarity. The similarity/dissimilarity of the ith and jth genes is given by the euclidean distance between the 2 observations:
This method is designed to group observations into a collection of K clusters. The value of K can be determined either in advance or as a part of the clustering procedure. This algorithm assigns each item to the cluster having the nearest centroid according to the euclidean distance. The method begins with an initial partition of K clusters, or K initial centroids (seed points). Then it proceeds through the list of items, assigning an item to the cluster whose centroid is nearest. Next it involves recalculation of the centroid for the cluster receiving the new item and for the cluster losing the item. The process is repeated until no more reassignment of items occurs. To eliminate variation within the gene expressions the genes are normalized (or standardized) prior to clustering.
Results
Gene expression in purified cells
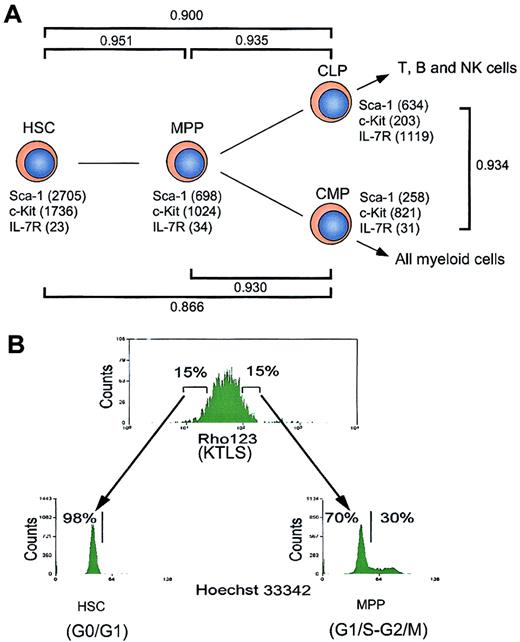
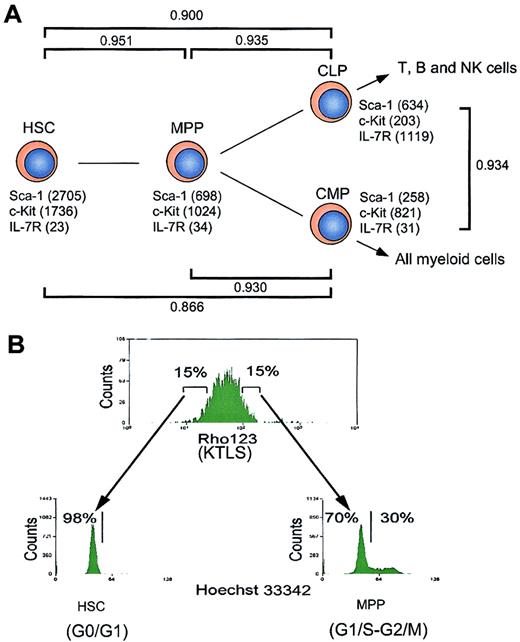
The target populations of this study include HSCs,15,16 MPPs,15,16 CLPs,17and CMPs18 (Figure 1). MPPs can generate both lymphoid and myeloid cells but do not have self-renewal activity.15,16 CLPs give rise to T, B, and NK cells but not myeloid cells, and at least contain clonogenic progenitors for T and B cells.17 CMPs exclusively generate myeloid cells and more than 60% of single CMPs were demonstrated to give rise to both MegE and GM components.18 HSCs, MPPs, CLPs, and CMPs were purified by multicolor FACS, as reported.15-18 The purified HSCs with long-term multilineage hematopoietic reconstitution activity16 were in the G0/G1 phase (98%), whereas 30% of MPPs were in S/G2/M phases, indicating that a majority of MPPs are cycling (Figure 1B). These data are compatible with the notion that HSCs are slowly dividing, but the MPPs represent an expanding subset.
Hierarchical distribution and cell cycle status of hematopoietic stem and progenitor cells.
(A) Schematic illustration of hematopoietic development. The expression levels of cell surface markers (such as Sca-1, c-Kit, and IL-7R) revealed by microarray analysis are indicated. CD34 and FcγRII/III are not included in the chips. γ represents Pearson correlation coefficient, which reflects the developmental distance between 2 populations of cells. (B) Analysis of cell cycle status of hematopoietic stem and progenitor cells. HSCs (Rhlo KLTS) and MPPs (Rhhi KLTS) were stained with Hoechst 33342, and the cell cycle statuses were represented by DNA contents.
We analyzed the gene expression in these purified stem and progenitor cells using the MG-U74 set of oligonucleotide arrays A and B representing 6000 known genes and 18 818 ESTs according to the Affymetrix database. We first analyzed how many genes were expressed in each population by picking up genes with expression levels above the cutoff line defined by a compensation method recommended by the manufacturer (see “Materials and methods”). As shown in Table1, about 42% of genes on the chips were detectable in each population. Among these, around 23% of genes were expressed at low levels in each population of cells. The expression levels of surface markers used for sorting each population (such as c-Kit, Sca-1, and IL-7R) determined by the array analysis were consistent with the definition of each population based on FACS,15,17 18 which verifies the quantification of gene expression in this assay (Figure 1). In addition, the result of analyzing representative genes using single-cell RT-PCR also verified the microarray analysis (see website cited in “Isolation and characterization of stem/progenitor cells”). The pair-wise relationship between HSCs and MPPs, represented by the Pearson correlation coefficient (γHSC-MPP), was 0.951 (Figure 1A), indicating a significant positive linear correlation of gene expression intensity and diversity between these populations. Likewise, γHSC-CLP and γHSC-CMP were 0.900 and 0.866, and γMPP-CLP and γMPP-CMP were 0.935 and 0.930, respectively. Thus, the numerical correlation values correctly reflect the hierarchical relationship among these purified populations in physiologic hematopoiesis (Figure 1). Of about 2000 known genes that passed the cutoff line (see “Materials and methods”), 2 groups of genes were classified as either hematopoiesis- or nonhematopoiesis-affiliated genes according to their tissue-specific expression or functions (Table 1). These genes are shown in Figures2 and 4.
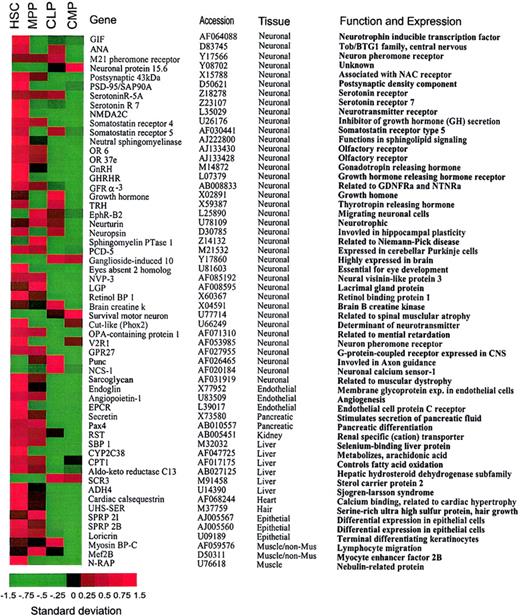
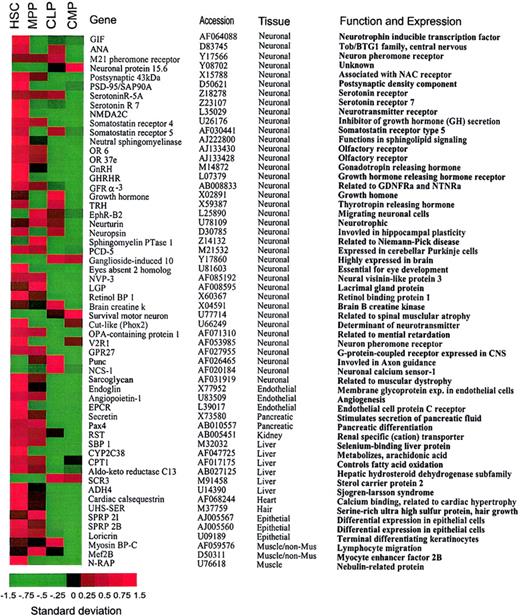
Promiscuous gene expression of nonhematopoiesis-affiliated genes in HSCs.
(A). A list of nonhematopoiesis-affiliated genes predominantly expressed in HSCs. Note that the majority of genes that are predominantly expressed in HSCs show attenuated expression in the downstream progenitors. Genes listed in this figure have been confirmed by the hybridization result derived from CD45+ HSCs with expression levels of the majority of genes more than 200. A standardized (normalized) gene expression level is equal to (an expression level of a gene minus mean of the expression levels of this gene)/(the SD of the expression levels of this gene). All the gene expression levels are translated into these normalized values so that their means are all brought to 0 (allowing a comparison of gene expression on the same table). Therefore, the patterns of the genes are comparable on the basis of these normalized expression levels. In this image, the normalized expression levels of genes are presented according to a colored gradient scale from the highest (red) to the lowest (green; see colored scale). Importantly, the normalized expression level only reflects a relative score of the expression level of a gene, not the absolute expression levels of that gene. Therefore, “−1.5” may not indicate “no expression” but may only indicate a very low expression relative to the expressions of this gene under other conditions.
Genes related to multiple nonhematopoietic tissues are predominantly expressed in HSCs
Transcripts of a variety of nonhematopoietic genes were detected in early hematopoiesis (Table 1). HSCs expressed 43 of 58 genes specific to nonhematopoietic tissues detected by chip hybridization. These nonhematopoietic tissues included brain, liver, heart, kidney, pancreas, muscle, and endothelium as listed in Figure 2. Expression of the majority of these nonhematopoietic genes was progressively attenuated in MPPs and downstream CMPs and CLPs. Thus, promiscuous expression of nonhematopoietic genes (nonhematopoietic promiscuity) is most pronounced in the HSC population (Table 1).
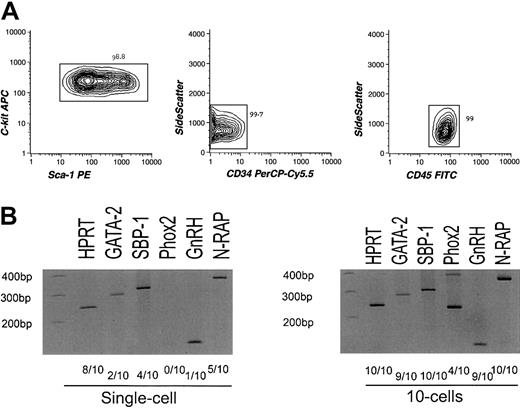
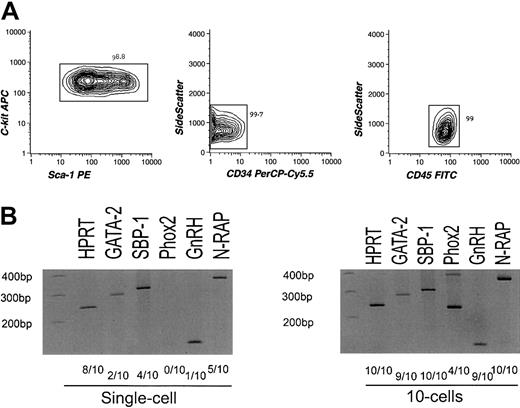
To exclude the possibility that the nonhematopoietic gene transcripts may be derived from bone marrow nonhematopoietic cells sharing the phenotype with HSCs, we further purified HSCs using CD45, a hematopoiesis-specific marker.24 cRNA amplified from highly purified long-term HSCs of Lin−CD34−/loc-Kit+Sca-1+CD45+phenotype19,25 (Figure3A) was again hybridized to the MGU-74A chip, resulting in a similar expression pattern of hematopoietic and nonhematopoietic genes (see website cited in “Isolation and characterization of stem/progenitor cells”). We then randomly chose 4 genes(SBP-1, GnRH, N-RAP, andPhox2) from the list and tested their expression by RT-PCR targeting for 1 and 10 cells of CD45+HSCs. SBP-1 is a selenium-binding liver protein26; GnRH regulates the production of testosterone via the hypothalamic-pituitary-gonadal axis27; N-RAP encodes a Nebulin-related protein and is specifically expressed in skeletal and cardiac muscle28; Phox2 is required for induction of expression of panneuronal genes including tyrosine hydroxylase(TH).29 As shown in Figure 3C, these genes were detectable at single or 10 cell levels. Differences in cell numbers required for positive detection in RT-PCR analyses might represent the frequency of cells expressing these target genes, the difference in copy numbers of transcripts per cell, or both. Thus, it is likely that a majority of nonhematopoietic genes detected in the Affymetrix chip are expressed in a significant population of CD45+ HSCs.
Analysis of sorted CD45+long-term HSCs.
(A) Results of reanalysis of purified CD45+ HSCs. Lin−Sca-1+c-Kit+CD34−CD45+cells were double sorted and reanalyzed. The purity of the CD45+ HSCs reached up to 99% as indicated. (B) Results of RT-PCR assays of nonhematopoiesis-affiliated genes (SBP-1, GnRH, N-RAP, and Phox2) and GATA-2targeting limited numbers of CD45+ HSCs. Hypoxanthine guanine phosphoribosyl transferase (HPRT) was used as a positive control.
Expression of hematopoiesis-affiliated genes during early hematopoietic development
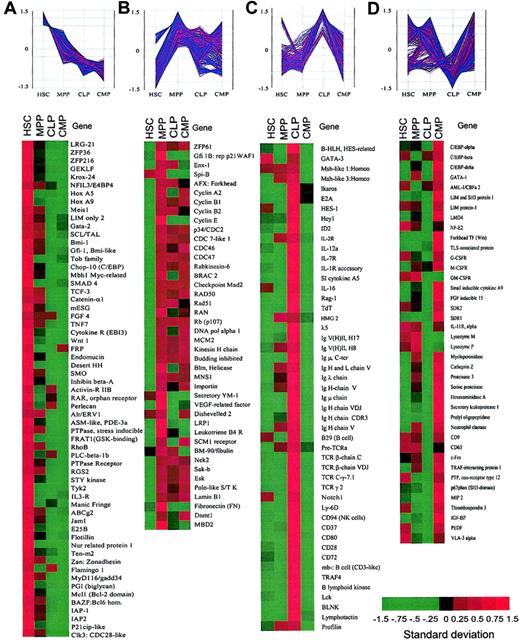
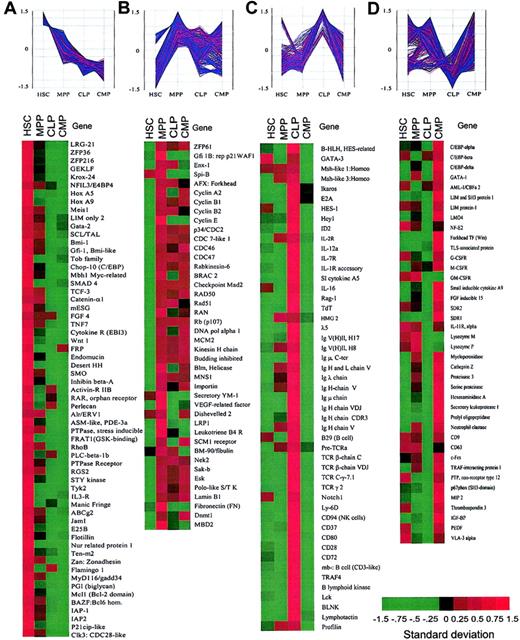
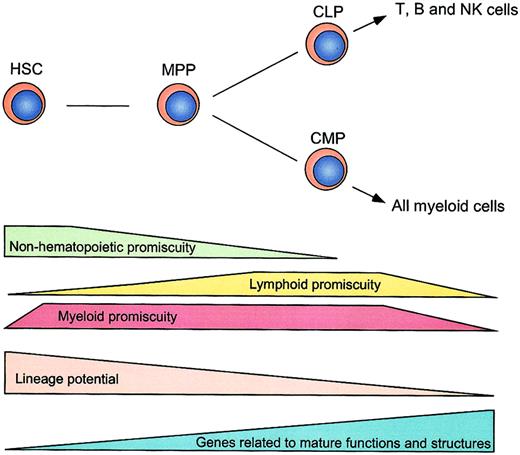
Hematopoiesis-affiliated genes on the chip contained 160 lymphoid-, 117 myeloid-, and some stem/progenitor-related genes. A partial list of these genes is shown in Figure4. HSCs expressed more than 40% of the hematopoiesis-related genes. Interestingly, HSCs expressed GM- and MegE-affiliated genes, including myeloid cytokine receptors and transcription factors, but only a limited number of lymphoid genes. In contrast, MPPs expressed about 30% of hematopoietic genes related to both lymphoid (T and B) and myeloid (GM and Meg E) lineages. CMPs expressed 26% of myeloid (GM- and MegE-affiliated) genes but not lymphoid genes, whereas CLPs expressed 45% of lymphoid (T-, B-, and NK-affiliated) genes but not myeloid genes. Hence, coexpression of myeloerythroid genes (myeloid promiscuity) exists in HSCs, MPPs, and CMPs, whereas coexpression of T/B/NK lymphoid genes (lymphoid promiscuity) exists mainly in MPPs and CLPs. These data strongly suggest that myeloid and lymphoid promiscuity is distributed in a hierarchical and asymmetrical fashion during hematopoietic development and, therefore, the expression of lineage-related genes can precede commitment12 14 (Figures1, 4, and5).
Clusters of genes categorized by the expression patterns in purified stem and progenitor cells.
Spotfire software was used to visualize the changes in expression levels of each gene during hematopoietic development. The vertical axis represents the normalized gene expression values. (A) Representative genes that are predominantly expressed in HSCs and down-regulated in MPPs, CLPs, and CMPs. (B) Representative genes that were up-regulated in MPPs. (C) Representative genes that are highly expressed in CLPs. (D) Representative genes that are highly expressed in CMPs. See Figure 2 legend for explanation of color bar.
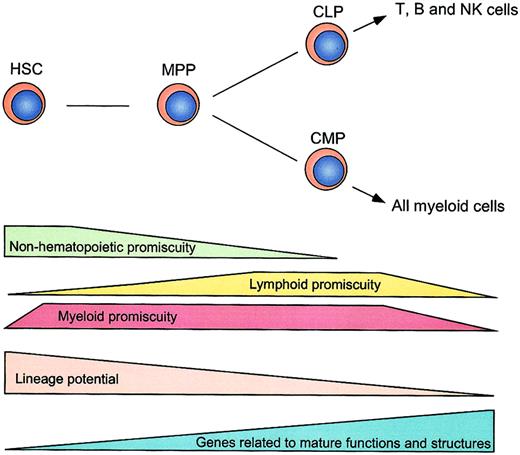
A schematic illustration of distribution of hematopoietic and nonhematopoietic lineage promiscuity.
Stepwise decreases of lineage potentials and lineage promiscuity during early hematopoiesis are shown. Lineage promiscuity is distributed in a hierarchical and asymmetrical fashion.
A schematic illustration of distribution of hematopoietic and nonhematopoietic lineage promiscuity.
Stepwise decreases of lineage potentials and lineage promiscuity during early hematopoiesis are shown. Lineage promiscuity is distributed in a hierarchical and asymmetrical fashion.
Differential expression of nonhematopoietic and hematopoietic genes during hematopoietic development
Because groups of genes with similar expression behavior (up-regulation or down-regulation under the same condition) are likely to be functionally related,30 we next compared the relative expression patterns of genes within these populations. Among a variety of clustering methods, including self-organization maps (SOMs)31 and hierarchical clustering,32 we found K-means clustering, which uses genes with known functions as initial seeds for clusters,33 to be most appropriate34 (see “Materials and methods”). We picked 137 known genes, the biologic functions of which have been well characterized, as our initial seeds. A total of 5223 genes that passed our initial screening filter were subjected to further analysis. The expression levels of these genes were first standardized (or normalized) and then analyzed by K-means clustering using Minitab data analysis software. The final partition of the 5223 genes/ESTs resulted in 100 clusters, each containing a different number of genes (see “Materials and methods”). We focused on genes that were dominantly expressed in each population, grouping them into 4 categories (Figure4; Table 1).
The clustering analysis revealed again that the majority of nonhematopoiesis-affiliated genes fell into category A (Table 1). Category A also contained genes that might play a role in the regulation of stem cell properties such as self-renewal (Figure 4A). These include Wnt1, desert hedgehog (DHH),TCF3 (a target of Wnt signaling), and Smoothened (SMO; a coreceptor of DHH), which are potentially involved in maintaining stem cell compartments.35 Genes related to cell growth arrest (eg, gut-enriched Kruppel-like factor andZFP36),36,37 immortalization of cells (eg, Bmi-1, a polycomb-group protein),38 leukemogenesis (eg, HoxA9 and Meis1)39 and commitment (eg, Manic Fringe [Notch activity regulator])40 were also found in this category.
We found that 13.8% of the genes (n=5223) were significantly up-regulated in MPPs but maintained at various levels in CLPs and CMPs (category B, Figure 4B). These included 26% of hematopoietic (both myeloid and lymphoid) genes, which were elevated at the MPP stage. Thus, MPPs coexpress genes related to multiple myeloid and lymphoid lineages (Figure 4C-D), suggesting that both myeloid and lymphoid promiscuity may operate at this stage. Other known genes in this category include regulatory molecules of cell cycling such as cyclins, CDC molecules, and cell cycle checkpoint molecules (BRCA, MAD2, etc). Several kinases related to cell proliferation such as Nek2, Sak-b (a homolog to Drosophila Polo) and Esk41 were also found in this category. These data are compatible with the fact that MPPs are highly proliferative cells (Figure 1B) and suggest that MPPs are at a priming stage for both myeloid and lymphoid differentiation.
The majority of genes preferentially expressed in CLPs (41% of hematopoietic-related genes, category C) and CMPs (25% of hematopoietic-related genes, category D) were lymphoid and myeloid genes, respectively (Table 1; Figure 4). Genes in category C included B, T, and NK lymphoid-associated genes (ie, E2A,Ikaros, HES-1, Notch1,42GATA-3, BLNK, TCRβ,TCRγ, CD94, TdT, RAG-1, B lymphoid kinase, Lck, and IL-7R), whereas genes in category D included granulocyte/monocyte- and megakaryocyte/erythrocyte-affiliated genes (ie, GATA-1,C/EBPα, β, and δ,LMO4, FOG, and IL-11R,G-CSFR, GM-CSFR). Interestingly, the majority of the genes categorized in categories C and D are likely to be reciprocally regulated between CLPs and CMPs, representing the myeloid-versus-lymphoid branch point. This result suggests that transcriptional regulation of lymphoid-affiliated (T, B, and NK lineages) or myeloid-affiliated (MegE and GM lineages) genes is a mutually exclusive event in the progression from MPPs to either CLPs or CMPs.
In addition to mutually exclusive regulation in the expression of lymphoid-versus myeloid-related genes, a number of genes were up-regulated at the CLP (Figure 4C) or CMP stage (Figure 4D) as a result of transition from the MPP stage. These genes encode molecules related to cell differentiation and functions, such as lymphoid-relatedLck, λ5, TdT, RAG-1 and myeloid-related LIM and SH3 protein 1, LMO4,SDR1, macrophage inflammatory protein (MIP), and small inducible cytokine A9. This indicates that up-regulation of lineage-affiliated genes is also required for lineage specification.
Discussion
Gene expression profiling by microarray in murine HSCs has been reported by us and others previously.16,43 44 These studies identified a large number of genes that are predominantly expressed in HSCs. However, these were performed by subtraction of total mRNA in HSCs from those in mature cells (such as unfractionated bone marrow cells), resulting in exclusion of lineage-affiliated genes from the survey. In the present study, we systematically profiled gene expression without pre-excluding multilineage-affiliated genes. Our data demonstrate that both nonhematopoietic and hematopoietic lineage-affiliated genes are transcribed at a low level in HSCs, and the size of the “functional genome” (defined by transcriptional accessibility for lineage-affiliated programs) is progressively decreased as HSCs undergo differentiation (Figure 5).
The expression of lineage-specific genes can occur prior to the lineage decision in the hematopoietic system.45 This notion has been obtained by previous studies that demonstrated the coexpression of representative myeloid or lymphoid genes in hematopoietic progenitors.12-14 Here, we significantly extend this view by using oligonucleotide microarray analysis. HSCs coexpress myeloid (GM- and MegE-affiliated) but not lymphoid genes. MPPs coexpress myeloid and lymphoid genes. CMPs and CLPs coexpress a vast majority of GM- and MegE-affiliated genes, and T-, B-, and NK-lymphoid genes, respectively. Thus, our genome-wide gene profiling reveals that HSCs predominantly exhibit myeloid promiscuity, MPPs exhibit both lymphoid and myeloid promiscuity, and CLPs and CMPs exclusively possess lymphoid and myeloid promiscuity, respectively (Figures 4-5). The distribution of hematopoietic promiscuity shown here is compatible with our single-cell RT-PCR study that demonstrates the coexpression of GM- and MegE-affiliated genes in single HSCs and CMPs, and of T- and B-lymphoid genes in single CLPs.14 Accordingly, lineage promiscuity might be a common transcriptional feature in uncommitted stem or progenitor cells, which may represent their immediate lineage potential.14 In this context, lineage commitment might require inactivation of programs for unselected lineages (lineage exclusion) as well as activation or stabilization of programs for committed lineages (lineage specification).46
It is of interest that the most primitive HSCs expressed myeloid but not lymphoid genes.13 Our data strongly suggest that in normal hematopoietic development, priming of myeloid genes precedes that of lymphoid genes. This phenomenon may reflect both evolution and ontogeny. For example, primitive hematopoietic cells appearing during embryonic development can produce primitive erythroid cells and macrophages, but fail to form lymphoid cells,47 and the appearance of macrophage/erythroid cells precedes lymphoid cell formation during evolution.48
One of the most striking results in this study is that primitive HSCs positive for CD45, a hematopoietic cell-specific marker, express almost 70% of genes affiliated to nonhematopoietic tissues. The expression of nonhematopoietic genes is down-regulated progressively in HSC descendants. Recent reports demonstrate that bone marrow contains cells capable of differentiation into multiple organs, including endothelial cells, skeletal and cardiac muscles,49 neuronal and glia cells,50 parenchymal liver cells24 or epithelial cells,51 as well as hematopoietic cells. However, most of these reports lack clonal evidences for hematopoietic and nonhematopoietic differentiation. The plasticity of somatic stem cells has also been challenged recently by several reports, particularly as to the conversion from nonhematopoietic stem cells to hematopoietic tissues. McKinney-Freeman and coworkers found that only CD45+, but not CD45−, muscle-regenerating cells could give rise to hematopoietic cells, and therefore hematopoietic reconstitution activity in muscle cells might be ascribed to HSCs circulated to muscles.52 It is also reported that cell fusion can occur during coculture of embryonic stem (ES) cells and neural stem cells (NSCs) or HSCs. Thus, the data supporting “conversion” from NSCs (or HSCs) to ES cells may be obtained through spontaneous generation of hybrid cells rather than epigenetic reprogramming of the somatic stem cells,5,6 although cell fusion was observed at an extremely rare frequency. In contrast, as few as 50 highly purified CD45+ HSCs can differentiate into parenchymal liver cells24 and muscle cells.52Furthermore, a single HSC has been demonstrated to differentiate into blood as well as epithelial cells of multiorgans by using the Y chromosome as a clonal marker.51 Thus, it is likely that lineage conversions from hematopoietic to nonhematopoietic cells can occur, although the “transdifferentiation” in a physiologic setting may be a rare event.53 54 Our data demonstrated that HSCs at least possess transcriptional accessibility for genes affiliated to nonhematopoietic multiple organs (Figure 5). This phenomenon may explain the “plasticity” of HSCs to “transdifferentiate” into nonhematopoietic tissues at the molecular level.
Thus, stage-specific distribution of lineage promiscuity (Figure 5) may reflect the selective closing and opening of chromatin domains specific for each progenitor or stem cell type. We have also observed that a variety of chromatin-related genes (such as histone, chromobox,Hdac, and Dnmt) display stage-specific expression patterns that are potentially related to accessibility of each type of cell for lineage-affiliated genes or programs (X.H. and L.L., unpublished results, December 2001). Further studies are required to understand the epigenetic programs controlling the stage-specific transcriptional accessibility in early hematopoiesis.
We thank Dr I. L. Weissman for scientific discussion. We thank Drs R. Krumlauf, E. Rothenberg, and C. J. Sherr for critically reviewing the manuscript. We are grateful to Drs L. Wiedemann and P. Nelson for scientific discussion and to D. di Natale and D. Stenger for assistance on manuscript editing. We are grateful to Dr R. Perera and his coworkers D. Stark and A. McKee for assistance on Affymetrix technique and analysis, and M. A. Handley for technical assistance in FACS operation. We thank Drs A. Mushegian, M. Coleman, and E. Glynn for bioinformatics assistance, and W. Walker and her coworkers for animal care. We are grateful to summer interns R. Dalal for help on data analysis and S. Young for blast search.
Prepublished online as Blood First Edition Paper, September 5, 2002; DOI 10.1182/blood-2002-06-1780.
Supported in part by the Leukemia Research Foundation and Damon Runyon Cancer Research Foundation (K.A.); and by Stowers Institute for Medical Research (L.L.).
K.A. and X.H. contributed equally to this work.
The publication costs of this article were defrayed in part by page charge payment. Therefore, and solely to indicate this fact, this article is hereby marked “advertisement” in accordance with 18 U.S.C. section 1734.
References
Author notes
Linheng Li, Stowers Institute for Medical Research, 1000 E 50th St, Kansas City, MO 64110; e-mail:lil@stowers-institute.org.

