The molecular markers that distinguish primary mediastinal large B-cell lymphoma (PMBL) from nonmediastinal diffuse large B-cell lymphomas (NM-DLBLs) remain to be identified. Using cDNA representational difference analysis to compare PMBL and NM-DLBL transcripts, we isolated a cDNA fragment homologous to the mouse B-cell interleukin 4 (IL-4)–inducible gene FIG1(interleukin 4–induced gene 1) transcript. The human FIG1mRNA encodes a 567 amino acid protein that comprises a signal peptide and a large flavin-binding amino oxidase domain, and shares significant homology with secreted apoptosis-inducing L-amino acid oxidases. Northern blot studies showed that FIG1 mRNA expression is mainly restricted to lymphoid tissues. It is expressed at low levels in thymus, spleen, tonsils, and reactive lymph nodes, and is highly up-regulated in IL-4+CD40–activated tonsillar B cells. Interestingly, in human B-cell lines, FIG1 mRNA expression appeared restricted to the PMBL-derived MedB-1 and Karpas 1106 cell lines. Using real-time reverse transcriptase–polymerase chain reaction (RT-PCR), we demonstrated that all but one PMBL (16/17) displayed high FIG1 mRNA levels, whereas most NM-DLBLs (12/18) and all low-grade B-cell lymphomas tested (8/8) exhibited low FIG1 mRNA levels. The difference between PMBLs and NM-DLBLs was statistically significant (Fisher test;P = .0003). Southern blot studies did not show rearrangement of the FIG1 gene. FIG1 gene expression might be due to a constitutive activation of a cytokine signaling pathway in PMBL.
Introduction
In the past 10 years, there has been increasing evidence that primary mediastinal large B-cell lymphoma (PMBL) harbors unique clinical, pathologic, and immunohistochemical features. This disease is now recognized as a specific lymphoma subtype among diffuse large B-cell lymphomas (DLBLs) in the World Health Organization (WHO) classification.1 PMBL accounts for about 5% of aggressive lymphomas, tends to affect a relatively young population (average age 37 years), and presents a 50% to 60% 5-year failure-free survival rate despite intensive chemotherapy.2 It is characterized by a rapidly growing mass, developing in the anterior upper mediastinum, consisting of large B cells that usually express little if any surface or cytoplasmic immunoglobulin and often lack major histocompatibility complex (MHC) class I and/or class II molecules.3-5 It is now assumed that PMBL derives from a peculiar population of thymic medullary B cells.6,7Attempts to assign PMBL precursor B cells to a specific developmental stage have led to controversial views.8,9 However, recent data based on immunoglobulin gene analysis suggest that PMBL is of post–germinal center origin.10
Although the clinical and pathologic characteristics of PMBL are now well recognized, a tumor-specific gene expression profile and specific chromosomal translocations have not yet been reported. This may be explained by the rarity of the disease and the difficulty to obtain fresh material for molecular studies. BCL2 andBCL6 rearrangements usually observed in DLBL appear to be rare in PMBL.11,12 Comparative genomic hybridization studies have reported frequent overrepresentations of genomic segments of chromosome 9p, Xq, 12q, and 2p.13,14 Several candidate genes have been proposed, among which are the proto-oncogenec-REL and the Janus kinase 2 (JAK2)gene,15 but still, none of them has been specifically assigned to PMBL lymphomagenesis.
Hence, more accurate PMBL gene expression profiling appears necessary not only to improve diagnosis and treatment, but also to understand the molecular alterations involved in the pathogenesis of this particular lymphoma subtype. In a recent study, we used differential display reverse transcription to compare the mRNAs expressed in PMBL with those expressed in nonmediastinal DLBLs (NM-DLBLs).16 We identified the MAL gene as a distinct molecular marker of PMBL. The MAL gene is normally expressed in lymphoid T cells, polarized epithelial cells, and myelin-forming cells.17-19 It encodes a proteolipid believed to participate in membrane microdomains stabilization, intracellular transport, and signaling.20 21 Its expression in PMBL may modify raft dynamics and contribute to neoplastic transformation.
To extend PMBL gene expression profile analysis, we used representational difference analysis (RDA) to isolate genes that are differentially expressed in PMBL versus NM-DLBL. In this report, we describe the identification of a gene that is frequently activated in PMBL and is the human homologue of the mouse immediate-early interleukin 4 (IL-4)–inducible gene FIG1 (interleukin 4–induced gene 1).22
Materials and methods
Tissue specimens and cell lines
We retrieved 45 cases of lymphoid malignancies from the files of the department of Pathology, Hôpital Henri Mondor, Créteil, France. This series included: PMBLs (n = 17), NM-DLBLs (n = 18), B-cell chronic lymphocytic leukemia (n = 2), mantle cell lymphomas (n = 2), Burkitt lymphomas (n = 2), follicular lymphomas (n = 2), and nodal marginal zone B-cell lymphomas (n = 2). All patients with PMBL presented with an initial prominent bulky mediastinal mass. For each case, material consisted of Bouin-, formalin-, or alcohol, formalin, acetic acid (AFA)–fixed pathologic specimens, and frozen specimens were available. The morphologic features were assessed on hematoxylin-eosin–stained sections of paraffin-embedded tissue. All cases were evaluated for B- and T-cell differentiation antigens using the Ventana automated immunostainer (Ventana Medical Systems, Tucson, AZ) and their diaminobenzidine detection kit, according to the manufacturer's recommendations. Where appropriate, antigen retrieval was performed by microwave heating in citrate or EDTA (ethylenediaminetetraacetic acid) buffer. Diagnosis of each case was established by combined histologic and immunohistochemical criteria and the lymphomas were classified according to the WHO classification.1 All cases of PMBL had a CD20+ CD3− immunophenotype.
Normal and reactive lymphoid tissues were used as a control. These included one tonsil from a child with follicular hyperplasia; 3 lymph node biopsies showing benign follicular hyperplasia; one spleen obtained from a patient with autoimmune disorder; and one thymus removed at necropsy from a 40-week-gestation fetus. All specimens were received fresh, and samples were snap frozen or processed immediately.
Highly purified B cells were obtained from tonsillar cell suspensions by positive selection using CD19 magnetic microbeads (Miltenyi Biotec, Bergisch Gladbach, Germany). B cells were activated for 6 days in 25 cm2 culture flasks with irradiated (70 Gy) transfected murine L cells expressing human CD40 ligand and 10 ng/mL IL-4 (Sanofi, Labège, France). Activated B cells were more than 98% CD19+, CD80+, and CD86+.
B-cell lines used in this study included the B-cell precursor acute lymphoblastic leukemia (ALL) cell lines RS 4:11, Nalm6, Nalm16, and 697; the Burkitt lymphoma cell line Ramos; the RL lymphoma cell line bearing a t(14;18) translocation; and 2 cell lines derived from patients with PMBL in relapse, Karpas 1106 and MedB-1.23 24 Other hematopoietic (Jurkat, SUDHL1, Peer and DU528 T-cell lines, HEL erythro-megakaryocytic cell line) and nonhematopoietic (HepG2 hepatoma cell line, MZ2 melanoma cell line, and Hela epithelial cell line) cell lines were also studied.
Representational difference analysis subtraction and screening
Total RNA was extracted from frozen tumor samples using the TRIzol reagent (Life Technologies, Cergy-Pontoise, France). Total RNA (2 μg) from 5 PMBLs and 5 NM-DLBLs was pooled to prepare PMBL and NM-DLBL polyA+ RNAs using the Dynabeads mRNA purification kit (Dynal, Oslo, Norway). cDNA was synthesized by the Superscript Choice system (Life Technologies) according to the manufacturer's instructions. PMBL cDNA was used as the tester and NM-DLBL cDNA as the driver to perform RDA according to the previously published procedure.25 We conducted 2 rounds of hybridization. The driver-to-tester ratio was 1:100 in the first round of hybridization and 1:800 in the second round of hybridization. The differential products were subcloned into pBluescript II KS plasmid and further analyzed for differential expression.
Northern blot analysis
Total RNA was isolated using TRIzol reagent. Total RNA (5 μg) was fractionated in a 1% agarose gel containing formaldehyde and transferred to Hybond-N+ membranes (Amersham Biosciences, Orsay, France). Hybridization was performed in Quick Express Hyb solution (Clontech Laboratories, Palo Alto, CA) with an α-32P–labeled human FIG1 RDA fragment or aβ-actin control probe (Clontech Laboratories) according to the manufacturer's protocol.
DNA sequencing
Plasmid DNA and PCR products were Taq cycle sequenced using the Applied Biosystems PRISM ready reaction Dye-dideoxy Terminator and Dye-Primer sequencing kits (Applied Biosystems, Courtaboeuf, France) and samples run on an ABI 377 DNA sequencer (Applied Biosystems).
Quantitative RT-PCR analysis
Total RNA (2 μg) was reverse transcribed with Superscript II (Life Technologies) in a final volume of 20 μL containing 300 ng random hexamers, according to the manufacturer's instructions. Following enzyme heat inactivation, cDNA was diluted 1:5 in water and stored at −20°C. FIG1 mRNA levels were measured by real-time quantitative reverse transcription–polymerase chain reaction (RT-PCR) using the Light Cycler (Roche Diagnostics, Meylan, France) technology and normalized to the ribosomal S14 mRNA values to control for RNA quality and reverse transcription efficiency. For each real-time PCR run, cDNA was run in duplicate in parallel with 8 standard dilution samples and Karpas 1106 cDNA. FIG1 andS14 standards were purified PCR products that were sequenced and quantitated using a Genequant spectrophotometer (Amersham Biosciences). Karpas 1106 cDNA was included in each PCR run to control for PCR reproducibility among runs and allow relative expression to be compared across all the tested samples. PCRs were performed in Light Cycler capillaries, in a 20 μL volume containing 2 μL Light Cycler-FastStart DNA Master SYBR Green I mix (Roche Diagnostics), 4 mM final MgCl2 concentration, 0.5 μM FIG1 sense and antisense primers (FIG1 sense: 5′ TATGTGGTGGAGAAGGTG 3′,FIG1 antisense: 5′ ATGCGGCTGTACTGGAGTC 3′, purchased from Eurogentec, Serain, Belgium), or 0.2 μM S14 sense and antisense primers (S14 sense: 5′ GGCAGACCGAGATGAATCCTCA 3′,S14 antisense: 5′ CAGGTCCAGGGGTCTTGGTCC 3′, purchased from Biotez GmbH, Berlin, Germany), and 2 μL cDNA diluted 1:3 (corresponding to 13 ng RNA). After preincubation and DNA denaturation at 95°C for 8 minutes, 40 cycles of amplification (95°C for 10 seconds, 62°C for 5 seconds for FIG1, or 65°C for 5 seconds for S14, 72°C for 15 seconds) were performed and PCR products were further denatured at 95°C, annealed at 70°C, and slowly heated to 95°C to perform a melting curve analysis.FIG1/S14 mRNA ratios were determined as mean FIG1value / mean S14 value × 100.
Statistical analysis
To test the differences between PMBL and NM-DLBL, we compared the FIG1/S14 mRNA ratios between these 2 categories of lymphomas using a Fisher exact test and a Mann-Whitney Utest (Statview software; Abacus Concepts, Berkeley, CA).
DNA extraction and Southern blot analysis
DNA was extracted from MedB-1 and Ramos cells, from 5 PMBL and 5 NM-DLBL tumor samples, by proteinase K digestion, phenol/chloroform extraction, and ethanol precipitation.26 After digestion with EcoRI, DNA fragments were electrophoresed in a 0.8% agarose gel in TAE buffer (40 mM Tris-acetate,1 mM EDTA, pH 8.3) and transferred onto a nylon N+ membrane (Amersham Biosciences). Hybridization was performed in Quick Express Hyb Solution (Clontech) with an α-32P–labeled FIG1 probe, spanning nucleotide 444 to 852 of FIG1 cDNA (according to AF 293462).
Results
RDA identification of differential cDNA fragments
RNA isolated from 5 PMBL and 5 NM-DLBL cases was pooled to generate the tester (PMBL) and driver (NM-DLBL) cDNA representations. After 2 rounds of subtractive hybridization and selective PCR amplification, the second difference product, DP2, showed several distinct bands that were resolved in an acrylamide gel (data not shown). Each of these bands was eluted from the gel and cloned into a pBluescript II KS plasmid. Inserts from these clones were used as probes to hybridize Southern blots of initial tester and driver representations, and sequenced when differentially expressed. We found that 14 DpnII fragments originating from 9 different genes were differentially expressed in PMBL versus NM-DLBL cDNA representations (Table1).
Some of these genes, such as elongation factor 2 on chromosome 19pter-q12, and both complement C1r andCD163 on 12p13, were located in chromosomal regions showing frequent gains in PMBL.27 28
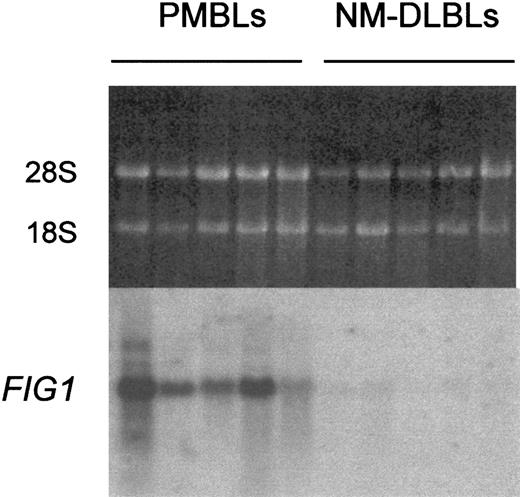
One of these fragments was homologous to the mouse interleukin 4–induced gene 1, identified as an IL-4 immediate-early response gene in splenocytes.22 Specific and recurrent expression of the human FIG1 mRNA in PMBL was studied by Northern blot analysis. The FIG1 RDA fragment hybridized with 1.9-kb transcripts, which were highly expressed in the 5 original PMBLs but low or undetectable in the 5 original NM-DLBLs (Figure1).
Northern blot analysis of
FIG1 expression in PMBL versus NM-DLBL. Total RNA (5 μg) extracted from the 5 original PMBLs and the 5 original NM-DLBLs used to generate RDA representations was loaded on each lane. Ethidium bromide–stained 28S and 18S rRNA bands are shown for comparison (top). Hybond N+ membrane was hybridized with the α-32P–labeled human FIG1 RDA fragment.
Structural features of human FIG1 cDNA and protein
Human FIG1 cDNA sequence was determined by sequencing overlapping RT-PCR, 5′RACE, and 3′RACE fragments, and alignment of these sequences with the RDA fragment and human expressed sequence tags of the Unigene cluster Hs.380 444. The consensus sequence obtained comprised 1781 nucleotides (nt) and was identical to the sequence recently submitted to GenBank by Chu et al, except for a shorter 5′ end (−16 nt).29 This sequence exhibited an open reading frame (ORF) of 1701 nt, with an ATG start codon lying in a strong Kozak context (RnnatgG).30 The 3′ untranslated region of FIG1 was very short, the stop codon being located within the variant polyadenylation signal ATTAAA (data not shown).31 Alignment of the human cDNA sequences on the human genome revealed that the human gene is located within a small region (7 kilobase [kb]) of chromosome 19q13.33, and is composed of 8 exons, showing an exon/intron organization identical to the mouse gene.
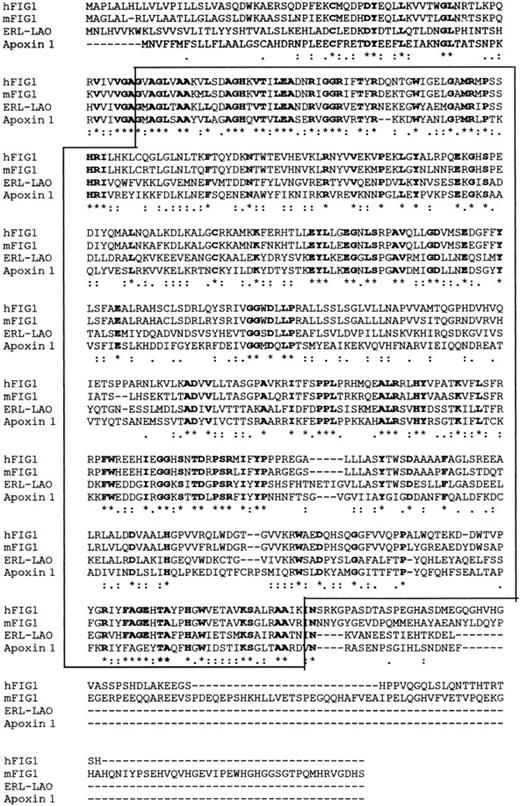
Human FIG1 cDNA encodes a 567 amino acid (aa) protein that contains 4 potential N-glycosylation sites, several potential protein kinase C, casein kinase II, tyrosine kinase, and cyclic adenosine monophosphate/cyclic guanosine monophosphate (cAMP/cGMP) protein kinase phosphorylation sites, and 5 N-myristoylation sites. This protein presents a putative signal peptide (aa 1-22) and a large flavin binding amino-oxidase domain (aa 78-505; Figure2). Human FIG1 protein is 80% homologous to the mouse FIG1 protein in its 505 aa N-terminal part and completely divergent in its 62 aa C-terminal part. Interestingly, human and mouse FIG1 proteins show significant homology with the fish endoplasmic reticulum lumenal L–amino acid oxidase (ERL-LAO, also named AIP for apoptosis-inducing protein) and the snake venom Apoxin 1 (41% and 33% identity, respectively; Figure 2), which both possess an L–amino acid oxidase enzymatic activity and induce apoptosis through H2O2 production.32-34
Sequence comparison of human and mouse FIG1 proteins with ERL-LAO and Apoxin 1 L-amino oxidases.
Sequences were aligned and compared with a clustal program.47 The flavin-containing amino oxidase domain is boxed (CD pfam 01593). (*) indicates positions that have a single, fully conserved residue; (:) indicates strong residue conservation, and (.) indicates weak residue conservation.
FIG1 mRNA expression pattern in normal human tissues and transformed cell lines
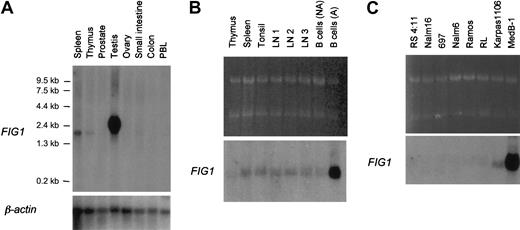
In nonhematopoietic tissues, FIG1 transcripts were not detected in prostate, ovary, small intestine, and colon, but theFIG1 RDA probe hybridized with abundant 2.4-kb transcripts in the testis (Figure 3A). In normal lymphoid tissues, FIG1 transcripts were detected at very low levels in the thymus, spleen, tonsil, reactive lymph nodes, and resting tonsillar B cells (Figure 3B). As originally described in mice and recently in humans,22 29 RT-PCR experiments showed thatFIG1 RNA is induced by IL-4 alone in tonsillar B cells (data not shown). Its expression was highly up-regulated when tonsillar B cells were activated with both IL-4 and CD40 ligand (Figure 3B).
Northern blot analysis of
FIG1 expression in human tissues and B-cell lines. (A) Premade Nylon membrane (Clontech) loaded with 2μg poly A+ RNA per lane from spleen, thymus, prostate, testis, ovary, small intestine, colon, and peripheral blood leukocytes. (B) Total RNA (5 μg) from thymus, spleen, tonsil, reactive lymph nodes (LN1, LN2, LN3), resting tonsillar B cells (B cells NA), and IL-4+CD40L–activated tonsillar B cells (B cells A) was loaded on each lane. Ethidium bromide–stained 28S and 18S rRNA bands are shown for comparison (top). (C) Total RNA (5 μg) from human B-cell lines was loaded on each lane. Ethidium bromide-stained 28S and 18S rRNA bands are shown for comparison (top). Membranes were hybridized with the α-32P–labeled human FIG1 RDA fragment and the Clontech membrane (A) was also hybridized with aβ-actin probe as control.
We then studied FIG1 mRNA expression in a panel of human cell lines (Figure 3C). In B-cell lines, FIG1transcripts were exclusively seen in the PMBL-derived B-cell lines Karpas 1106 and MedB-1, the latter showing a very high level ofFIG1 mRNA expression. FIG1 mRNA expression was not detected in pro-B- (RS 4:11, Nalm16), pre-B- (697, Nalm6), Burkitt (Ramos), and the t(14;18) positive RL cell lines. Other hematopoietic (Jurkat, SUDHL1, Peer, DU528, HEL) and nonhematopoietic (HepG2, MZ2, Hela) cell lines were negative for FIG1 expression (data not shown).
FIG1 mRNA expression in lymphoid malignancies
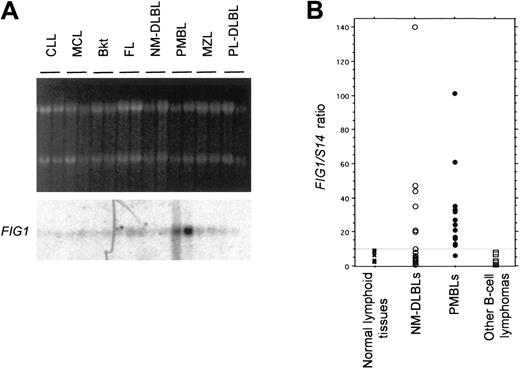
FIG1 mRNA expression was first analyzed by Northern blot in a limited series of different low- and high-grade B-cell lymphoma entities. We selected for this analysis representative cases of lymphomas ranging from naı̈ve B-cell–derived lymphomas to post–germinal center B-cell–derived lymphomas for which frozen material was available. This series included 2 chronic lymphocytic leukemias (CLLs), 2 mantle cell lymphomas (MCL), 2 Burkitt lymphomas (Bkt), 2 follicular lymphomas (FL), 2 marginal zone lymphomas (MZLs), 2 PMBLs, 4 NM-DLBLs including 2 NM-DLBLs used in the initial RDA experiments, and 2 plasmablastic lymphomas (PL-DLBLs). As shown in Figure 4A, FIG1 mRNA was highly expressed in PMBL and weakly expressed in the other B-cell lymphomas tested.
Analysis of
FIG1 expression in normal lymphoid tissues and B-cell lymphomas by Northern blot and quantitative RT-PCR. (A) Northern blot analysis of FIG1 expression in naive B-cell to post–germinal center B-cell–derived lymphomas. Total RNA (5 μg) from chronic lymphocytic leukemias (CLLs), mantle cell lymphomas (MCLs), Burkitt lymphomas (Bkt), follicular lymphomas (FLs), NM-DLBLs, PMBLs, marginal zone lymphomas (MZLs), and plasmablastic DLBLs (PL-DLBLs), was loaded on each lane. Ethidium bromide–stained 28S and 18S rRNA bands are shown for comparison (top). Hybond N+ membrane was hybridized with the α-32P–labeled human FIG1RDA fragment. (B) Quantitative RT-PCR analysis of FIG1expression in normal and tumoral lymphoid tissue samples.FIG1/S14 mRNA ratios were determined as indicated in “Materials and methods.” The FIG1/S14 mRNA ratios of normal lymphoid tissues (1 spleen, 1 thymus, 3 lymph nodes; ×), 18 cases of NM-DLBL (○), 17 cases of PMBL (●), and other B-cell lymphomas (2 CLLs, 2 MCLs, 2 Bkt, 2 FLs, 2 MZLs; ■) are represented in a scatter plot. The dashed line represents the cutoff ratio used to distinguish high and low levels FIG1 gene expression.
We then performed real-time quantitative RT-PCR analysis ofFIG1 gene expression in the normal and neoplastic samples used in Northern blot experiments. We found that theFIG1/S14 mRNA ratios evaluated with this technique were parallel to the level of expression observed in Northern blot analysis. Normal lymphoid tissues (spleen, thymus, lymph nodes) displayedFIG1/S14 mRNA ratios inferior or equal to 10. TheFIG1/S14 mRNA ratio was equal to 1 in purified tonsillar B cells and increased to 40 after IL-4+CD40L stimulation.FIG1/S14 mRNA ratios varied from 12 to 101 in the 5 original PMBLs and were less than 10 in the 5 original NM-DLBLs. All other B-cell lymphomas tested displayed FIG1/S14 mRNA ratios less than 10. We therefore decided to use a FIG1/S14 mRNA cutoff ratio of 10 to distinguish 2 categories of samples: those with highFIG1 gene expression (FIG1/S14 mRNA ratio > 10) and those with low FIG1 mRNA levels (FIG1/S14mRNA ratio ≤ 10).
We then extended our analysis to a larger series of 17 cases of PMBL and 18 cases of NM-DLBL, including the 5 PMBLs and 5 NM-DLBLs used in the RDA experiment. All but one PMBL (16/17) displayed high FIG1gene expression, whereas most NM-DLBLs (12/18) exhibited lowFIG1 mRNA levels (Figure 4B). Among the NM-DLBLs with highFIG1 mRNA levels, 5 were peculiar, because of extranodal origin (one spleen, one skin), suspected origin from the transformation of a follicular and marginal zone lymphoma, respectively (2 cases), or Epstein-Barr virus (EBV) association (one case). The difference between the PMBL and NM-DLBL groups proved significant (Fisher exact test based on the 2 category grading; P = .0003). Moreover, comparison of FIG1/S14 mRNA ratio as a continuous variable in PMBL versus NM-DLBL also demonstrated a significant difference (Mann-Whitney U test, P = .014).
Southern blot analysis of FIG1 gene
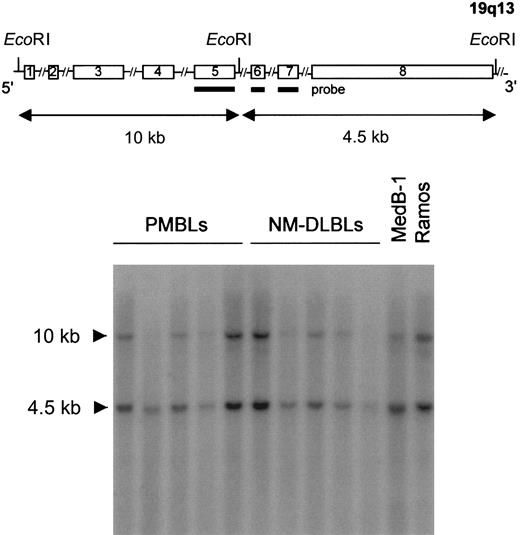
To study whether genomic rearrangements might account forFIG1 gene expression in PMBL, DNAs were extracted from PMBL and NM-DLBL tumor samples, subjected to EcoRI digestion, and analyzed by Southern blot. The blot was hybridized with a FIG1PCR-generated probe spanning exons 5, 6, and 7. This probe hybridized with the expected 10-kb and 4.5-kb DNA fragments in all PMBL and NM-DLBL tumor samples, as well as in the MedB-1 and the Ramos B-cell lines (Figure 5). Hence, the increased expression of FIG1 mRNA in PMBL did not result from major genetic alterations. Furthermore, the signals correlated with the amount of DNA loaded in each lane, thereby ruling out overexpression related to gain of chromosomal material.
Southern blot analysis.
Genomic DNA extracted from 5 PMBLs, 5 NM-DLBLs, and the MedB-1 and Ramos B-cell lines were subjected to EcoRI digestion, agarose gel electrophoresis, nylon N+ membrane transfer, and hybridization with an α-32P–labeled PCR-derivedFIG1 cDNA probe. A schematic map of the FIG1 gene is represented at the top of the figure (not drawn to scale). The probe used (bold line) spans FIG1 exons 5, 6, and 7, and hybridized with 10-kb and 4.5-kb DNA fragments in all samples.
Discussion
Using cDNA representational difference analysis, we identified the FIG1 mRNA as being regularly expressed in PMBL but rarely in NM-DLBL. FIG1 was initially identified in the mouse as an immediate-early IL-4–inducible gene in B splenocytes.22 This B-cell–specific gene was shown to be induced in resting cells within 2 hours in response to IL-4 alone, but not to IL-2, IL-5, or IL-6. This induction was recently demonstrated to be STAT6 dependent.35 We have shown by Northern blot and quantitative RT-PCR the high expression of FIG1 in IL-4–activated human B-cells, in the PMBL-derived B-cell lines MedB-1 and Karpas 1106, and in PMBL as compared with other types of B-cell lymphomas. Since genomic amplification of the FIG1 gene in PMBL was ruled out by Southern blot analysis, these results point to a possible role of the IL-4 signaling pathway in PMBL lymphomagenesis. It was recently reported that IL-4 activation of the MedB-1 B-cell line induced down-regulation of IgG/κ protein expression in a small subset of tumor cells, suggesting that the lack of immunoglobulin expression very frequently observed in PMBL could be due to extrinsic signals, one of which might be IL-4.10 We studied IL-4 expression in our PMBL tissues samples by quantitative RT-PCR, but failed to detect a significant expression of this cytokine (data not shown). IL-4 and IL-13 receptors share the IL-4Rα chain and induce similar cellular responses.36 Whether FIG1 is also an IL-13 target gene remains to be determined.
Another explanation for high FIG1 expression in PMBL could be an activation of the IL-4 signaling pathway through oncogenic events. Oncogenic activation of cytokine signaling pathways in hematopoietic malignancies has already been reported. For example, IL-13 was shown to be secreted by Hodgkin lymphoma (HL) cell lines and to be expressed in Hodgkin and Reed-Sternberg cells in HL.37 IL-13 is thus believed to promote autocrine growth of the neoplastic population in classical Hodgkin lymphoma. Interestingly, JAK2 tyrosine kinase gene is amplified in MedB-1 and was found as part of an amplicon in one case of PMBL.15 As Jak-2 has been shown to be involved in the IL-4 and IL-13 signaling pathway in some nonhematopoietic cell lines,38 one may hypothesize that FIG1up-regulation is related to abnormal JAK2 activity in PMBL.
It is also possible that FIG1 expression in PMBL merely reflects the B-lymphocyte developmental stage at which malignant transformation occurred. FIG1 gene expression is induced in activated B cells. Thus, FIG1 gene expression in PMBL would favor the hypothesis that these lymphomas belong to the activated B-cell–like DLBL group,39 as already suggested by the presence of heavily mutated immunoglobulin genes without evidence of continuing mutational activity in both lymphoma groups.40 41
The protein encoded by the FIG1 gene shares significant homology with secreted apoptosis-inducing L–amino acid oxidases such as Apoxin 1 and ERL-LAO,32-34 suggesting that FIG1 protein might be an ectoenzyme. LAOs catalyze the oxidative deamination of various L–amino acids and produce ammonium and hydrogen peroxide (H2O2). In addition to its ability to induce apoptosis, H2O2 is becoming increasingly recognized as a signal-transducing molecule and appears to be involved in a broad spectrum of signaling pathways.42-44Furthermore, recent studies have shown that some ectoenzymes are also involved in cellular adhesion.45 46 Thus, although the functions of the protein encoded by the FIG1 gene remain to be characterized, it is tempting to speculate that FIG1 activity might somehow be involved in PMBL lymphomagenesis.
In conclusion, we demonstrate in this study the high expression of the IL-4–inducible gene FIG1 in PMBL. Our data suggest that the IL-4/IL-13 pathway may be of significant importance in PMBL lymphomagenesis. Exploration of FIG1 functional properties could give more insight into the oncogenic events involved in this distinct subtype of DLBLs.
We gratefully acknowledge the following pathologists who provided pathologic material: J. Brière, I. Abd Alsamad, A. M. Roucayrol. We thank N. Nio for expert assistance in statistical analysis. We also thank J. Marquet for providing resting and activated tonsillar B cells and S. Legouvello for help in real-time PCR experiments.
Prepublished online as Blood First Edition Paper, November 21, 2002; DOI 10.1182/blood-2002-07-2215.
Supported by a grant from the Association pour la Recherche contre le Cancer (no. 5530) and by the Association pour la Recherche Thérapeutique, Génétique et Immunologique dans les Lymphomes (cofinanced by Roche and Amgen).
The publication costs of this article were defrayed in part by page charge payment. Therefore, and solely to indicate this fact, this article is hereby marked “advertisement” in accordance with 18 U.S.C. section 1734.
References
Author notes
Karen Leroy, Département de Pathologie, Hôpital Henri Mondor, 51 avenue du Maréchal de Lattre de Tassigny, 94010 Créteil, France; e-mail:karen.leroy@hmn.ap-hop-paris.fr.

