Abstract
Adoptive T-cell therapy using CD3/CD28 co-stimulation likely requires in vivo generation of antigen specificity. Because CD28 promotes TH1/TC1 (T1) or TH2/TC2 (T2) differentiation, costimulation may generate donor T1 or T2 cells capable of differentially mediating allogeneic graft-versus-tumor (GVT) effects and graft-versus-host disease (GVHD). Costimulation under T1 or T2 conditions indeed generated murine TH1/TC1 cells secreting interleukin-2/interferon-γ (IL-2/IFN-γ) or TH2/TC2 cells secreting IL-4/IL-5/IL-10. In vivo, allogeneic T1 cells expanded, maintained T1 secretion, and acquired allospecificity involving IFN-γ and IL-5. In contrast, allogeneic T2 cells expanded less and maintained T2 secretion but did not develop significant allospecificity.Allogeneic, but not syngeneic, T1 cells mediated a GVT effect against host-type breast cancer cells, as median survival time (MST) increased from 25.6 ± 2.6 (tumor controls) to 69.2 ± 5.9 days (P < 1.2 × 10⁻⁹). This T1-associated GVT effect operated independently of fasL because T1 cells from gld mice mediated tumor-free survival. In contrast, allogeneic T2 cells mediated a modest, noncurative GVT effect (MST, 29 ± 1.3 days; P < .0019). T1 recipients had moderate GVHD (histologic score, 4 of 12) that contributed to lethality after bone marrow transplantation; in contrast, T2 recipients had minimal GVHD (histologic score, 1 of 12). CD3/CD28 co-stimulation, therefore, generates T1 or T2 populations with differential in vivo capacity for expansion to alloantigen, resulting in differential GVT effects and GVHD.
Introduction
CD28 costimulation plays an important role during T cell activation to promote T cell survival, augment production of cytokines, and overcome T cell anergy.1,2 The use of CD3/CD28-generated T cells has been evaluated as a methodology for the cellular immunotherapy of cancer3 and immuno-augmentation in patients with HIV infection.4-6 The potential application of this approach may reside in the usefulness of CD28 costimulation to promote the generation of a polyclonal T cell receptor repertoire7 with enhanced effector function.8-10 The successful application of this CD28-based immunotherapy approach will likely require the generation of antigen specificity, either through further in vitro culture or in vivo sensitization. Thus, we have evaluated the capacity of CD3/CD28 costimulated T cells to develop specificity to host alloantigens after allogeneic bone marrow transplantation (BMT) to characterize their ability to undergo antigen-driven clonal expansion in vivo. In addition to the acquisition of antigen specificity, it is also likely that the cytokine profile of costimulated T cells may help determine the nature of immunity generated. To this extent, we examined the potential role of T1 or T2 cytokine polarization of costimulated T cells on in vivo immunity after allogeneic BMT.
In allogeneic BMT, antigen-driven expansion of polyclonal CD3/CD28-generated T cells is primarily initiated by host antigen-presenting cells (APCs).11 Previous murine12 and human13 studies have established that donor T cells initiate graft-versus-host disease (GVHD), which is the primary complication of allogeneic BMT. However, donor T cells also mediate the beneficial antitumor effects after allogeneic BMT, which include graft-versus-leukemia (GVL) effects14 or graft-versus-tumor (GVT) effects.15 In this study, we established a murine allogeneic BMT model using the host-type breast cancer cell line (TSA) to evaluate the effects of CD3/CD28-costimulated donor T cells on the generation of GVHD and GVT effects.
One important aspect of CD28 T-cell costimulation is its potential effect in T-cell polarization toward TH1/TC1 (T1) or TH2/TC2 (T2) differentiation. CD28 costimulation was initially shown to stabilize the mRNA of the type 1 cytokine IL-2.2 Further studies indicate that CD28 is relatively unbiased with respect to T-cell differentiation toward type 1 or type 2 cytokine production.16-19 Thus, we hypothesized that CD3/CD28 costimulation under T1- or T2-promoting conditions might generate highly polarized TH1/TC1 and TH2/TC2 populations. Furthermore, T1 and T2 cells appear to play differential roles in mediating GVL effects and GVHD.20 Importantly, studies show that donor T cells shifted toward T2 polarity mediate reduced GVHD.21,22 Taken together, we hypothesized that costimulated T2 cells might result in reduced GVHD compared with costimulated T1 cells and that such a difference might relate to their differential capacity for in vivo allosensitization.
Materials and methods
Animals
C57Bl/6xBalb/c F1 (CB6F1, H-2Kb/d), C57Bl/6 (B6, H-2Kb), and Ly5.1 congenic (H-2Kb) mice were obtained from the Frederick Cancer Research Facility (Frederick, MD). Mice deficient in fasL, gld (B6, H-2Kb), were obtained from The Jackson Laboratory (Bar Harbor, ME). All mice were 6 to 10 weeks old, were maintained in a specific pathogen-free facility at the National Institutes of Health, and were treated on an approved animal protocol.
In vitro generation of TH1/TC1 (T1) and TH2/TC2 (T2) subsets using CD3 and CD28 stimulation
Spleen cells from B6 mice were harvested and ACK lysed (Quality Biological, Gaithersburg, MD). B cells were depleted using goat-antimouse–conjugated magnetic bioparticles (Polysciences, Warrington, PA). To generate CD3/CD28 monoclonal antibody (mAb)–coated beads, M450 Dynabeads (Dynal ASA, Oslo, Norway) were incubated with antimouse CD3 and CD28 mAbs (BD PharMingen, San Diego, CA) in 0.1 M borate solution at 37°C overnight as described previously.23 CD3/CD28 mAb-coated beads were then washed with phosphate-buffered saline (PBS) containing 3% fetal bovine serum (FBS; Gemini Bio-Products, Woodland, CA), 5 mM EDTA (ethylenediaminetetraacetic acid; Quality Biological), and 0.1% sodium azide (Sigma, St Louis, MO) and brought up in the same solution at a concentration of 40 × 106 beads/mL. T1 cells were generated using anti-CD3 and anti-CD28 (CD3/CD28)–coated magnetic beads at a bead/T cell ratio of 3:1 with 20 IU/mL recombinant human IL-2 (rhIL-2; NCI BRB Preclinical Repository, Rockville, MD), 20 ng/mL rhIL-7 (Peprotech, Rocky Hill, NJ), 10 ng/mL recombinant murine IL-12 (rmIL-12; Peprotech), 10 μg/mL antimurine IL-4 mAb clone 11B.11 (NCI BRB Preclinical Repository) and 3.3 mM N-acetyl-cysteine (NAC; Bristol-Myers Squibb, Princeton, NJ) in RPMI 1640 (Mediatech, Herndon, VA) complete media containing 10% FBS, penicillin-streptomycin-glutamine (Life Technologies, Rockville, MD), nonessential amino acids (NEAA) (Life Technologies), and 2-mercaptoethanol (2-ME; Life Technologies). T2 cells were generated using CD3/CD28-coated beads in RPMI complete media with 1000 IU/mL rh IL-2, 20 ng/mL rhIL-7, 1000 U/mL rmIL-4 (Peprotech), and 3.3 mM NAC. Specific cytokine-containing complete media were added to T1 or T2 cultures daily from days 2 to 6 to maintain cell concentration between 0.2 and 1.0 × 10⁶ cells/mL. However, rmIL-12 was only added on day 0 of T1 culture. After 6 days in culture, the T1 and T2 cells were used for BMT experiments, enzyme-linked immunosorbent assays (ELISAs), and CTL assays.
ELISA
T1 and T2 cells were harvested and brought to a final concentration of 0.5 × 10⁶/mL in 24-well plates with or without CD3/CD28 bead addition (bead-cell ratio, 3:1). Supernatants were collected after 24 hours, and cytokine production was evaluated using 2-site ELISAs (IL-2 and IL-5 purchased from R&D Systems, Minneapolis, MN; IL-4, IL-10, and IFN-γ purchased from BioSource, Camarillo, CA). To evaluate the global polarization of T1 and T2 cells, a T1/T2 ratio was determined: the T1 score (average of normalized values of IL-2 and IFN-γ) was divided by the T2 score (average of normalized values of IL-4, IL-5, and IL-10).
CTL assay
To examine the CTL capacity of T1 and T2 subsets, standard chromium 51Cr release assay was used. T1 or T2 effector populations were restimulated with CD3/CD28 beads on day 6 for 24 hours. For evaluation of granule-based killing, trinitrophenyl mouse (TNP)–modified human Jurkat targets labeled with 51Cr (Amersham Pharmacia Biotech, Buckinghamshire, England) were incubated with antimurine CD3, anti-TNP bispecific antibodies, provided by D. Segal (National Institutes of Health [NIH]).24 For evaluation of fas-based cytolysis, the fas-transfected tumor line L1210/fas (H-2Kd) and control L1210 line were used as 51Cr-labeled targets (cell lines provided by P. Henkart, NIH); Ca2+ was quenched to inhibit granule exocytosis by using 5 mM EGTA (ethyleneglycotetraacetic acid) and 0.5 mM MgCl2 in RPMI 1640 complete media.25 Fas-blocking studies were performed in the presence of rhFas:Fc (Alexis, Switzerland) at a concentration of 20 μg/mL. Supernatants were collected 6 hours after the incubation of effector and target cells to determine the specific lysis of target cells. Collected supernatants were transferred to LumaPlates (Packard, Meriden, CT) and read using Microplate Scintillation and Luminescence Counter (Packard).
Bone marrow transplantation
Host CB6F1 (H-2Kb/d) mice were lethally irradiated (1100 cGy; cesium 137Cs γ-radiation source; Gamma Cell 40; Atomic Energy of Canada, Ottawa, Canada) and reconstituted with parental B6 bone marrow (BM) cells (5 × 10⁶ cells) intravenously. In one experiment, T cells were depleted from B6 BM cells using antimouse CD4 and anti-CD8 mAbs (NCI BRB, Frederick, MD) and goat anti–rat immunoglobulin G (IgG) (MicroBeads; Miltenyi Biotec, Bergisch Gladbach, Germany). The TSA control group received 0.1 × 10⁶ TSA cells (spontaneous adenocarcinoma line of Balb/c origin, H-2Kd) intravenously. Other mice received TSA cells followed by a separate intravenous injection of the in vitro cultured T1 or T2 cells (10 × 106). Recipient mice were observed for survival and weight changes after BMT.
Histology
Three mice from each BMT group were harvested on day 28 after BMT for histologic evaluation. Liver, lung, gastrointestinal tract, and skin were fixed in formaldehyde and stained with hematoxylin and eosin. Quantitative analysis of GVT and GVHD was conducted using a score system ranging from 0 to 4, where 0 was the normal and 4 the maximal level of tumor or GVHD. Scoring of tumor and GVHD was performed by a pathologist (M.A.E.) in a blinded fashion. For GVHD measurements, 3 organs (liver, small intestine, and stomach) were scored separately, and the total was determined for each mouse giving a maximum cumulative GVHD score of 12.
Flow cytometry
On days 0 and 6 of culture, T1 and T2 cells were harvested for flow cytometric analysis to evaluate CD4 and CD8 subsets. Antimouse CD3 phycoerythrin (PE), CD4 fluorescein isothiocyanate (FITC), and CD8 allophycocyanin (APC) (BD PharMingen) mAbs were used to stain T1 and T2 cells. Three-color flow cytometric analysis was performed using FACSCalibur (BD Biosciences, San Jose, CA) and CellQuest software (BD Biosciences). Five to 10 thousand live events were acquired for analysis using propidium iodide stain to exclude dead cells.
In vivo tracking of T1/T2 populations and TSA tumor cells
In some experiments, T1 and T2 cells were generated using splenic T cells from Ly5.1 C57Bl/6 congenic mice. In vivo T1 and T2 cells were tracked using anti-CD45.1 PE (BD PharMingen). Lung, liver, and spleen were harvested on days 5, 14, and 48 after BMT. Single-cell suspensions from these tissues were labeled with antibodies against murine CD45.1, CD8, CD4, H-2Kb, and H2-Kd conjugated with FITC, PE, or APC for flow cytometric analysis.
In vivo allosensitization in T1/T2 recipients: cytokine capture assay
Spleen cells obtained from recipients at day 5 after BMT were divided into 4 in vitro stimulation conditions: no stimulation, CD3/CD28 stimulation, B6 dendritic cell (DC) stimulation, and CB6F1 DC stimulation. DCs were obtained by culturing bone marrow cells for 4 days in the presence of 1000 U/mL rmIL-4 and 1000 U/mL recombinant murine granulocyte macrophage–colony-stimulating factor (rmGM-CSF; Peprotech); lipopolysaccharide (LPS; 1 μg/mL) was added to the final 24 hours of DC culture. After 24 hours of spleen cell stimulation, supernatants were collected for cytokine ELISA, and cells were evaluated for single-cell cytokine secretion by cytokine capture flow cytometry. Cells were labeled with IFN-γ or IL-4 catch reagent (Miltenyi Biotec, Germany), followed by 45-minute incubation of cells in warm media for cytokine secretion at 37°C under slow rotation. Cells were then washed, labeled with IFN-γ or IL-4 detection antibody (PE) and other surface antibodies (anti-CD4 FITC and anti-CD8 APC mAbs), washed, and analyzed by flow cytometry.
Statistics
Survival analysis was performed using the nonparametric, 2-sided, matched-rank analysis of log rank test. For small sample size comparison, the Student t test was used. P < .05 was considered statistically significant.
Results
CD3/CD28-generated T1/T2 subsets
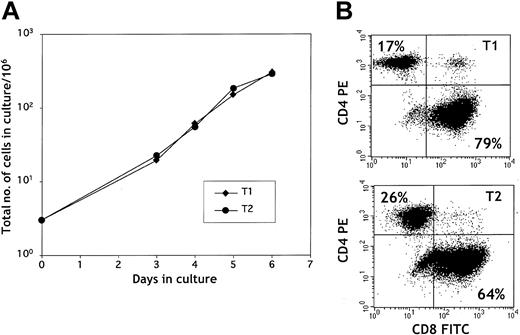
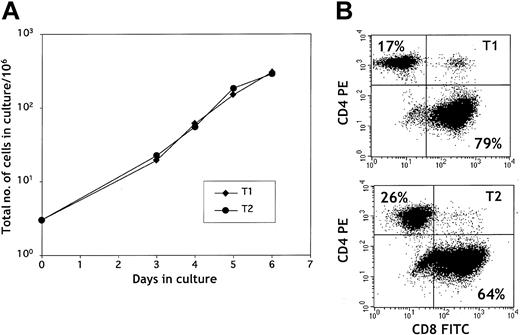
Upon stimulation with CD3/CD28-coated beads, splenic T cells expanded rapidly during 6 days of culture (Figure 1A). T1 and T2 cultures showed similar expansion patterns with more than a 100-fold increase in total cell number by day 6. The CD4/CD8 ratio at culture initiation was typically approximately 1:1. As shown in Figure 1B, CD3/CD28 stimulation preferentially expanded CD8+ T cells in both the T1 and the T2 culture conditions. CD28 costimulation enhanced T1 and T2 expansion because T1 and T2 cells stimulated with anti-CD3 alone had reduced expansion compared with anti-CD3, anti-CD28–generated T1 and T2 cells (data not shown).
T1 and T2 growth. (A) T1 and T2 growth curve. T cells were stimulated with anti-CD3/anti-CD28–coated beads on day 0 and were cultured in type 1 or type 2 media conditions for 6 days. (B) Surface flow cytometry plot of CD4+ and CD8+ T1 and T2 cells. T1 and T2 cells were stained with anti-CD4 PE and anti-CD8 FITC mAbs on day 6 of culture. The percentages of CD4+ and CD8+ T cells are indicated in the upper left and lower right quadrants, respectively.
T1 and T2 growth. (A) T1 and T2 growth curve. T cells were stimulated with anti-CD3/anti-CD28–coated beads on day 0 and were cultured in type 1 or type 2 media conditions for 6 days. (B) Surface flow cytometry plot of CD4+ and CD8+ T1 and T2 cells. T1 and T2 cells were stained with anti-CD4 PE and anti-CD8 FITC mAbs on day 6 of culture. The percentages of CD4+ and CD8+ T cells are indicated in the upper left and lower right quadrants, respectively.
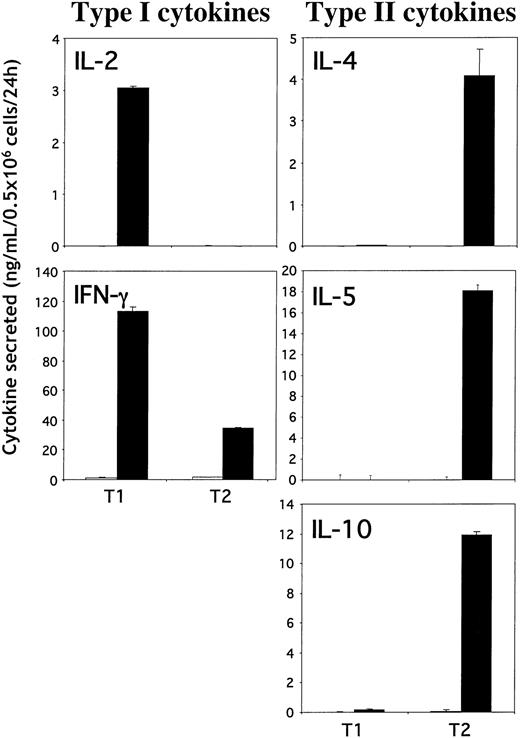
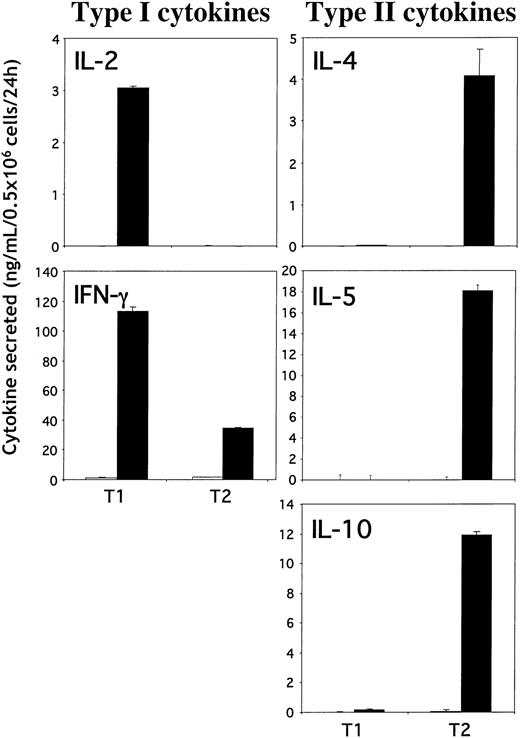
T cells propagated by CD3/CD28 stimulation under T1 or T2 conditions were evaluated for cytokine secretion using ELISA (Figure 2). By day 6 in culture, T1 and T2 cells were rested because no cytokine production was detected without further restimulation. T1 cells produced high levels of IL-2 and IFN-γ with few or undetectable levels of IL-4, IL-5, and IL-10 upon CD3/CD28 restimulation. In contrast, T2 cells did not produce any detectable levels of IL-2, and they secreted reduced levels of IFN-γ compared with T1 cells but produced high levels of IL-4, IL-5 and IL-10. These results demonstrate that CD3/CD28 costimulation under T1- or T2-promoting conditions generates highly enriched murine T1 and T2 populations.
T1 and T2 cytokine production. Type 1 (left panels) and type 2 (right panels) cytokine production by T1 and T2 cells. T1 and T2 cells were restimulated (or not) with anti-CD3/anti-CD28–coated beads on day 6. Supernatants were collected 24 hours after stimulation, and cytokine production (IFN-γ, IL-2, IL-4, IL-5, and IL-10) was measured using ELISA. Results shown are mean ± SD.
T1 and T2 cytokine production. Type 1 (left panels) and type 2 (right panels) cytokine production by T1 and T2 cells. T1 and T2 cells were restimulated (or not) with anti-CD3/anti-CD28–coated beads on day 6. Supernatants were collected 24 hours after stimulation, and cytokine production (IFN-γ, IL-2, IL-4, IL-5, and IL-10) was measured using ELISA. Results shown are mean ± SD.
Cytolytic function of T1/T2 subsets
The cytotoxic ability of T1/T2 subsets was characterized using 51Cr CTL assays. A representative 51Cr CTL assay (Figure 3A) shows that, compared with the T2 subset, the T1 subset had an enhanced ability to lyse a fas-expressing target, L1210/fas, in Ca2+-neutralized conditions. T1-mediated lysis of L1210/fas was completely abrogated by rhFasL:Fc chimera, indicating that lysis occurred through fas/fasL interactions. To characterize granule-based cytolytic activity of T1 and T2 subsets, Jurkat cells bound to bispecific antibody (anti-TNP/anti-CD3) were used as target (Figure 3B). Compared with the T1 subset, T2 cells were enhanced in their ability to lyse the Jurkat cells. Therefore, T1 cells used primarily fas-mediated lysis, whereas T2 cells used primarily granule-based lysis.
T1 and T2 cytolytic function. (A) FasL-mediated cytolytic function. T1 and T2 populations were harvested on day 6 of culture and restimulated overnight with anti-CD3/anti-CD28–coated beads for potential fasL induction. Effector T cells were then coincubated with 51Cr-labeled L1210/fas targets in Ca2+-free media to inhibit granule exocytosis. The T1 effector population was additionally evaluated in the presence of the fasL blocking agent (rhfasL:fc). (B) Granule-mediated cytolytic function. T1 and T2 populations were harvested on day 6 of culture and coincubated with 51Cr-labeled, TNP-modified human Jurkat cells in the presence of an anti-CD3/anti-TNP bispecific antibody.
T1 and T2 cytolytic function. (A) FasL-mediated cytolytic function. T1 and T2 populations were harvested on day 6 of culture and restimulated overnight with anti-CD3/anti-CD28–coated beads for potential fasL induction. Effector T cells were then coincubated with 51Cr-labeled L1210/fas targets in Ca2+-free media to inhibit granule exocytosis. The T1 effector population was additionally evaluated in the presence of the fasL blocking agent (rhfasL:fc). (B) Granule-mediated cytolytic function. T1 and T2 populations were harvested on day 6 of culture and coincubated with 51Cr-labeled, TNP-modified human Jurkat cells in the presence of an anti-CD3/anti-TNP bispecific antibody.
T1/T2-mediated GVHD and GVT effects
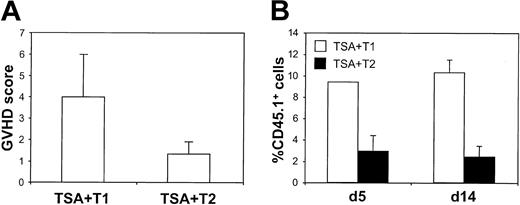
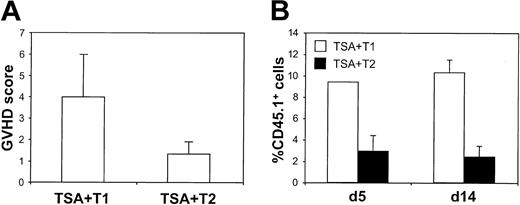
To evaluate the ability of CD3/CD28-generated T1 and T2 subsets to induce GVT and GVHD effects, treatment groups were killed on day 28 after BMT for histologic analysis. T1 recipients had mild to moderate GVHD of the small intestine, liver, and stomach, whereas T2 recipients had minimal evidence of histologic GVHD. As shown in Figure 4A, T1 and T2 recipients had mean GVHD scores of 4.0 ± 1.2 and 1.3 ± 0.6, respectively (maximal GVHD score, 12; T1 greater than T2; P < .037). To further examine the role of T1 and T2 effector populations in mediating GVHD, T cells from Ly5.1 B6 congenic mice were used to generate T1 and T2 cultures. As shown in Figure 4B, flow cytometric analysis of hepatic single-cell suspensions demonstrated that T1 cells were present in this GVHD target tissue at a higher frequency than T2 cells at both day 5 (9.4% ± 2.0% vs 2.9% ± 1.5%; P < .030) and day 14 (15.1% ± 1.0% vs 2.2% ± 0.5%; P < .0035) after BMT.
T1- and T2-mediated GVHD effects. (A) Histologic GVHD score. Liver, small intestine, and stomach (day 28 after BMT) were scored for GVHD (range, 0-4). The score from each organ was combined for each recipient, and these total scores were averaged (n = 3; maximum GVHD score, 12). (B) T1 and T2 infiltration of liver. Allogeneic T1 and T2 populations were generated from Ly5.1 B6 donors. On days 5 and 14 after BMT, recipient livers were harvested, and the single-cell suspensions were evaluated by flow cytometry for the presence of CD45.1+ T1 or T2 cells. The percentage of CD45.1+ T cells was determined for each recipient (n = 3) in the treatment cohort with data represented as mean ± SEM.
T1- and T2-mediated GVHD effects. (A) Histologic GVHD score. Liver, small intestine, and stomach (day 28 after BMT) were scored for GVHD (range, 0-4). The score from each organ was combined for each recipient, and these total scores were averaged (n = 3; maximum GVHD score, 12). (B) T1 and T2 infiltration of liver. Allogeneic T1 and T2 populations were generated from Ly5.1 B6 donors. On days 5 and 14 after BMT, recipient livers were harvested, and the single-cell suspensions were evaluated by flow cytometry for the presence of CD45.1+ T1 or T2 cells. The percentage of CD45.1+ T cells was determined for each recipient (n = 3) in the treatment cohort with data represented as mean ± SEM.
On gross and microscopic examinations, mice in the tumor control group had extensive infiltration of poorly differentiated carcinoma cells in the lungs by day 28 after BMT. Recipients of T2 cells did not have a significant reduction in gross or microscopic evidence of tumor (Figure 5A). In marked contrast, T1 recipients had either no histologic evidence of tumor (n = 2) or a small focus of carcinoma cells intravascularly (n = 1). The histologic tumor score for TSA control recipients was 4.0 ± 0.0, whereas T1 recipients had a score of 0.7 ± 0.7 (TSA control greater than T1; P < .019). The level of tumor infiltration was further assessed by flow cytometry at day 14 after BMT. In the tumor control and T2-treated cohort, TSA carcinoma cells were detected in the lung at similar frequencies (Figure 5B; 3.4% ± 1.0% and 2.8% ± 1.4%, respectively). In contrast, the T1 recipients had a markedly reduced frequency of TSA carcinoma cells (0.03% ± 0.006%). Consequently, histologic and flow cytometric evaluation showed that the T1 population mediated a greatly enhanced GVT effect compared with the T2 population. T1/T2 cell tracking experiments (Figure 5C) demonstrated that the T1 cultured cells were detected more frequently than T2 cultured cells in the lungs at day 5 after BMT (27.9% ± 3.3% vs 5.6% ± 1.0%; P < .012). However, by day 14 after BMT, the frequency of detecting T1 and T2 cultured cells in the lungs was similar (11.1% ± 2.8% vs 10.3% ± 1.1%; P < .41).
T1- and T2-mediated GVT effects. (A) Lung histology. T1 and T2 recipient lungs were harvested at day 28 after BMT, and the degree of tumor infiltration was compared with that of BMT and TSA tumor control mice. Tumor was scored on a scale of 0 to 4 (n = 3 per treatment group), with the mean ± SEM shown. (B) Pulmonary tumor infiltrate. A single-cell suspension of lung tissue was isolated at day 14 after BMT and evaluated for the presence of TSA tumor cells, defined by their flow cytometric expression of H-2Kd and absence of H-2Kb (n = 3 recipients per BMT group, with mean ± SEM shown). (C) Pulmonary T1 and T2 infiltrates. A pulmonary single-cell suspension was obtained on days 5 and 14 after BMT. The T1 and T2 populations were generated from Ly5.1 B6 congenic mice and evaluated by flow cytometry using the CD45.1 marker. Values are shown as mean ± SEM (n = 3).
T1- and T2-mediated GVT effects. (A) Lung histology. T1 and T2 recipient lungs were harvested at day 28 after BMT, and the degree of tumor infiltration was compared with that of BMT and TSA tumor control mice. Tumor was scored on a scale of 0 to 4 (n = 3 per treatment group), with the mean ± SEM shown. (B) Pulmonary tumor infiltrate. A single-cell suspension of lung tissue was isolated at day 14 after BMT and evaluated for the presence of TSA tumor cells, defined by their flow cytometric expression of H-2Kd and absence of H-2Kb (n = 3 recipients per BMT group, with mean ± SEM shown). (C) Pulmonary T1 and T2 infiltrates. A pulmonary single-cell suspension was obtained on days 5 and 14 after BMT. The T1 and T2 populations were generated from Ly5.1 B6 congenic mice and evaluated by flow cytometry using the CD45.1 marker. Values are shown as mean ± SEM (n = 3).
To rule out the possibility that BM-derived T cells were major contributors to the observed GVHD and GVT effects after T1 and T2 cell administration, an additional allogeneic BMT experiment was performed using T cell–depleted (TCD) BM cells. The overall result of this experiment was similar to that observed with non-TCD BM. Two of 5 T1 recipients and 0 of 5 T2 recipients survived long-term (more than 49 days after BMT). Furthermore, evaluation of a cohort of such TCD BM recipients at day 14 after BMT demonstrated that T1 recipients benefited from a GVT effect (percentage of TSA tumor cells in pulmonary single-cells suspension by flow cytometry: 0.04% ± 0.02%; n = 3), whereas T2 recipients had evidence of tumor progression (percentage of TSA cells: 1.1% ± 0.1%; n = 3). In addition, similar to results with the non-TCD BMT cohort, T1-cell administration with TCD BMT was associated with significant GVHD. A high frequency of T1 cells infiltrated the liver at day 5 and day 14 after BMT (4.7% ± 0.9% and 12.7% ± 0.9%, respectively; n = 3 subjects per time point), and 3 of 5 T1 recipients died of GVHD. As predicted, T2 cell administration during TCD BMT was associated with reduced T2-cell infiltration of the liver at day 5 and day 14 after BMT (1.1% ± 0.2% and 3.8% ± 0.5%, respectively; n = 3), but lethality from GVHD was not observed.
T1/T2 subsets mediate allospecific GVT effects
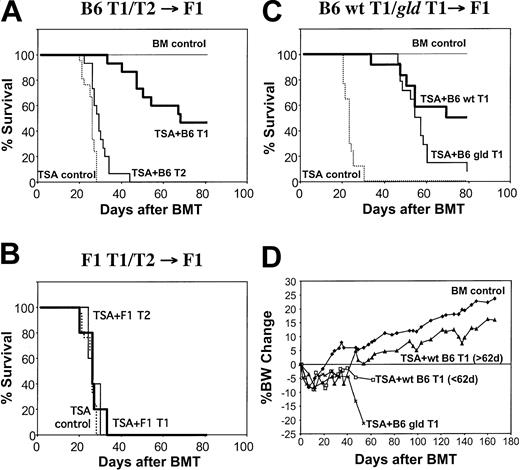
The potent GVT effect mediated by the T1 subset resulted in a significant prolongation of survival. T1 recipients had a median survival time of 69.2 ± 5.9 days after BMT, whereas the tumor control group had a median survival time of 25.6 ± 2.6 days (T1 greater than TSA control; P < 1.2 × 10⁻⁹Figure 6A). Although T2 recipients did not have a significant reduction in tumor burden by histologic or flow cytometric analysis, T2 recipients had a minor but statistically significant prolongation of survival compared with tumor controls (median survival time, 29 ± 1.3 days; P < .0019). The T1- and T2-mediated GVT effect required alloreactivity because syngeneic T1 and T2 populations did not prolong survival (Figure 6B). Long-term survivors of allogeneic T1 cell recipients appeared to be free of tumor and significant GVHD. Day-83 histology showed an absence of TSA carcinoma cells and GVHD lesions. The finding that surviving T1 recipients gained significant weight (Figure 6D) provides further evidence that T1 administration was associated with nominal ongoing GVHD. In contrast, the use of unmanipulated donor T cells at doses that mediated protective GVT effects against the TSA breast cancer cell line was associated with severe GVHD.26
T1- and T2-mediated allogeneic GVT effects. (A) Allogeneic BMT model. CB6F1 mice were lethally irradiated and given B6 BM cells on day 0. All mice received 0.1 × 10⁶ TSA breast cancer cells except for the BM control group (n = 7). Some mice received only the donor B6 BM cells (TSA control; n = 28), whereas other mice received BM supplemented with 10 × 106 in vitro generated donor B6 T1 (n = 15) or T2 (n = 15) cells. (B) Syngeneic BMT model. CD3/CD28-generated T1 and T2 populations were generated from CB6F1 mice and administered to lethally irradiated syngeneic CB6F1 hosts inoculated with TSA breast cancer cells (n = 5 per T1 and T2 BMT groups). (C) Allogeneic BMT model using fasL-deficient gld T1 cells. T1 cells from B6 wild-type (n = 12) or B6 gld (n = 14) mice were generated using CD3/CD28 stimulation and administered to lethally irradiated allogeneic CB6F1 hosts inoculated with TSA breast cancer cells. (D) Percentage body weight change (from day 0).
T1- and T2-mediated allogeneic GVT effects. (A) Allogeneic BMT model. CB6F1 mice were lethally irradiated and given B6 BM cells on day 0. All mice received 0.1 × 10⁶ TSA breast cancer cells except for the BM control group (n = 7). Some mice received only the donor B6 BM cells (TSA control; n = 28), whereas other mice received BM supplemented with 10 × 106 in vitro generated donor B6 T1 (n = 15) or T2 (n = 15) cells. (B) Syngeneic BMT model. CD3/CD28-generated T1 and T2 populations were generated from CB6F1 mice and administered to lethally irradiated syngeneic CB6F1 hosts inoculated with TSA breast cancer cells (n = 5 per T1 and T2 BMT groups). (C) Allogeneic BMT model using fasL-deficient gld T1 cells. T1 cells from B6 wild-type (n = 12) or B6 gld (n = 14) mice were generated using CD3/CD28 stimulation and administered to lethally irradiated allogeneic CB6F1 hosts inoculated with TSA breast cancer cells. (D) Percentage body weight change (from day 0).
Because of the preferential use of fasL-mediated lysis by the CD3/CD28-costimulated T1 cells in vitro, we hypothesized that T1 cells genetically deficient in fasL may mediate a reduced GVT effect in vivo. Contrary to our hypothesis, we found that recipients of allogeneic T1 cells generated from gld mice had a significant survival advantage compared with TSA tumor control recipients (median survival time, 55.5 ± 2.8 days vs 23.1 ± 0.7 days; P < .0001) (Figure 6C). In spite of this clear allogeneic GVT effect, recipients of fasL-deficient T1 cells had reduced long-term survival compared with the wild-type T1 cell control group (median survival time, 55.5 ± 2.8 days vs 74.5 ± 4.9 days; P < .046). Reduced long-term survival in recipients of fasL-deficient T1 cells appeared to be related to ongoing GVHD because such recipients had progressive weight loss (Figure 6C), but there was no gross observation of pulmonary tumors at the time of premorbidity examination (day 49 after transplantation; n = 3 mice).
T1 cells preferentially expand to alloantigen in vivo
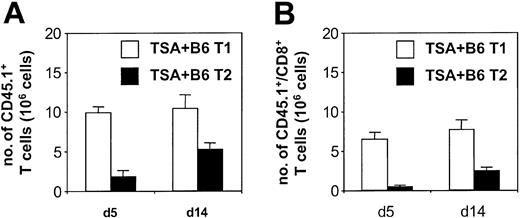
In vivo T-cell tracking studies using the CD45.1 marker demonstrated that the donor B6 T1 subset expanded in CB6F1 hosts to a greater degree than the T2 subset (Figure 7A). The total number of splenic CD45.1+ cells on day 5 (9.8 ± 0.7 × 10⁶ cells) and day 14 (10.4 ± 1.7 × 10⁶ cells) after BMT in T1 recipients was comparable to the total number of cells injected on day 0 (10 × 106 cells). Because the T1 cells were also detected in liver and lung, these data indicate that there was an overall expansion of the T1 inocula in vivo. Syngeneic controls receiving 10 × 106 T1 cells had only 2.3 ± 0.4 × 10⁶ T1 cells per spleen on day 5 after BMT, indicating that expansion of the T1 population was attributed to alloreactivity. Figure 7B demonstrates that CD4+ T cells (day 5, 3.3 ± 0.1 × 10⁶; day 14, 2.7 ± 0.5 × 10⁶) and CD8+ T cells (day 5, 6.5 ± 0.8 × 10⁶; day 14, 7.6 ± 1.3 × 10⁶) derived from the T1 cultured cells expanded in vivo. Compared with T1 cells, the T2 cells had reduced capacity to expand in vivo by day 5 (1.8 ± 0.8 × 10⁶ T2 cells per spleen; T1 greater than T2; P < .0083) and day 14 (5.2 ± 0.8 × 10⁶ T2 cells per spleen; T1 greater than T2; P < 0.037) measurements. These T2 values in allogeneic BMT were not increased compared with T2 injection into syngeneic recipients (2.1 ± 0.1 × 10⁶ cells day 5 after BMT). Overall, these results indicate that the T1 subset preferentially expanded in response to alloantigen in vivo, with CD4+ and CD8+ T cells contributing to the expansion.
In vivo presence of T1 and T2 populations after allogeneic BMT. (A) Absolute numbers of splenic T1 or T2 cells after BMT. CD3/CD28-generated T1 and T2 populations were derived from Ly5.1 B6 donors and administered to lethally irradiated CB6F1 hosts inoculated with TSA breast cancer cells. Spleens were harvested and counted at days 5 and 14 after BMT, and the fraction of CD45.1+ cells was determined by flow cytometry with subsequent calculation of absolute splenic T1 or T2 cells (n = 3 per BMT group; mean ± SEM shown). (B) Absolute number of splenic CD8+ T1 or T2 cells after BMT. Samples from the experiment described in panel A were additionally evaluated by 3-color flow cytometry for CD8+/CD45.1+ cells. (n = 3 per BMT group; mean ± SEM shown).
In vivo presence of T1 and T2 populations after allogeneic BMT. (A) Absolute numbers of splenic T1 or T2 cells after BMT. CD3/CD28-generated T1 and T2 populations were derived from Ly5.1 B6 donors and administered to lethally irradiated CB6F1 hosts inoculated with TSA breast cancer cells. Spleens were harvested and counted at days 5 and 14 after BMT, and the fraction of CD45.1+ cells was determined by flow cytometry with subsequent calculation of absolute splenic T1 or T2 cells (n = 3 per BMT group; mean ± SEM shown). (B) Absolute number of splenic CD8+ T1 or T2 cells after BMT. Samples from the experiment described in panel A were additionally evaluated by 3-color flow cytometry for CD8+/CD45.1+ cells. (n = 3 per BMT group; mean ± SEM shown).
T1/T2 populations maintain global cytokine polarization in vivo
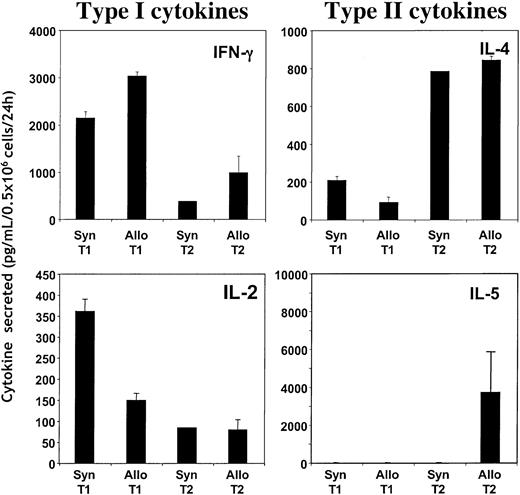
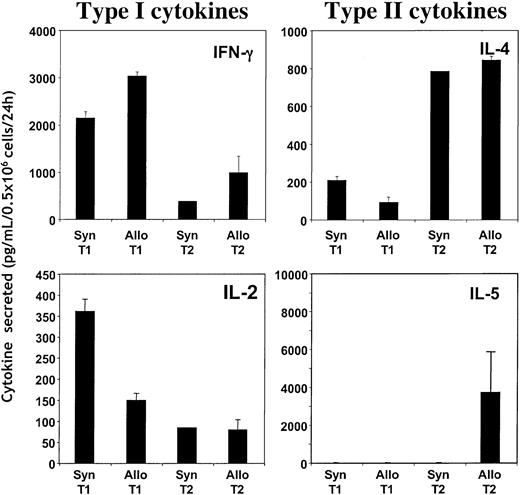
We then evaluated the cytokine profile of in vivo–expanded T1 and T2 populations to determine whether the polarized T1 and T2 phenotypes were maintained. When day-5 post-BMT spleen cells were stimulated with CD3/CD28-coated beads, allogeneic and syngeneic T1 recipients had greater levels of IFN-γ and IL-2 production than T2 recipients (trend toward statistical significance: P < .06 and P < .07, respectively) (Figure 8). In contrast, day-5 post-BMT spleen cells from allogeneic and syngeneic T2 recipients secreted increased IL-4 on CD3/CD28 stimulation compared with T1 recipients (P < 1.3 × 10⁻⁵). Similarly, increased production of IL-5 and IL-10 on CD3/CD28 stimulation was observed in allogeneic T2 recipients but not in syngeneic T2 recipients compared with allogeneic and syngeneic T1 recipients (data not shown). The ratio of T1/T2 cytokine production after CD3/CD28 stimulation in recipients of T1 or T2 populations was markedly different (T1/T2 ratio, 4.6 ± 1.2 vs 0.44 ± 0.02, respectively; P < .01). These results demonstrate that the cytokine profile of T1 and T2 populations was generally maintained under conditions of syngeneic and allogeneic BMT.
Stability of T1 and T2 global cytokine polarity after syngeneic or allogeneic BMT. Ly5.1 B6 T1 and T2 populations were generated in vitro through CD3/CD28 costimulation and were injected into lethally irradiated syngeneic B6 or allogeneic CB6F1 hosts (n = 4 per treatment group). On day 5 after BMT, splenic cells were isolated and restimulated with CD3/CD28-coated beads for 24 hours. Resultant supernatants were evaluated for cytokine content using ELISA. Results shown are mean ± SEM for each treatment group.
Stability of T1 and T2 global cytokine polarity after syngeneic or allogeneic BMT. Ly5.1 B6 T1 and T2 populations were generated in vitro through CD3/CD28 costimulation and were injected into lethally irradiated syngeneic B6 or allogeneic CB6F1 hosts (n = 4 per treatment group). On day 5 after BMT, splenic cells were isolated and restimulated with CD3/CD28-coated beads for 24 hours. Resultant supernatants were evaluated for cytokine content using ELISA. Results shown are mean ± SEM for each treatment group.
Costimulated T1 cells, but not T2 cells, acquire allospecificity in vivo
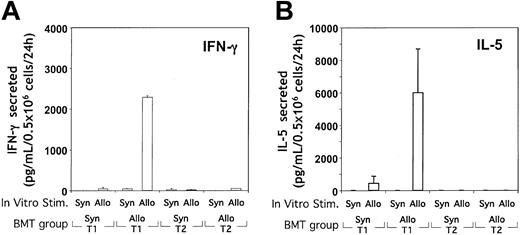
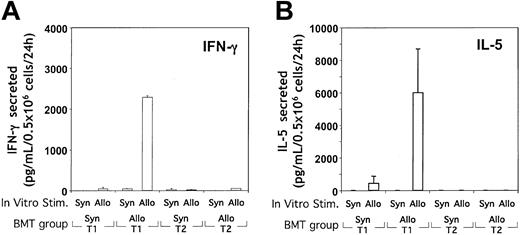
To determine the capacity of the T1 and T2 populations to acquire allospecificity in vivo, post-BMT spleen cells were stimulated in vitro with either allogeneic or syngeneic DCs. Upon transfer of B6-type T1 cells into CB6F1 allogeneic hosts, spleen cells produced high levels of IFN-γ in response to CB6F1 DCs but not in response to B6 DCs (Figure 9A). The magnitude of allospecific IFN-γ secretion was comparable to the level obtained through CD3/CD28 restimulation. In contrast, the transfer of CB6F1-type T1 cells into syngeneic CB6F1 hosts did not result in spleen cell secretion of IFN-γ in response to either DC population. Surprisingly, in addition to IFN-γ, recipients of allogeneic T1 cells also secreted high levels of IL-5 in an allospecific manner (Figure 9B). Other cytokines examined—IL-2 (less than 15 pg/mL), IL-4 (less than 8 pg/mL), and IL-10 (less than 24 pg/mL) were nonspecific in response to allostimulus. In marked contrast to the high level of allospecific cytokine release in allogeneic T1 recipients, recipients of allogeneic T2 cells had no detectable allospecific secretion of T1 or T2 cytokines.
Determination of the acquisition of alloreactive T cells in T1 and T2 recipients. (A, B) T1 and T2 populations were generated from either syngeneic CB6F1 or allogeneic Ly5.1 B6 donor mice and administered intravenously to lethally irradiated CB6F1 mice. On day 5 after BMT, splenic cells were isolated and stimulated in vitro with either syngeneic (B6) or allogeneic (CB6F1) DCs (10:1 T cell/DC ratio). After 24 hours of stimulation, the supernatants were harvested and tested for cytokine content (IFN-γ, IL-2, IL-4, IL-5, and IL-10) using ELISA. Results, which represent the only cytokines detected, are shown as mean ± SEM of values obtained (n = 5 per treatment group).
Determination of the acquisition of alloreactive T cells in T1 and T2 recipients. (A, B) T1 and T2 populations were generated from either syngeneic CB6F1 or allogeneic Ly5.1 B6 donor mice and administered intravenously to lethally irradiated CB6F1 mice. On day 5 after BMT, splenic cells were isolated and stimulated in vitro with either syngeneic (B6) or allogeneic (CB6F1) DCs (10:1 T cell/DC ratio). After 24 hours of stimulation, the supernatants were harvested and tested for cytokine content (IFN-γ, IL-2, IL-4, IL-5, and IL-10) using ELISA. Results, which represent the only cytokines detected, are shown as mean ± SEM of values obtained (n = 5 per treatment group).
To estimate the precursor frequency of allospecific TH1 and TC1 cells emerging after allogeneic T1 administration, a flow-cytometry–based cytokine capture assay was performed. As shown in Figure 10A-B, recipients of allogeneic T1 cells had a high frequency of CD4+ and CD8+ T cells capable of secreting IFN-γ specifically on allogeneic DC stimulation. The frequency of allospecific IFN-γ secretion in TH1 and TC1 cells was similar to that obtained with polyclonal CD3/CD28 stimulation (data not shown). In contrast, recipients of allogeneic T2 cells did not demonstrate detectable CD4- or CD8-mediated IFN-γ or IL-4 secretion on allostimulation. In summary, these ELISA and flow cytometry data indicate that the costimulated T1 population, but not the T2 population, was capable of CD4+ and CD8+ T cell expansion toward alloantigen in vivo and that this specificity involved a classical T1 cytokine (IFN-γ) and a cytokine typically associated with a T2 response (IL-5).
Determination of the acquisition and frequency of alloreactive T cells in T1 and T2 recipients. (A, B) On day 5 after syngeneic (CB6F1 → CB6F1) or allogeneic (Ly5.1 B6 → CB6F1) BMT, splenic cells were obtained and restimulated in vitro for 24 hours in the presence of either syngeneic B6 or allogeneic CB6F1 DC (10:1 T cell/DC ratio). The restimulated T cells were harvested and stained for either surface CD4 (A) or CD8 (B) in combination with a bispecific antibody specific for CD45 and IFN-γ capture. Results shown are the mean ± SEM of each treatment group (n = 5) and culture condition. Results for IL-4 capture assay were negative for each condition.
Determination of the acquisition and frequency of alloreactive T cells in T1 and T2 recipients. (A, B) On day 5 after syngeneic (CB6F1 → CB6F1) or allogeneic (Ly5.1 B6 → CB6F1) BMT, splenic cells were obtained and restimulated in vitro for 24 hours in the presence of either syngeneic B6 or allogeneic CB6F1 DC (10:1 T cell/DC ratio). The restimulated T cells were harvested and stained for either surface CD4 (A) or CD8 (B) in combination with a bispecific antibody specific for CD45 and IFN-γ capture. Results shown are the mean ± SEM of each treatment group (n = 5) and culture condition. Results for IL-4 capture assay were negative for each condition.
Discussion
In this study, we have demonstrated that CD3/CD28 costimulation under defined in vitro conditions can generate highly polarized T1 or T2 populations that differentially mediate immunity after allogeneic BMT. T1-costimulated cells, but not T2-costimulated cells, had a significant capacity for allo-driven expansion in vivo, which translated into a potent GVT effect and a significant level of GVHD. These findings illustrate the importance of cytokine polarity in determining immunity generated by costimulated T cells and may have implications for attempts to modulate allogeneic, and perhaps syngeneic, immune reactions in vivo.
CD28 costimulation augments T-cell survival and cytokine production.5,6 We found that CD3/CD28 costimulation under T1- or T2-promoting conditions yielded greatly increased T-cell expansion compared with CD3 stimulation alone; this result is consistent with the known antiapoptotic role of CD28 signaling to sustain proliferation possibly through the up-regulation of
To some extent, our in vivo results are similar to earlier studies of memory cytokine-defined T cells, where T1 and T2 populations maintained their cytokine polarization after syngeneic BMT.33,34 In those previous studies, the polarized T cells were antigen specific, whereas in our experiments, the T-cell inocula were generated in a polyclonal manner. As such, our finding that the global T1 or T2 polarization was relatively fixed after in vivo administration indicates that CD3/CD28 stimulation alone in the appropriate cytokine milieu is sufficient for polarization permanence, which can occur independently of other defined pathways, such as DC1 versus DC2 cofactors.35
Our study uniquely demonstrates that polyclonal yet cytokinefixed populations have a differential capacity for antigen-driven expansion in vivo. The T1 population acquired a high degree of allospecific IFN-γ secretion in vivo, which likely accounts for a significant component of the GVHD36 and GVT effects37 we observed. Further studies using T1 cells from IFN-γ–deficient donors will be performed to address this possibility. Unexpectedly, the T1 population also acquired allospecific secretion of the type 2 cytokine IL-5 in vivo. This finding is unlikely to represent a form of T1 autoregulation because it was not associated with IL-4 or IL-10 allospecificity. Furthermore, IL-5 itself is a proinflammatory cytokine promoting eosinophilic infiltrates.38 Interestingly, a recent study demonstrated that IL-5 was essential for optimal in vivo CTL generation.39
Our finding that CD3/CD28-generated T2 cells failed to develop allospecificity in vivo was not anticipated and might have been the result of several factors. It is possible that the T2 population, because of its extremely reduced IL-2 production, did not receive sufficient autocrine T cell growth factors to respond to alloantigen in vivo. Alternatively, the high level of IL-10 production from the T2 cells might have been sufficient to down-regulate allogeneic DCs in vivo,40 thus blunting allorecognition in the T2 recipients. It is also possible that the T2 population, which we have identified as having greatly reduced CD40L expression compared with the T1 subset (data not shown), is not capable of sufficiently activating allogeneic APC in vivo. Alternatively, it is possible that CD3/CD28 costimulation in the T2 culture condition reduced the precursor frequency of T cells capable of allorecognition. The precise mechanism accounting for reduced alloreactivity in recipients of T2-polarized donor T cells is therefore unknown and will have to be elucidated in further experiments.
Our observation that T1 recipients had more GVHD than T2 recipients is consistent with prior studies using in vitro–polarized, allospecific donor T cell subsets.21,22 Previous investigators have reasoned that the reduced GVHD associated with the T2-polarized subset may be caused by immunosuppression from T2 cytokines such as IL-10,41 reduced IFN-γ with subsequent reductions in IL-1 and TNF-α levels,42 or differences in granule- and fas-mediated GVHD.43,44 Our findings now indicate that a more basic mechanism, involving reduced T2 capacity for clonal expansion to alloantigen, may also contribute to the reduced GVHD associated with allogeneic T2 cells. Although costimulated T1 cells clearly induced more GVHD than T2 cells, the T1-mediated GVHD we observed was reduced compared with our prior studies using in vitro generated allospecific T1 cells.21 It is likely that the generation of T1 allospecificity in vivo may allow for more favorable kinetics of effector cell generation with less allospecificity directed to GVHD target tissues at the time of the total body irradiation (TBI)–based preparative regimen.
Our observation that allogeneic, but not syngeneic, CD3/CD28-generated T1 and T2 populations prolonged survival adds to a growing body of evidence that an allogeneic GVT effect exists against solid tumors, including breast cancer cells.45,46 The greatly enhanced ability of T1 cells to mediate a GVT effect against alloantigen-expressing breast cancer cells likely relates to the capacity of this population to develop allospecificity in vivo. Importantly, the TSA breast cancer cells we used are refractory to allogeneic GVT effects mediated by unmodified donor T cells, apparently through their secretion of transforming growth factor-β (TGF-β).26 It is therefore possible that costimulated, highly polarized T1 allogeneic effectors may be capable of overcoming TGF-β or other tumor-mediated immunosuppression mechanisms.
Our results also shed light on the potential role of donor T cell–mediated fasL in GVHD and GVT effects against breast cancer cells. Although donor T-cell fasL has been clearly linked to the pathogenesis of acute GVHD,47-49 some results indicate that reduced fas/fasL interactions after transplantation may actually promote an ongoing or chronic phase of GVHD.50 Our observation that fasL-deficient T1 recipients appeared to have more severe ongoing GVHD supports this latter hypothesis that a certain level of fasL function within donor T cells after transplantation might improve immune autoregulation and thereby moderate GVHD. The unexpected finding that T1-cell–derived fasL did not contribute to the allogeneic GVT effect in this model suggests that inflammatory cytokines or alternative cytolytic pathways may primarily account for the observed antitumor effects; further studies using cytolyticor cytokine-deficient T1 cells will be required to identify a molecular mechanism contributing to the T1 GVT effect. The apparent lack of contribution of T1-derived fasL to the GVT effect may in part relate to the low level of surface fas expressed by the TSA cell line (less than 10% TSA cells CD95+ compared with isotype control). Because GVHD remains the limiting factor for using T1-mediated allogeneic antitumor effects, efforts are under way to better understand and to moderate T1-mediated GVHD. Such approaches include the administration of mixed T1/T2 subsets, pharmacologic abrogation of T1-cell–derived fasL, and suicide gene insertion into T1 cells.
The CD3/CD28-generated T2 population, although promising with respect to its limited GVHD generation, has relatively limited clinical potential because of a suboptimal GVT effect. Our finding that the T2 population did not develop significant allospecificity in vivo likely contributes to the relatively weak GVT and GVHD effects induced by this population; however, it should be noted that adoptively transferred allospecific T2 cells also mediate reduced allogeneic antitumor effects and reduced GVHD.20,21 These results are consistent with results in syngeneic tumor models51-53 that show the reduced capacity of T2-polarized cells to mediate antitumor effects. Given the limited antigen-driven expansion of the T2 population, we conclude that the CD3/CD28-generated T2 cells may have primary application in transplantation procedures not requiring T cell clonal expansion, such as donor T-cell abrogation of marrow graft rejection.54 Indeed, in other studies, we have found that CD3/CD28-generated T2 cells abrogate marrow rejection more efficiently than CD3/CD28-generated T1 cells.55
In conclusion, these results confirm that CD28 costimulation is essentially unbiased with respect to T1 and T2 polarization. This differential cytokine polarity of polyclonal effectors is an important consideration for cellular immunotherapy research given that only the T1-polarized subset demonstrated significant antigen-driven expansion in vivo. These findings extend the current understanding of cytokine-polarized subsets in allogeneic GVHD and GVT effects and indicate that costimulated T1 and T2 subsets may have distinct applications for graft engineering strategies in allogeneic BMT.
Prepublished online as Blood First Edition Paper, July 10, 2003; DOI 10.1182/blood-2002-12-3936.
The publication costs of this article were defrayed in part by page charge payment. Therefore, and solely to indicate this fact, this article is hereby marked “advertisement” in accordance with 18 U.S.C. section 1734.

