Abstract
The Leukemia and Lymphoma Molecular Profiling Project recently published results from DNA microarray analyses of 240 diffuse large B-cell lymphomas (DLBCLs). Four gene expression “signatures” were identified as correlated with patient outcome, including the major histocompatibility complex (MHC) class II genes (eg, HLA-DRA) which correlated with better survival. We further analyzed the effects of HLA-DRA on survival and correlated gene expression with protein status and tumor-infiltrating lymphocytes. The 5-year overall survival was 24% in the lowest 10% of HLA-DRA expression, 37% in the 10% to 25% group, 50% in the 25% to 50% group, and 55% for patients in the highest 50%. Further analysis demonstrated that the hazard ratio of death was a nonlinear function of HLA-DRA expression. Adjustment for the International Prognostic Index did not alter the impact of HLA-DRA on survival. Other MHC class II genes were found to predict survival similarly. Microarray HLA-DRA expression correlated with the presence or absence of human leukocyte antigen-DR (HLA-DR) protein in 20 of 22 cases assessed. Fewer tumor-infiltrating CD8+ T cells were detected in MHC class II-negative cases compared with positive cases (2.8% versus 11.0%; P = .001), supporting the hypothesis that loss of tumor immunosurveillance has a devastating effect on patient outcome in DLBCL. (Blood. 2004; 103:4251-4258)
Introduction
Diffuse large B-cell lymphoma (DLBCL) is the most common aggressive lymphoma diagnosed in the United States, accounting for approximately 40% of non-Hodgkin lymphoma (NHL) overall. Patients with DLBCL have an extremely variable clinical outcome using standard adriamycin-containing chemotherapy, ranging from cure to treatment failure, relapse, and death. While the median survival for all patients treated with such regimens is approximately 4 years, survival can range from a few weeks to more than 10 years when the disease is cured. This variability in clinical outcome suggests marked intertumoral heterogeneity. This heterogeneity is reflected, to a limited extent, by the morphologic classification of DLBCL, which has recently evolved to include several subtypes. The new World Health Organization (WHO) classification scheme published in 2001 identifies several morphologic and immunophenotypic variants, including centroblastic, immunoblastic, T-cell/histiocyte-rich, anaplastic, plasmablastic, and DLBCL with expression of full-length anaplastic lymphoma kinase (ALK).1 However, even within these defined subtypes, considerable variation in clinical outcome persists, indicating that additional factors are relevant.
The major histocompatibility complex (MHC) on chromosome 6p encodes a series of proteins responsible for elicitation of a cellular immune response. MHC class I proteins (human leukocyte antigen-A [HLA-A], HLA-B, and HLA-C) are expressed on all nucleated cells and function in the presentation of antigenic peptides to CD8+ cytotoxic T cells. MHC class II proteins are expressed only on professional antigen-presenting cells such as B lymphocytes, monocytes, and dendritic cells. Class II proteins function in the presentation of antigenic peptides to CD4+ helper T cells. There are 3 classical MHC class II proteins, HLA-DR, HLA-DQ, HLA-DP, and 2 nonclassical molecules, HLA-DM and HLA-DO. Each protein is a heterodimer of an alpha and a beta chain, encoded by the A and B genes, respectively. The classical proteins reside on the cell surface and compose the antigen-presentation apparatus. The nonclassical molecules are involved with modulating the intracytoplasmic antigen binding of the classical proteins. Along with the invariant chain (Ii), another protein involved in the function of the classical molecules, the genes for these proteins all have similar regulatory regions. Although presentation of peptide antigens by classical MHC class II proteins is important in eliciting immune responses, it is only a step in a larger pathway involving B- and T-cell interactions, including adhesion molecules for initial B- and T-cell docking and costimulatory molecules that initiate downstream pathways involved in immune responsiveness.
The recently completed National Cancer Institute (NCI)-organized Leukemia and Lymphoma Molecular Profiling Project (LLMPP) used DNA microarrays to study molecular diagnosis and clinical outcome prediction in DLBCL.2 The LLMPP project analyzed 240 de novo DLBCLs on a 12 196-element DNA array, the Lymphochip (National Institutes of Health, Bethesda, MD), which identified 608 genes that had predictive value. These most predictive genes were categorized into 4 biologic groupings called gene-expression “signatures.” The 4 signatures consisted of genes associated with proliferation, MHC class II, lymph node (host response), and germinal center differentiation. Two of these signatures (MHC class II and lymph node) suggested that the host response to lymphoma cells may be a crucial determinant of survival. The MHC class II gene-expression signature in particular suggested that antigen presentation to the immune system has a role in therapeutic responses, since loss of MHC class II expression was strikingly correlated with poor patient outcome. These results extended previous immunohistochemical studies of protein expression in aggressive lymphomas (DLBCL and Burkitt) in which several groups of investigators related loss of cellular adhesion molecules, such as intercellular adhesion molecules (ICAMs), and leukocyte function antigens 1 and 3 (LFA-1, LFA-3),3-5 and loss of MHC class II proteins6-8 to poor outcome. Some of these studies and others related poor outcome to loss of immunosurveillance.3,9-11 In particular, some authors have described loss of tumor-infiltrating T cells (T-TILs), including CD8+ T cells, further suggesting that aberrant loss of CAM and/or MHC class II expression equated with deficient host response and tumor containment.3,4,8,9,12
The present work includes the first external verification of the identity of the microarray elements used for the MHC class II genes in the LLMPP study, detailed characterization of the survival for patients with varying amounts of MHC class II expression, confirmation of microarray gene expression results with protein immunohistochemistry (IHC), and correlation between MHC class II expression and the presence of infiltrating cytotoxic T cells in DLBCL.
Patients, materials, and methods
The LLMPP data2 were derived from type 2 microarray experiments in which control mRNA from pooled cell lines was coloaded with tumor mRNA on each cDNA chip, so relative gene expression was derived from fluorescence ratios of sample to control. The microarray database contains gene expression data from 293 experiments (160 de novo untreated DLBCL patients in the training set; 80 in the validation set; and 53 other samples, including 9 B-cell controls), with a subset of 7399 of the original 12 196 microarray elements, representing approximately 4128 genes (those with the most variable expression). This database is available from http://llmpp.nih.gov/DLBCL/NEJM_Web_Fig1data (accessed February 18, 2004). The microarray values were preanalyzed, normalized to median, and log2 transformed, with excessively low values eliminated. A separate website, http://llmpp.nih.gov/DLBCL/ (accessed February 18, 2004), contains supplemental data from the original paper. Patient data can be obtained from http://llmpp.nih.gov/DLBCL/DLBCL_patient_data_NEW.txt (accessed February 18, 2004). Additional information on the Lymphochip, on the analysis of the array elements, and on the elements chosen for the chip is available from previous publications.13,14
For the MHC class II genes and other genes of interest (housekeeping genes GAPDH, β-tubulin, and α-actin, and B-cell antigen-related genes CD19, CD20, and CD22), the array elements or expressed sequence tags (ESTs), often several per gene, were checked to see how well they matched the gene for which they were designed to probe. Each EST was compared with the best sequence for the cDNA of that gene. Frequently this was a sequence curated by the National Center for Biotechnology Information (NCBI) staff; in the absence of a curated sequence, the most recent and most complete sequence that could be found was used. Comparisons were done with the Gap program with the use of the default parameters. Gap is a program designed for looking at the global similarity of nucleotide sequences, which was available from the Biotechnology Computing Facility (BCF) (University of Arizona) as part of the GCG Wisconsin package version 10.3 (Accelerys, San Diego, CA). Microarray elements with associated sequences that had less than 50% identity with their putative gene by Gap were not used in further analyses. Since there was a tight correlation between the expression of HLA-DRA and each of the other MHC class II genes, the average HLA-DRA expression was used to represent class II expression in subsequent analyses (Table 4).
We contacted those institutions that had participated in the LLMPP study and requested additional tissue sections from the cases identified from the LLMPP data set as being in the lowest 10% of MHC class II expression. Of these lowest expressers, we received additional material on 10 cases for IHC studies. From 2 LLMPP members, we also selected 12 cases, which were not part of the lowest 10% of MHC class II expressers and for which tissue was readily available, to serve as positive controls.
Primary antibodies were HLA-DR (immunoglobulin G2b [IgG2b]), used at a 1:50 dilution (Novocastra, Newcastle upon Tyne, United Kingdom), and CD8, clone 1A5, used neat (Ventana Medical Systems, Tucson, AZ). Since additional histologic sections were limited, HLA-DR was chosen as a representative protein on the basis of our previously published data relating loss of HLA-DR to outcome in large-cell lymphoma6 because it is highly expressed, because the microarray results correlated well with the other MHC class II proteins (Table 4), and because there was a commercially available antibody that could be used on formalin-fixed paraffin-embedded or frozen tissues. Antibodies were optimized by means of epitope-recovery methods on an automated immunostainer (Ventana Benchmark System, Ventana Medical Systems, Tucson, AZ) with a biotin-avidin-diaminobenzidine-based detection system.
HLA-DR immunohistochemical results were initially examined by 2 hematopathologists (L.M.R. and T.M.G.) and a consensus methodology was agreed upon. Host cytotoxic cells were quantified by manually counting the number of CD8+ cells in the total number of lymphoid cells as indicated by methyl green counterstaining at high magnification, as described previously.3,11 An initial training session using a multiheaded microscope was used to review details of the counting method. After the entire slide was scanned, the area of tumor with the lowest frequency of CD8+ cells was chosen and consecutive fields were counted. The pathologists performing the cell counts were blinded to the HLA-DR protein status of the case. A minimum of 750 cells were counted per case. Quantification of CD8+ cells was performed by 2 of 3 hematopathologists (L.M.R., C.M.S., D.A.F.) on most cases, and results were compared. In all cases compared, results were close and prompted no recounting. The result from the first pathologist's count was used for analysis. A comparison of 8 cases counted on both frozen and paraffin sections was also performed.
Since model building and variable selection were not undertaken for this analysis, a separate test sample was not needed. Therefore, all 240 de novo samples were used for statistical analyses. We defined a population of DLBCL patients in the lowest 10th percentile of MHC class II expression within the LLMPP data set. There were 25, rather than 24, cases in the lowest 10th percentile owing to a tie between ranked observations no. 24 and no. 25. These patients, considered MHC class II-negative and HLA-DR-, were compared with all other patients with regard to average log gene expression of HLA-DRA, HLA-DRB, HLA-DPA, HLA-DPB, HLA-DQA, HLA-DQB, HLA-DMA, and HLA-DMB, and invariant chain (Ii) by means of the Pearson method.
Overall survival was estimated by the method of Kaplan and Meier.15 Tests of differences in survival between groups and estimates of the hazard ratios for different levels of gene expression were obtained from the Cox regression model.16 A regression-spline extension to the Cox model was used to explore the rapid and nonlinear decrease in logarithm of the hazard ratio as a function of the logarithm HLA-DRA gene expression.17 While the cutpoint (10% versus 90%) was not chosen on the basis of outcome, an additional validation of the significance of the split was undertaken. P values for HLA-DRA were recalculated by drawing 1000 permutation samples and comparing the test statistics of the observed cutpoint to optimal cutpoints on gene expression for each permuted sample.18 Confidence intervals for the CD8 data were calculated by the bootstrap method.19
Results
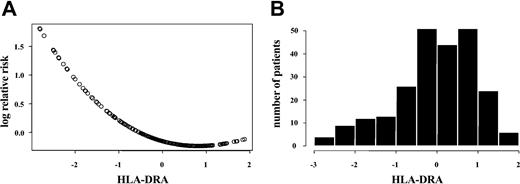
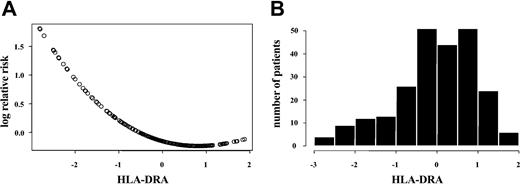
We first looked at the effect on survival of nearly complete loss of HLA-DRA expression (patients in the lowest 10% of expression) as compared with all others (those in the upper 90% of expression). For these 2 groups, the 5-year overall survival was 24% versus 51%, respectively; P = .0030 (Figure 1A). Next, the 5-year overall survival in different quantile splits of HLA-DRA expression was estimated at 24% in the lowest 10%, 37% in the lowest 10% to 25%, 50% in the lowest 25% to 50%, and 55% in the highest 50% of HLA-DRA expression. These analyses demonstrated the monotonic effect of HLA-DRA expression level on patient survival; P < .001 (Figure 1B). Further analysis demonstrated that the hazard ratio of death was a nonlinear function of HLA-DRA expression in that the risk of death increased with decreasing HLA-DRA expression (Figure 2A). Most patients had HLA-DRA expression within ± 0.5 of the median value, with many having higher expression. The lowest 10% HLA-DRA expressers had less than -1.5 relative expression (Figure 2B). Strong correlations between expression of the other MHC class II molecules with hazard ratio of death (Table 1) and overall survival (Table 2) were also found. In particular, for nearly all genes, the hazard ratio of death decreased significantly as the split level distinguishing the low-from the high-expression groups increased from 10% to 50%, with the only exceptions being HLA-DP and HLA-DM at the 50% split.
Overall survival by HLA-DRA expression. (A) Comparison of overall survival of patients in the lower 10% of HLA-DRA expression versus the upper 90%, showing a significant difference in the survival curves. (B) Comparison of overall survival of patients in 4 quantiles of HLA-DRA expression, showing incremental improvement in survival as HLA-DRA quantile increased.
Overall survival by HLA-DRA expression. (A) Comparison of overall survival of patients in the lower 10% of HLA-DRA expression versus the upper 90%, showing a significant difference in the survival curves. (B) Comparison of overall survival of patients in 4 quantiles of HLA-DRA expression, showing incremental improvement in survival as HLA-DRA quantile increased.
Hazard ratio of death and distribution of HLA-DRA expression. (A) Hazard ratio of death (log) versus HLA-DRA gene expression, indicating that the risk of death was nonlinear and inversely related to gene expression. (B) Numbers of patients with differing amounts of HLA-DRA expression. Most cases have average or above-average expression compared with normal B cells.
Hazard ratio of death and distribution of HLA-DRA expression. (A) Hazard ratio of death (log) versus HLA-DRA gene expression, indicating that the risk of death was nonlinear and inversely related to gene expression. (B) Numbers of patients with differing amounts of HLA-DRA expression. Most cases have average or above-average expression compared with normal B cells.
We next used a Cox regression model to determine if adjustments for the IPI (composed of age, performance status, lactate dehydrogenase [LDH], stage, and extranodal disease) altered this strong effect on survival. The International Prognostic Indices (IPIs) were divided into low (0-1), low-intermediate (2), high-intermediate (3), and high-risk scores (4-5). As detailed in Table 3, there were no significant differences in IPI score between patients with differing HLA-DRA expression levels (with splits at 10%, 25%, and 50%). Overall survival was significantly lower for patients in the lowest 10% compared with the upper 90% of HLA-DRA expression in both the combined low-/low-intermediate risk patients (35% versus 63%) (Figure 3A) and the combined high-intermediate/high-risk patients (0% versus 29%) (Figure 3B). These findings confirmed that adjustment for IPI does not alter the association between MHC class II status and survival.
Overall survival in IPI low/low-intermediate and high-intermediate/high groups. (A) Comparison of overall survival of patients in the lower 10% and upper 90% of HLA-DRA expression for patients with low and low-intermediate IPI scores (0-3), demonstrating a significant difference in survival. (B) Comparison of overall survival of patients in the lower 10% and upper 90% of HLA-DRA expression for patients with high-intermediate and high IPI scores (4-5), demonstrating a significant difference in survival.
Overall survival in IPI low/low-intermediate and high-intermediate/high groups. (A) Comparison of overall survival of patients in the lower 10% and upper 90% of HLA-DRA expression for patients with low and low-intermediate IPI scores (0-3), demonstrating a significant difference in survival. (B) Comparison of overall survival of patients in the lower 10% and upper 90% of HLA-DRA expression for patients with high-intermediate and high IPI scores (4-5), demonstrating a significant difference in survival.
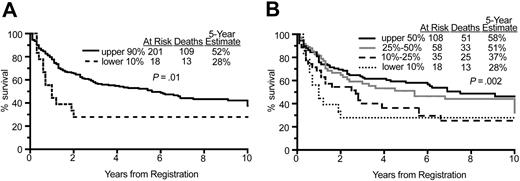
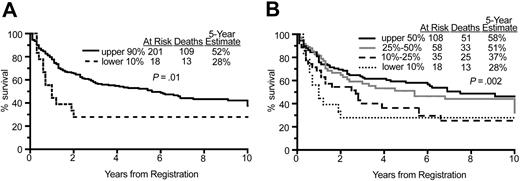
Cases with decreased HLA-DRA expression fell into all histologic subtypes (centroblastic, polymorphic, monomorphic, immunoblastic, Burkitt-like, plasmablastic) as categorized by an expert pathologist consensus review, held at the NCI, which included 8 of the coauthors (R.M.B., D.D.W., W.C.C., H.K.M.-H., E.S.J., R.D.G., E.C., and T.M.G.). Since plasmablastic and Burkitt-like lymphomas are often associated with positive HIV status and poor outcome, we assessed overall survival, excluding these particular histologic subtypes. Comparison of Figure 4 with Figure 1 reveals very similar 5-year survival rates excluding and including the plasmablastic and Burkitt-like subtypes, respectively. The 5-year survival excluding plasmablastic and Burkitt-like histologies was 28% in the lowest 10% versus 52% in the upper 90% of HLA-DRA expression compared with 24% versus 51% inclusive of all histologies (Figures 4A and 1A). With the quantile split of HLA-DRA expression, the 5-year survival was again very similar: 58%, 51%, 37%, 28% excluding plasmablastic and Burkitt-like subtypes versus 55%, 50%, 37%, 24% for all histologies (Figures 4B and 1B). The plasmablastic category was not used in the LLMPP paper as a disease subtype in the strictest sense of the term, as in oral plasmablastic lymphomas of HIV+ patients (WHO classification of hematopoietic tumors), but as a descriptive term applied to a case that was classified as a diffuse large B-cell lymphoma (eg, DLBCL with plasmablastic features). There were no known HIV+ patients in the LLMPP data set.
Overall survival excluding Burkitt-like and plasmablastic subtypes. (A) Comparison of overall survival of patients in the lower 10% and upper 90% of HLA-DRA expression, excluding those with plasmablastic or Burkitt-like histology, demonstrating a significant difference in survival. (B) Comparison of overall survival of patients in 4 quantiles of HLA-DRA expression, excluding those with plasmablastic or Burkitt-like histology, again demonstrating a significant difference in survival.
Overall survival excluding Burkitt-like and plasmablastic subtypes. (A) Comparison of overall survival of patients in the lower 10% and upper 90% of HLA-DRA expression, excluding those with plasmablastic or Burkitt-like histology, demonstrating a significant difference in survival. (B) Comparison of overall survival of patients in 4 quantiles of HLA-DRA expression, excluding those with plasmablastic or Burkitt-like histology, again demonstrating a significant difference in survival.
Owing to the prevalence of MHC class II gene deletions as a cause of loss of MHC class II expression in extranodal DLBCL from immune-privileged sites, such as brain and testes, we also determined the biopsy sites of the patient samples. Of the total data set, 69% were from nodal and 31% from extranodal sites, including 3 from testes. In comparison, the lowest 10% of HLA-DRA expressers were not significantly different, with 61% nodal and 39% extranodal sites and with no immune-privileged sites included (P = .5). Thus, the strong deleterious effect of MHC class II deficiency on patient survival cannot be ascribed to histologic subtype, tumor location, or HIV status.
To pursue additional questions about the relationships between the various MHC class II genes and other genes of interest, including housekeeping genes (GAPDH, β-tubulin, and α-actin) and B-cell-related genes (CD19, CD20, and CD22), we first searched for and then verified the specificity of pertinent EST sequences. We found 5 ESTs for HLA-DRA, 5 for HLA-DRB, 4 for HLA-DPA, 3 for HLA-DPB, 5 for HLA-DQA, 4 for HLA-DQB, 3 for HLA-DMA, 4 for HLA-DMB, and 6 for Ii. We confirmed the specificity of 90% of the elements employed but also eliminated 4 of the 39 (10%): 1 in HLA-DRA, 1 in HLA-DPA, 1 in HLA-DPB, and 1 in HLA-DQA. All of these clustered away from the other elements, and when represented graphically, their relative expression was different from that of the other representatives of the same gene. The housekeeping genes had either 1 or 2 ESTs, and all were verified. There were 4 ESTs for CD19, 7 for CD22, and 3 for CD20, one of which was eliminated. Fluorescence ratio values for all verified ESTs for the same gene were averaged for use in further analyses.
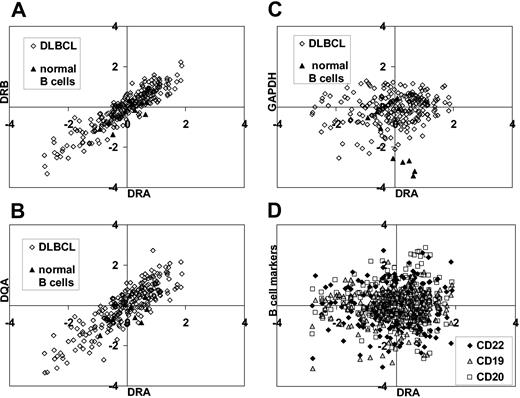
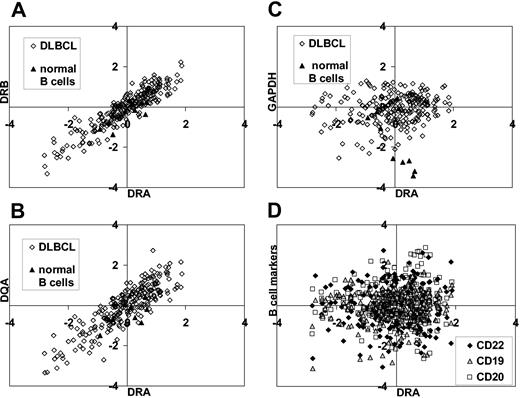
As expected from the well-described coordination between the different MHC class II proteins, there was a high degree of correlation between expression of the different classical and nonclassical MHC II genes (Table 4). For example, a high level of correlation (0.92) was found between the 2 portions of the HLA-DR heterodimer, HLA-DRA and HLA-DRB, in DLBCL that exceeded the correlation seen in benign B cells (0.60) (Figure 5A). This high degree of correlation was also seen between different classical MHC II molecules, for example HLA-DRA and HLA-DQA (0.87), which again exceeded that seen in benign B cells (0.60) (Figure 5B). Importantly, similar correlations were not detected when HLA-DRA was compared with the housekeeping genes GAPDH for either DLBCL or benign B cells (less than 0.2) (Figure 5C), β-tubulin, or α-actin (data not shown). These results indicate that increased or decreased relative expression of MHC class II genes was not an artifact related to varying amounts of total mRNA in patient samples. Recognizing that DLBCL patient tumor samples contain variable percentages of tumor cells admixed with benign inflammatory and stromal cells, we next considered whether the apparent coordination of MHC class II gene expression resulted from differences in tumor content in samples. We therefore correlated expression of the B-cell antigens CD22, CD20, and CD19 with expression of HLA-DRA in de novo DLBCL (Figure 5D). We found no significant correlation between HLA-DRA and CD19, CD20, or CD22 (each less than 0.1), indicating that differences in MHC class II expression were unlikely to result from differences in B-cell content in DLBCL samples.
Two-way correlations between HLA-DRA, HLA-DRB, GAPDH, and B-cell antigens. (A) Plot demonstrating the high degree of correlation of expression between the 2 portions of the HLA heterodimer HLA-DRA and HLA-DRB in DLBCL (0.92, ⋄). This correlation is better than the correlation in the normal control B cells (0.60, ▴). (B) Plot demonstrating the high degree of correlation of expression between 2 different MHC II molecules, HLA-DRA and HLA-DQA, in DLBCL (0.87, ⋄). This correlation is better than the correlation in the normal control B cells (0.60, ▴). (C) Plot demonstrating the lack of correlation of expression between HLA-DRA and the housekeeping gene GAPDH in DLBCL (0.19, ⋄) and normal B cells (0.2, ▴). These results indicate that the coordination of MHC class II genes identified in Figures 3 and 4 is not merely an artifact of microarray loading. (D) Plot demonstrating the lack of correlation between expression of HLA-DRA and the expression of the B-cell antigens CD19 ( ), CD20 (□), and CD22 (♦) in DLBCL (less than 0.1 for each). These results indicate that variation in MHC class II expression does not result from variable tumor content in specimens, but is a unique property of each patient's disease.
Two-way correlations between HLA-DRA, HLA-DRB, GAPDH, and B-cell antigens. (A) Plot demonstrating the high degree of correlation of expression between the 2 portions of the HLA heterodimer HLA-DRA and HLA-DRB in DLBCL (0.92, ⋄). This correlation is better than the correlation in the normal control B cells (0.60, ▴). (B) Plot demonstrating the high degree of correlation of expression between 2 different MHC II molecules, HLA-DRA and HLA-DQA, in DLBCL (0.87, ⋄). This correlation is better than the correlation in the normal control B cells (0.60, ▴). (C) Plot demonstrating the lack of correlation of expression between HLA-DRA and the housekeeping gene GAPDH in DLBCL (0.19, ⋄) and normal B cells (0.2, ▴). These results indicate that the coordination of MHC class II genes identified in Figures 3 and 4 is not merely an artifact of microarray loading. (D) Plot demonstrating the lack of correlation between expression of HLA-DRA and the expression of the B-cell antigens CD19 ( ), CD20 (□), and CD22 (♦) in DLBCL (less than 0.1 for each). These results indicate that variation in MHC class II expression does not result from variable tumor content in specimens, but is a unique property of each patient's disease.
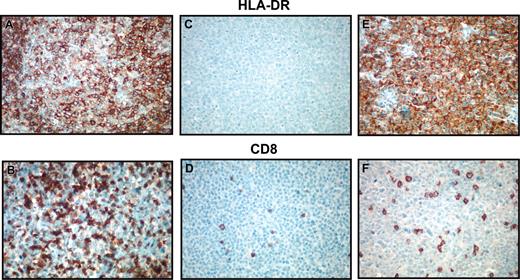
We next questioned whether DLBCL cases with low MHC class II expression in the LLMPP study also had decreased protein expression of HLA-DR as assessed by means of tissue-section immunohistochemistry. Then cases of the lowest expressers were stained for HLA-DR. These 10 cases consisted of 2 plasmablastic, 1 immunoblastic, 4 centroblastic monomorphic, 1 centroblastic polymorphic, and 2 unclassified histologies. An additional 12 MHC class II-positive cases were assessed for comparison. These 12 cases had HLA-DRA expression percentile values ranging from 30% to 99%, with an average of 67%, and consisted of 1 plasmablastic, 2 immunoblastic, 5 centroblastic monomorphic, 1 centroblastic polymorphic, and 3 unclassified histologies. Of the 10 lowest MHC class II gene expressers, 8 cases were completely negative for the cytoplasmic membrane staining expected with HLA-DR. Two cases demonstrated an unusual staining pattern (punctate or cytoplasmic). All 12 of the positive MHC class II gene expressers demonstrated the presence of the protein in the normal cytoplasmic membrane distribution.
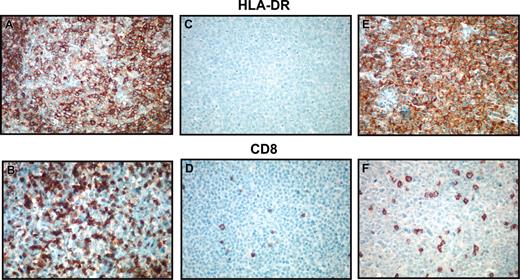
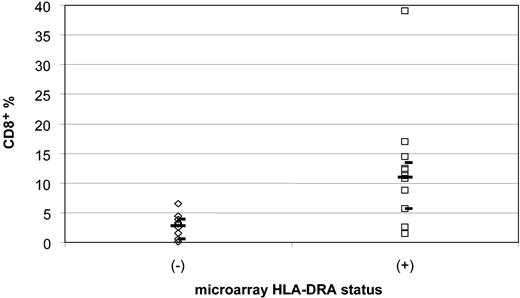
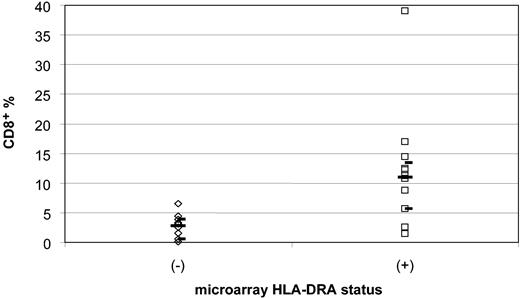
We quantified the percentage of tumor-infiltrating lymphocytes using CD8 immunohistochemical staining and morphologic quantification in the same 10 MHC class II-negative and 12 MHC class II-positive cases. Photomicrographs of representative cases and data are displayed in Figure 6 and Table 5. The CD8+ cell percentages in MHC class II-negative cases ranged from 0.10% to 6.5%, with a median of 2.8% and a 95% confidence interval of 0.5% to 3.9%. In contrast, the CD8+ cell percentages in MHC class II-positive cases ranged from 1.4% to 39%, with a median of 11.0% and a 95% confidence interval of 5.6% to 13.4% (P < .001, Wilcoxon rank sum) (Figure 7). Since these CD8 stains were performed on either frozen or paraffin sections, depending on tissue availability for each case, a separate study of 8 HLA-DR+ cases with both frozen and paraffin sections available for staining and counting were compared in a blinded fashion. Results for CD8 were similar in the 2 types of preparations, indicating that comparable data can be obtained from either type of preparation (data not shown). Analysis of CD8 expression by microarray was limited owing to lack of inclusion of normal T-cell populations expressing CD8 in the control samples used with the Lymphochip.
Immunohistochemical detection of HLA-DR and CD8. Photomicrographs demonstrating immunohistochemical detection of HLA-DR (A,C,E) and CD8 (B,D,F). Panels A and B demonstrate an HLA-DR+ case with brisk CD8+ cytotoxic T-cell response. Panels C and D show an HLA-DR- case with few CD8+ tumor-infiltrating lymphocytes. Panels E and F demonstrate a microarray HLA-DRA- case that has staining for the protein in an unusual cytoplasmic pattern. This case also demonstrates low numbers of CD8+ cytotoxic T cells, indicating possible aberrant protein localization or function. Original magnification, ×100.
Immunohistochemical detection of HLA-DR and CD8. Photomicrographs demonstrating immunohistochemical detection of HLA-DR (A,C,E) and CD8 (B,D,F). Panels A and B demonstrate an HLA-DR+ case with brisk CD8+ cytotoxic T-cell response. Panels C and D show an HLA-DR- case with few CD8+ tumor-infiltrating lymphocytes. Panels E and F demonstrate a microarray HLA-DRA- case that has staining for the protein in an unusual cytoplasmic pattern. This case also demonstrates low numbers of CD8+ cytotoxic T cells, indicating possible aberrant protein localization or function. Original magnification, ×100.
Comparison of the percentage of CD8+ tumor-infiltrating lymphocytes from HLA-DRA- and HLA-DRA+ microarray cases. Diamonds (⋄) indicate the 10 microarray HLA-DRA- cases, and squares (□) indicate the 12 microarray HLA-DRA+ cases. There is a significant difference between the negative and positive cases, 2.9% versus 10.9%, in the median percentage of CD8+ cells (P < .001). The median percentages of tumor-infiltrating lymphocytes are shown by long bars. The upper and lower 95% confidence intervals are indicated by short bars.
Comparison of the percentage of CD8+ tumor-infiltrating lymphocytes from HLA-DRA- and HLA-DRA+ microarray cases. Diamonds (⋄) indicate the 10 microarray HLA-DRA- cases, and squares (□) indicate the 12 microarray HLA-DRA+ cases. There is a significant difference between the negative and positive cases, 2.9% versus 10.9%, in the median percentage of CD8+ cells (P < .001). The median percentages of tumor-infiltrating lymphocytes are shown by long bars. The upper and lower 95% confidence intervals are indicated by short bars.
Fluorescence ratio data could therefore not be generated for comparison with our immunohistochemical results.
Discussion
Other investigators have successfully used a microarray study with supervised learning classification techniques to subdivide DLBCL into prognostic groups not recognized by the clinical IPI scoring system. The LLMPP database is one of the first large, multi-institutional, publicly available microarray databases of gene expression in any type of lymphoma.2,20 As such, it is an extremely valuable resource for detailed investigation. As a first step, we have independently verified the specificity of 90% of the microarray elements used in the MHC class II analysis, indicating the reliability of the reported probe set used. Further analysis of this database confirms that loss of MHC class II gene expression is an independent prognostic variable, even after adjusting for the IPI score, and that the poor survival of patients lacking MHC class II gene expression cannot be explained by differences in HIV status, tumor location, or histologic subtype.
We further demonstrate that losses of MHC class II genes, including HLA-DRA, are continuous variables related in a nonlinear fashion to the hazard risk of death. Immunohistochemical protein stains correlated with the microarray gene expression data in 20 of 22 MHC class II-positive and MHC class II-negative cases tested, indicating a good correlation between gene expression and protein presence. In 2 of the 10 MHC class II-negative cases, localization of the HLA-DR protein within the cell cytoplasm, as opposed to the usual cell membrane location, was observed. Since the storage, antigenic loading, and shuttling of MHC class II proteins to the cell surface is a complex process involving invariant chain, lysozomes, and cathepsin S, this apparent inconsistency may indicate aberrant structure, function, or trafficking of the proteins in these cases.21-23
Possibly most important from a pathologic standpoint, in all 10 of the cases with low HLA-DRA expression by microarray, including the 2 with unusual protein staining, the percentages of CD8+ tumor-infiltrating lymphocytes assessed by IHC were extremely low, suggesting diminished immunosurveillance. This relationship between low tumor-infiltrating lymphocytes and negative HLA-DRA status is in agreement with previous studies of aggressive non-Hodgkin lymphoma.3,10,11
In the immune response, cytotoxic T cells (CD8+) react to antigens presented by MHC class I molecules found ubiquitously on nearly every nucleated cell type. MHC class II antigens are present on only a few types of antigen-presenting cells (including B cells, macrophages, and dendritic cells) and provoke a T-helper (CD4+) cell response. The T-helper response in turn assists the T-cytotoxic response. While assessment of CD4+ cell response may be a more proximal measure of loss of immune surveillance by MHC class II-deficient tumor cells, assessment of CD8+ cells reflects the final common pathway of cell-mediated tumor cell death. Furthermore, the T-helper population consists of several subtypes, and CD4 is present on macrophages, making quantification in tissue sections more problematic. We chose to quantify the area of fewest T-TILs in the tissue sections, with the reasoning that if any portion of the tumor escaped immunosurveillance, there would be an increased risk of progression or relapse. Using this rationale, we have found that decreased numbers of CD8+ T-TILs are highly predictive of patient survival.
Several models of human lymphoma have been established in immunodeficient mice (either severe combined immunodeficient [SCID] or irradiated) with the use of immortalized cell lines, primary tumor samples, or peripheral blood mononuclear cells from Epstein-Barr virus (EBV)-seropositive donors.24-30 T cells derived from autologous, allogeneic, or cytotoxic T-cell lines have been effective in eradicating a variety of human-SCID mouse xenografts of lymphoma, carcinoma, and melanoma.24,29-34 The activity of human cytotoxic T cells against specific tumors can be augmented in vitro, prior to reintroduction to the mouse-human xenograft, by repeated stimulation with tumor cells or interleukin 2 (IL-2).24,29,35 Cytotoxic cells stimulated by exposure to tumor were shown to act in an HLA-restricted fashion in a human-mouse lymphoblastic leukemia model.29 Examination of the tumor mass demonstrated infiltration by CD8+ T cells in human-mouse xenografts of colon cancer.31 Importantly, T-cell subset depletion studies demonstrated that CD8+ cells were the critical subset in tumor suppression in head and neck carcinoma.32 These studies indicate that the antitumor activity of cytotoxic CD8+ T cells is dependent on appropriate HLA expression and can be a significant pathway in tumor containment for in vivo mouse models.
Work by other authors examined sequential biopsies from 9 patients with various tumors, including 1 NHL. After treatment of these tumors with IL-2, a stimulant of HLA-DR, these authors reported increased numbers of CD8+ cytotoxic T cells in tumor samples from patients responding to therapy but not in the nonresponders. No increase in numbers of natural killer (NK) cells or CD4+ helper cells was found. Interestingly, in 4 of the 5 responders, tumor cells were positive for HLA-DR before therapy, and the fifth responder became positive during treatment, whereas all nonresponders were HLA-DR negative before and after therapy.36 These results suggest that increased numbers of tumor-infiltrating cytotoxic lymphocytes have a direct relationship to response to cytokine therapy that is aimed at up-regulating tumor immunogenicity.
Genetic deletions of MHC genes appear to be common in extranodal lymphomas at immune-privileged sites, in particular the central nervous system and testes. In one study, 60% of immune-privileged site lymphomas had a total loss of MHC class I genes as compared with 10% of intranodal cases. Additionally, MHC class II expression was lost in 56% of immune-privileged lymphomas compared with only 5% of nodal lymphomas.8 Loss of MHC class II in these particular types of lymphomas is due to both homozygous and heterozygous deletions as well as point mutations.37,38 Of importance, none of the cases in our group of the lowest 10% of MHC class II expression were from immune-privileged sites. The mechanisms of lost MHC class II expression in NHL from nonimmune privileged sites, such as those primarily studied in this work, are not known.
There is now significant evidence that diminished MHC class II gene expression with consequent loss of immunosurveillance is an important factor related to patient survival in DLBCL. The structural genes themselves as well as the complex array of genes involved in promotion of MHC class II transcription may be altered either through point mutations, small deletions, insertions, or epigenetic changes such as DNA methylation or histone deacetylation. On the basis of the mechanism of gene expression loss, alternative therapies using targeted pharmacologic strategies aimed at enhancing tumor immunosurveillance may be envisioned.
Appendix
The following individuals are members of the Leukemia and Lymphoma Molecular Profiling Project: John Armitage, Martin Bast, Rita Braziel, Elias Campo, Wing “John” Chan, Michael Chiorazzi, Joseph Conners, Sandeep Davé, Andrew Davies, Jan Delabie, Patrick Duffey, Richard Fisher, Randy Gascoyne, Neta Goldschmidt, Timothy Greiner, Tom Grogan, James Jacobson, Elaine Jaffe, Stein Kvaløy, Andrew Lister, Michael LeBlanc, Dan Longo, Jim Lynch, Thomas Miller, Konrad Muller-Hermelink, Andrew Norton, German Ott, John Powell, Lisa Rimsza, Andreas Rosenwald, Richard Simon, Eriend Smeland, Louis Staudt, Lisa Stevens, Julie Vose, Dennis Weisenburger, Wyndham Wilson, George Wright, Liming Yang, and Hong Zhao.
Prepublished online as Blood First Edition Paper, February 19, 2004; DOI 10.1182/blood-2003-07-2365.
Supported by the Leukemia and Lymphoma Molecular Profiling Project and the Southwest Oncology Group.
A complete list of the members of the Leukemia and Lymphoma Molecular Profiling Project appears in the “Appendix.”
The publication costs of this article were defrayed in part by page charge payment. Therefore, and solely to indicate this fact, this article is hereby marked “advertisement” in accordance with 18 U.S.C. section 1734.
We would like to acknowledge the Biotechnology Computing Facility at the University of Arizona, Tucson, for assistance with database management.






 ), CD20 (□), and CD22 (♦) in DLBCL (less than 0.1 for each). These results indicate that variation in MHC class II expression does not result from variable tumor content in specimens, but is a unique property of each patient's disease.