Abstract
Circumvention of chemoresistance in the B-cell neoplasm multiple myeloma (MM) might be achieved by targeting certain intracellular signaling pathways crucial for survival of the malignant clone. The use of the macrolide rapamycin, selectively inhibiting the phosphoprotein mammalian target of rapamycin (mTOR) downstream of, for example, insulin-like growth factor-I receptor (IGF-IR), possibly represents such a molecular mode of therapy. By using a panel of MM cell lines we showed that rapamycin induced G0/G1 arrest, an effect being associated with an increase of the cyclin-dependent kinase inhibitor p27 and a decrease of cyclins D2 and D3. Interestingly, in primary, mainly noncycling MM cells, rapamycin, at clinically achievable concentrations, induced apoptosis. More important, rapamycin sensitized both MM cell lines and primary MM cells to dexamethasone-induced apoptosis. This effect was associated with a decreased expression of cyclin D2 and survivin. The phosphorylation of the serine/threonine kinase p70S6K at Thr389 and Thr421/Ser424 was down-regulated by rapamycin and/or dexamethasone. Strikingly, the combinatorial treatment with rapamycin and dexamethasone suppressed the antiapoptotic effects of exogenously added IGF-I and interleukin 6 (IL-6) as well as their stimulation of p70S6K phosphorylation. The induction of apoptosis by rapamycin and dexamethasone despite the presence of survival factors was also demonstrated in primary MM cells, thus suggesting this drug combination to be active also in vivo. (Blood. 2004;103:3138-3147)
Introduction
Multiple myeloma (MM) is an incurable tumor, in which the malignant B cells, although often initially sensitive to treatment, inevitably develop resistance to cytotoxic drugs. Glucocorticoids, such as dexamethasone, are known as highly effective drugs against MM1 and are mostly used in combination with chemotherapeutic agents.2 Emerging evidence shows the potency of insulin-like growth factor-I receptor (IGF-IR) in mediating survival of MM cells3-6 as well as their resistance to cytotoxic treatment.7,8 The ligands for the IGF-IR (mainly IGF-I and IGF-II) are, besides being present in plasma, abundant in the bone matrix and also produced by several cell types within the bone marrow, such as osteoblasts.9 Thus, the selective homing of the MM cells within the bone marrow close to the bone tissue will provide the tumor cells with a milieu enriched with IGFs.
The rational of mapping and targeting the IGF-IR signaling pathway for use in improved MM therapy rests on 2 fundamental observations. The first is the modest use of IGF-IR signaling in the proliferation of healthy cells in the adult individual.10 The second is the previously successful strategy of targeting cellular survival circuits in terms of selective kinase inhibitors such as STI-571.11 Although several signaling molecules, such as the mitogen-activated protein kinase (MAPK), are activated downstream of the phosphatidylinositol-3-kinase (PI3-K), the Akt pathway is of particular interest because of its role in inhibiting apoptosis and promoting cell proliferation.12 One candidate target molecule for antitumor therapy is represented by the phosphoprotein mammalian target of rapamycin, mTOR (also known as FRAP [FKBP12-rapamycin-associated protein], RAFT [rapamycin and FKBP-12 target], or RAPT), in which the PI3-K/Akt pathway has been suggested to affect the mTOR phosphorylation state and catalytic activity.13 Rapamycin binds to its cellular receptor, the immunophilin FK506 binding protein 12 (FKBP12), to form a complex that interacts with mTOR, thereby blocking its activity.14 Mitogen-activated signaling through mTOR phosphorylates the serine/threonine kinase p70S6K and the translational repressor eukaryotic initiation factor (eIF) 4E binding protein (4EBP1) also known as PHAS-I.15 Activated p70S6K directly phosphorylates the 40S ribosomal protein S6, which correlates with enhanced translation of transcripts with 5′-terminal oligo-pyrimidine sequences that encode components of the translational machinery.16 Multisite phosphorylation of 4EBP1 results in its dissociation from eIF4E, thereby allowing eIF4E to participate in assembly of a translational initiation complex leading to translational up-regulation of proteins required for cell cycle progression from G1 to S phase.17
Currently, rapamycin is in clinical use because of its effect on preventing allograft rejection without showing the severe side effects usually associated with traditional immunosuppressive therapy.18,19 Rapamycin has also shown activity against a variety of malignancies, and an ester analog for intravenous treatment, CCI-779, has recently been developed.20 In the National Cancer Institute (NCI) cell line screening panel, T-cell leukemia/lymphoma cell lines were among the most sensitive to CCI-779 (IC50 [concentration that inhibits 50%], < 10 nM) and antitumor activity was demonstrated in a variety of human carcinoma xenograft models in nude mice.21 In addition, rapamycin has been shown to potently induce apoptosis in lymphomas of B-cell origin.22 However, the most striking effect of mTOR suppression has previously been attributed mainly to cytostasis rather than to cytotoxicity.23,24 Among hematologic malignancies this is exemplified by tumor cells obtained from patients with B-cell chronic lymphocytic leukemia (B-CLL), in which rapamycin clearly induced G0/G1 arrest in cycling cells, whereas the survival of proliferative as well as G0/G1 arrested cells was not affected.25
In this paper we demonstrate the importance and the potential therapeutic use of the selective mTOR inhibitor rapamycin in apoptosis sensitization of MM cells. We show that rapamycin treatment of freshly isolated plasma cells from patients with MM leads to apoptosis, and mainly cytostatic effects are demonstrated in MM cell lines. Of particular interest, rapamycin sensitizes MM cell lines as well as primary MM cells to dexamethasone-induced apoptosis, an effect being associated with a concomitant down-regulation of cyclin D2 and the key antiapoptotic protein survivin.
Materials and methods
MM cell lines and freshly purified MM cells
The MM cell lines Karpas 707,26 EJM,27 LP-1,28 RPMI 8226,29 U-1958,30 and U-266-197031 were maintained in RPMI 1640 (Flow, Irvine, United Kingdom) supplemented with 10% fetal bovine serum (FBS; Sigma, St Louis, MO), glutamine (2 mM), and antibiotics (penicillin 100 U/mL and streptomycin 50 μg/mL) at 37°C in a humidified 5% CO2 in-air atmosphere. The interleukin 6 (IL-6)–dependent U-1958 and U-266-1970 cell lines were during the expansion phase routinely cultured on healthy human skin fibroblasts AG1523 (Human Cell Repository, Camden, NJ). However, in the experiments, recombinant IL-6 (rIL-6; 10 ng/mL for U-1958 and 4 ng/mL for U-266-1970) was used instead of fibroblasts to facilitate end point analysis. As a preparation for the experiments, exponentially growing cells from stock cultures were seeded into flat-bottomed tissue-culture plates (Falcon; Becton Dickinson Labware, Franklin Lakes, NJ) at 4 × 10⁵ (EJM, Karpas 707, U-1958, and U-266-1970) or 2 × 10⁵ cells/mL (LP-1, RPMI 8226) in serum-containing culture medium and incubated overnight before addition of reagents.
Heparinized bone marrow (BM) samples were obtained from 7 patients with newly diagnosed MM and from 1 patient with MM with stable disease refractory to chemotherapy. The clinical data from these patients are presented in Table 1. Mononuclear cells separated by Ficoll-Paque Plus density sedimentation (Amersham Biosciences, Uppsala, Sweden) were subjected to CD138 immunomagnetic purification according to the protocol of the supplier (Miltenyi Biotech, Paris, France). The CD138 purification did not affect the viability of the primary MM cells as analyzed by trypan blue exclusion. The enriched fraction showed a purity of more than 95% plasma cells as determined by May-Grünwald-Giemsa staining and morphology. The purified tumor cells were seeded at 1 × 10⁶ cells/mL into round-bottomed 96-well tissue-culture plates (Falcon) followed by immediate addition of reagents. The study was conducted in accordance with the Helsinki protocol and was approved by each institution's ethics committee. Informed consent was obtained from all patients.
Reagents
Rapamycin (Merck Biosciences, Darmstadt, Germany) was dissolved in dimethyl sulfoxide (DMSO) and used at indicated concentrations or at the concentration 20 nM. The amount of DMSO in the experiments never exceeded 0.1%, a concentration not altering growth or survival properties of the MM cells (data not shown). Dexamethasone (Sigma) was used at a concentration of 1 μM in all experiments. The used concentrations of rapamycin and dexamethasone are considered to be within the range of therapeutically achievable doses (rapamycin 5-20 nM, dexamethasone 10-5 to 10-7 M). rIL-6 (PeproTech, Rocky Hill, NJ) was used at the concentration 100 ng/mL, whereas rIGF-I (R&D Systems, Minneapolis, MN) and the IGF-I analog, LongR3-IGF-I (Sigma), were used at the concentration 100 nM. Compared with the native molecule, LongR3-IGF-I exhibits increased potency,32 an effect that may be explained by its decreased affinity for IGF-I binding proteins.33
Assay for cell growth
At harvest of the cell line growth experiments, the 96-well tissue culture plates were centrifuged at 400g for 5 minutes at room temperature (RT) followed by discarding of the medium by flicking. After one washing step using phosphate-buffered saline (PBS), serum-free RPMI 1640 (100 μL/well) containing 10% resazurin (Sigma) at a concentration of 440 μM was added followed by incubation for 1 hour at 37°C in a humidified 5% CO2 in-air atmosphere. At harvest of the experiments containing freshly purified MM cells, the washing step was omitted, and the resazurin was added directly at a concentration of 10% followed by incubation for 3 hours at 37°C in a humidified 5% CO2 in-air atmosphere. Resazurin is the active compound of the commercially available growth indicator dye Alamar Blue.34 In response to metabolically active cells, resazurin becomes increasingly fluorescent,35-37 and separate experiments show a linear correlation between the number of viable MM cells and the emitted light (data not shown). Analysis of fluorescence was performed by using a Wallac Victor Multilabel Counter (Wallac, Turku, Finland), in which the resazurin was excited at 530 nm and the emitted light was measured at 590 nm. Mean was calculated from triplicate wells and subtracted from mean of blank wells resulting in ΔFluorescence. The relative number of viable cells was expressed as the percentage of control and calculated as 100 × ΔFluorescence (test wells)/ΔFluorescence (control wells).
Assays for apoptosis
Cells from the different MM cell lines were cultured in 48-well tissue- culture plates for 48 hours in the presence of reagents. Apoptosis in the MM cell lines was quantified by staining with annexin V (AV)–fluorescein isothiocyanate (FITC) and propidium iodide (PI) using TACS Annexin V–FITC Apoptosis Detection Kit (R&D Systems). The samples were treated according to instructions provided by the manufacturer followed by analysis using flow cytometry (FACScan; Becton Dickinson, San Jose, CA). Apoptosis was also analyzed with the terminal transferase mediated nick end labeling (TUNEL) assay using Fluorescein-FragEL DNA Fragmentation Detection Kit (Merck Biosciences). The MM cells were washed with PBS and fixed with 4% paraformaldehyde followed by incubation overnight in 80% ethanol at 4°C. The subsequent labeling of the DNA ends was performed according to the protocol provided by the manufacturer, and the stained cells were analyzed by flow cytometry. To estimate the amount of apoptosis in freshly purified MM samples, the hypodiploid fraction of the cell cycle was quantified by using the Vindelöv method38 as described in “Cell cycle analysis.”
Cell cycle analysis
The experiments were performed as for the apoptosis analysis but were followed by analysis of cell cycle distribution according to Vindelöv.38 Briefly, the cells were washed once in PBS followed by lysis of cell membrane using NP40 buffer (Sigma) and treatment with trypsin (0.03 mg/mL) for 10 minutes at RT. Trypsin inhibitor (0.5 mg/mL; Sigma) and ribonuclease A (0.1 mg/mL; Sigma) were added followed by 10 minutes of incubation at RT. Finally, the cells were exposed to PI (0.42 mg/mL; Sigma) for 15 minutes at 4°C. The stained nuclei were analyzed by FACScan, and the distribution in cell cycle phases was calculated by using ModFit LT 3.0 Analysis Software (Verity Software House, Topsham, ME).
Ribonuclease protection assay (RPA)
Cells were harvested from exponentially growing stock cultures, and total RNA was isolated by using the RNAgents Total RNA Isolation System (Promega, Madison, WI). The RPA was performed according to the manufacturer of RiboQuant Multi-Probe RNase Protection Assay System (Pharmingen, San Diego, CA). The multiprobe template hCYC-1 (Pharmingen) was used to analyze expression of human cell cycle regulatory genes.
Western blotting
The experiments were performed in 6-well tissue-culture plates and harvested at indicated times in lysis buffer containing NP40 (1%), Tris (tris(hydroxymethyl)aminomethane)–HCl (0.1 M, pH 8.0), NaCl (0.15 M), and EDTA (ethylenediaminetetraacetic acid; 5 mM), ZnCl2 (1 mM), NaMoO4 (50 μM), NaF (10 mM), Na3VO4 (0.1 mM), PMSF (phenylmethylsulfonyl fluoride; 1 mM), DTT (dithiothreitol; 1 mM), and Complete EDTA-free protease inhibitor (Roche, Mannheim, Germany). Lysates were vortexed and centrifuged at 16 000g for 5 minutes at 4°C. Protein concentration was determined with Bio-Rad protein assay (Bio-Rad Laboratories, Hercules, CA). The Novex electrophoresis and blotting system (Novex, San Diego, CA) was used when extracts were separated on NuPAGE Bis-Tris precast gels (Invitrogen, Carlsbad, CA) and subsequently transferred to a Hybond ECL (enhanced chemiluminescence) nitrocellulose membrane (Amersham Biosciences, Oxford, United Kingdom). The membrane was blocked with 5% nonfat dry milk dissolved in TBS (10 mM Tris-HCl, pH 7.6, 137 mM NaCl) with 0.1% Tween 20 (TTBS) for 1 hour at RT followed by incubation with primary antibody at 4°C overnight. The membranes were washed 5 times in TTBS and incubated for 1 hour at RT with secondary horseradish peroxidase (HRP)–conjugated donkey antirabbit antibody, HRP-conjugated sheep antimouse antibody (Amersham Biosciences), or HRP-conjugated rabbit antigoat antibody (DAKO, Glostrup, Denmark) diluted 1:5000 in TTBS with 5% nonfat milk. Proteins were visualized by ECL plus (Amersham Biosciences). Primary antibodies used were specific for p70S6K (total), p70S6K (Thr389), p70S6K (Thr421/Ser424), Akt (total), Akt (Ser473) (Cell Signaling Technology, Beverly, MA), survivin (R&D Systems), bcl-xL (H-62), cyclin A (C-19), cyclin B (H-20), p27 (C-19), cyclin D2 (C-17), cyclin D3 (C-16), cyclin E (HE12), actin (I-19) (Santa Cruz Biotechnology, Santa Cruz, CA), and p21 WAF1 (Ab-1) (Merck Biosciences). The level of the actin protein was used as a control of the amount of protein loaded into each lane.
Statistical analysis
Statistical analysis was done by analysis of variance (ANOVA) followed by multiple comparison by the Fisher method using StatView software (Abacus Concepts, Berkeley, CA).
Results
Rapamycin inhibits growth and increases dexamethasone-induced growth inhibition in MM cell lines
MM cells from a panel of 6 authentic MM cell lines were tested for their response to rapamycin and dexamethasone. The MM cells were incubated for 72 hours with rapamycin and/or dexamethasone, and the relative number of viable cells was evaluated by using the resazurin assay as described in “Materials and methods.”
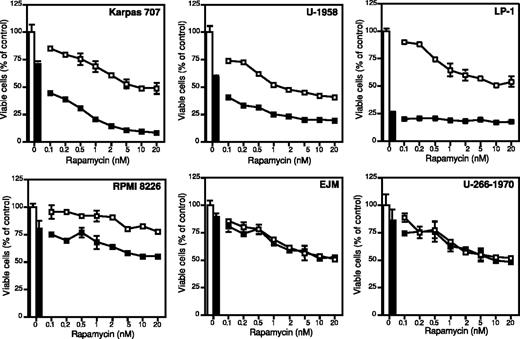
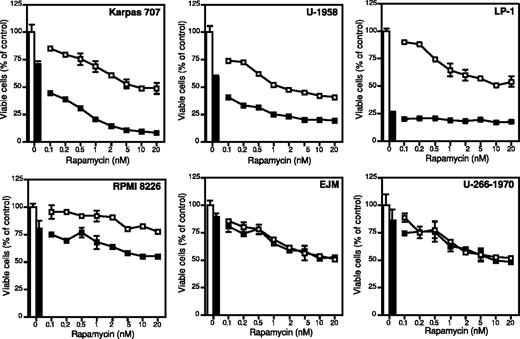
All MM cell lines responded dose-dependently to rapamycin with reduction of growth, and, with the exception of the RPMI 8226 cell line, the MM cell lines exhibited 45% to 60% growth inhibition when treated with 20 nM rapamycin (Figure 1). The RPMI 8226 cell line was least sensitive, exhibiting 20% growth inhibition at 20 nM rapamycin (Figure 1). Rapamycin concentrations above 20 nM did not lead to a more potent growth inhibition in any of the cell lines (data not shown). The response of the MM cell lines to dexamethasone was heterogeneous. The LP-1 cell line was highly sensitive with 70% inhibition of growth at 72 hours (Figure 1). The other cell lines showed varying responses of 10% to 40% growth inhibition (Figure 1).
The effect of rapamycin and dexamethasone on growth in 6 different MM cell lines. Karpas 707, U-1958, LP-1, RPMI 8226, EJM, and U-266-1970 cells were treated with indicated concentrations of rapamycin alone (□) or in combination with dexamethasone (▪). At 72 hours of incubation the plates were washed and incubated with the redox-dye resazurin as described in “Materials and methods.” The plates were analyzed by fluorometry, and the amount of emitted light, proportional to the number of living cells, was determined. Four experiments were performed and one representative is shown. Data are expressed as mean ± SD where n = 3.
The effect of rapamycin and dexamethasone on growth in 6 different MM cell lines. Karpas 707, U-1958, LP-1, RPMI 8226, EJM, and U-266-1970 cells were treated with indicated concentrations of rapamycin alone (□) or in combination with dexamethasone (▪). At 72 hours of incubation the plates were washed and incubated with the redox-dye resazurin as described in “Materials and methods.” The plates were analyzed by fluorometry, and the amount of emitted light, proportional to the number of living cells, was determined. Four experiments were performed and one representative is shown. Data are expressed as mean ± SD where n = 3.
Rapamycin strongly enhanced the growth inhibitory effect of dexamethasone in the IL-6–independent Karpas 707 cell line and in the IL-6–dependent U-1958 cell line (Figure 1). Although less pronounced, this effect could also be demonstrated in the LP-1 and the RPMI 8226 cell lines. However, rapamycin did not sensitize the EJM and U-266-1970 cell lines to dexamethasone-induced growth inhibition (Figure 1).
Rapamycin increases dexamethasone-induced apoptosis and arrests cells in the G0/G1 phase of the cell cycle
To further characterize the enhancing effect of rapamycin on dexamethasone-induced growth inhibition, the MM cell lines Karpas 707 and U-1958 were selected for analyses of apoptosis and cell cycle phase distribution. Apoptosis was quantified by using AV/PI staining and TUNEL, whereas the cell cycle phases were investigated by PI staining of cell nuclei according to Vindelöv.38
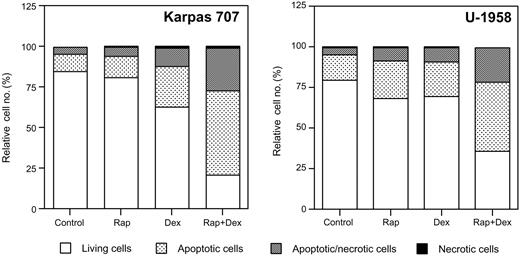
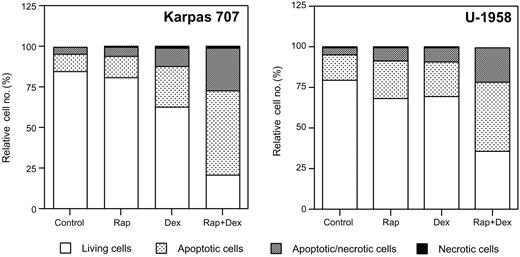
At 48 hours rapamycin slightly increased the fraction of apoptotic cells (AV-positive/PI-negative) in the Karpas 707 cell line, whereas dexamethasone more than doubled the amount of apoptotic cells (Figure 2). The combination of rapamycin and dexamethasone, however, increased the fraction of apoptotic cells more than 5 times as compared with control cells (Figure 2). Treatment with rapamycin and/or dexamethasone also increased the amount of apoptosis in the U-1958 cell line (Figure 2). As with the Karpas 707 cells the combination of rapamycin and dexamethasone was more effective than any of the drugs alone (Figure 2). Analysis using the TUNEL assay also demonstrated induction of apoptosis in response to rapamycin and/or dexamethasone (Table 2), thus confirming the data generated by AV/PI staining. Statistical analysis of TUNEL data from the Karpas 707 cells revealed that significant changes (P < .05) were induced by treatment with dexamethasone (as compared with control) and also with the combination of rapamycin and dexamethasone (as compared with control or dexamethasone treatment). In the U-1958 cells only the combination of rapamycin and dexamethasone induced a statistically significant (P < .05) increase of apoptosis (as compared with control).
The effect of rapamycin and dexamethasone on apoptosis in 2 MM cell lines. Karpas 707 and U-1958 cells were treated with rapamycin and/or dexamethasone for 48 hours followed by harvest and wash in PBS before staining with AV/PI and subsequent analysis by flow cytometry. Cells were categorized as living cells (AV-negative/PI-negative), apoptotic cells (AV-positive/PI-negative), apoptotic/necrotic cells (AV-positive/PI-positive), or necrotic cells (AV-negative/PI-positive), and the relative cell number was presented as the percentage of 10 000 cells. Three independent experiments per cell line were performed and one representative is shown.
The effect of rapamycin and dexamethasone on apoptosis in 2 MM cell lines. Karpas 707 and U-1958 cells were treated with rapamycin and/or dexamethasone for 48 hours followed by harvest and wash in PBS before staining with AV/PI and subsequent analysis by flow cytometry. Cells were categorized as living cells (AV-negative/PI-negative), apoptotic cells (AV-positive/PI-negative), apoptotic/necrotic cells (AV-positive/PI-positive), or necrotic cells (AV-negative/PI-positive), and the relative cell number was presented as the percentage of 10 000 cells. Three independent experiments per cell line were performed and one representative is shown.
Flow cytometric analysis of cell cycle phases showed that 48-hour treatment with rapamycin clearly induced G0/G1 arrest in both of the MM cell lines, an effect being evident also when cells were cotreated with dexamethasone (Table 3). Dexamethasone itself, however, did not affect the distribution of the cell cycle phases in any of the 2 cell lines.
Further analysis of the LP-1, RPMI 8226, EJM, and U-266-1970 cell lines showed that the rapamycin-induced growth inhibitory effects were mainly related to cell cycle arrest rather than to increased apoptosis (data not shown). However, the rapamycin-mediated sensitization of dexamethasone-induced growth inhibition in RPMI 8226 and LP-1 cells could, at least partly, be explained by an increase of apoptosis (data not shown).
Rapamycin alone or in combination with dexamethasone increases apoptosis in freshly obtained tumor cells from patients with MM
To further elucidate the effects of rapamycin and dexamethasone in MM we included freshly isolated CD138+ plasma cells from 8 patients with MM. Seven of these patients were newly diagnosed with MM, whereas 1 MM patient exhibited stable disease refractory to chemotherapy (Table 1).
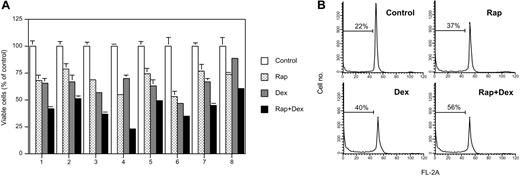
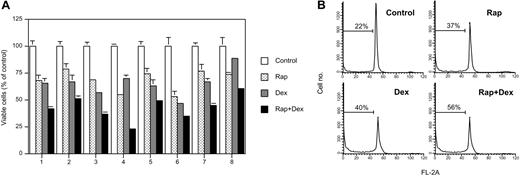
All 8 purified MM samples responded to 20 nM rapamycin with a 20% to 45% decline in viable cells as analyzed by the resazurin assay (Figure 3A). Dexamethasone alone decreased the number of viable cells by 15% to 40%, whereas the combination of rapamycin and dexamethasone resulted in additive effects (Figure 3A).
The effects of rapamycin and dexamethasone on growth and apoptosis in freshly isolated bone marrow plasma cells from patients with MM. (A) Purified CD138+ plasma cells from 8 patients with MM were cultured for 48 hours in the presence of rapamycin and/or dexamethasone followed by addition of resazurin to a final concentration of 10%. After 3 hours of incubation the wells were analyzed by using the resazurin assay, and fluorometry and results are presented as mean ± SD where n = 3. (B) Isolated MM cells from patient 3 were cultured for 48 hours in the presence of rapamycin and/or dexamethasone followed by PI staining of cell nuclei and flow cytometric analysis according to Vindelöv.38 The indicated hypodiploid population reflects the amount of apoptosis in each sample.
The effects of rapamycin and dexamethasone on growth and apoptosis in freshly isolated bone marrow plasma cells from patients with MM. (A) Purified CD138+ plasma cells from 8 patients with MM were cultured for 48 hours in the presence of rapamycin and/or dexamethasone followed by addition of resazurin to a final concentration of 10%. After 3 hours of incubation the wells were analyzed by using the resazurin assay, and fluorometry and results are presented as mean ± SD where n = 3. (B) Isolated MM cells from patient 3 were cultured for 48 hours in the presence of rapamycin and/or dexamethasone followed by PI staining of cell nuclei and flow cytometric analysis according to Vindelöv.38 The indicated hypodiploid population reflects the amount of apoptosis in each sample.
MM cells from patient 3 were subjected to PI staining of cell nuclei followed by flow cytometric analysis. The results show that nearly all MM cells were located in the G0/G1 phase of the cell cycle at 48 hours of incubation (Figure 3B). This finding was also true for cells that had been exposed to rapamycin and/or dexamethasone (Figure 3B). Rapamycin alone increased the hypodiploid fraction, indicating apoptotic cells, from 22% to 40%, similar to what was achieved with dexamethasone (Figure 3B). Combinatorial treatment with rapamycin and dexamethasone resulted in an additive effect with a hypodiploid fraction of more than 55% (Figure 3B), thus confirming the data obtained by the resazurin assay.
Both rapamycin and dexamethasone treatment result in decreased phosphorylation of p70S6K at Thr389 and Thr421/Ser424
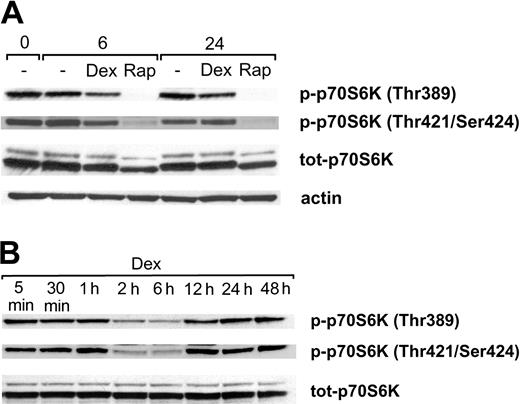
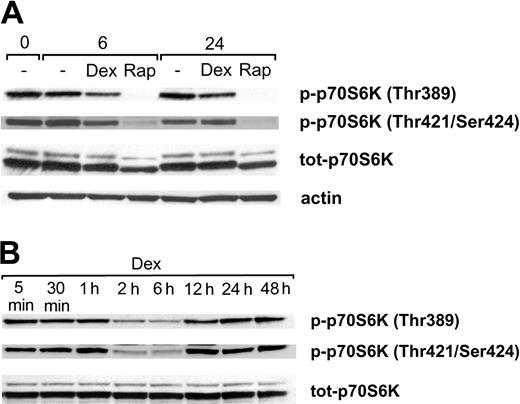
Because rapamycin and dexamethasone previously have been shown to affect the activity/phosphorylation of p70S6K,39-41 we performed Western blotting analysis using antibodies specific for the p70S6K phosphorylation sites Thr389 and Thr421/Ser424. During standard, serum-containing conditions Karpas 707 cells exhibited a substantial level of basal p70S6K phosphorylation at Thr389 and Thr421/Ser424 (Figure 4A). Rapamycin treatment inhibited phosphorylation of p70S6K at Thr389, and no rephosphorylation could be detected at 6 or 24 hours. Similarly, the phosphorylation at Thr421/Ser424 was largely down-regulated by treatment with rapamycin. Additionally, treatment with rapamycin led to a decreased level of p70S6K protein (Figure 4A). A conceivable explanation could be that the disappearance of one of the phosphorylated forms of the protein changes the separation properties of the total protein.
The effect of rapamycin and dexamethasone on phosphorylation of p70S6K at Thr389 and Thr421/Ser424. (A) Karpas 707 cells were treated with rapamycin and/or dexamethasone. At 0, 6, and 24 hours cells were lysed, and extracts were subjected to analysis by Western blotting using antibodies specific for the p70S6K phosphorylation sites Thr389 and Thr421/Ser424. (B) Karpas 707 cells were treated with dexamethasone at indicated times followed by Western blotting analysis of p70S6K phosphorylation as described earlier.
The effect of rapamycin and dexamethasone on phosphorylation of p70S6K at Thr389 and Thr421/Ser424. (A) Karpas 707 cells were treated with rapamycin and/or dexamethasone. At 0, 6, and 24 hours cells were lysed, and extracts were subjected to analysis by Western blotting using antibodies specific for the p70S6K phosphorylation sites Thr389 and Thr421/Ser424. (B) Karpas 707 cells were treated with dexamethasone at indicated times followed by Western blotting analysis of p70S6K phosphorylation as described earlier.
Because treatment with dexamethasone alone also reduced the basal p70S6K phosphorylation at Thr389 and Thr421/Ser424, a more detailed analysis of the kinetics of this effect was performed. This analysis revealed that maximal inhibition of Thr389 and Thr421/Ser424 phosphorylation occurred at 2 to 6 hours (Figure 4B). However, at 12 hours of dexamethasone treatment both sites had been completely rephosphorylated, and no further changes of the phosphorylation levels were observed throughout the entire incubation period of 48 hours. The expression of the p70S6K protein was not affected by dexamethasone (Figure 4B).
Rapamycin increases p27 expression and down-regulates cyclins D2 and D3
The effects of rapamycin on the distribution of cell cycle phases in the Karpas 707 and U-1958 cell lines (Table 3) prompted us to investigate the expression of cell cycle regulatory proteins. Cyclins and cyclin-dependent kinase (CDK) inhibitors regulate the activity of CDKs, which in turn regulate the phosphorylation of several substrates required for cell cycle progression, including pRb.42,43
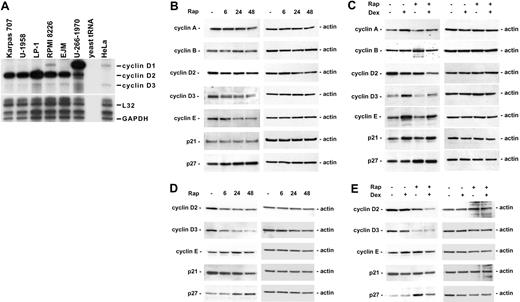
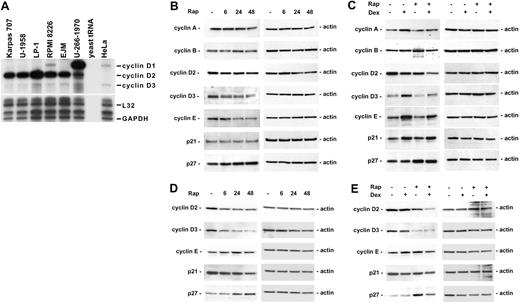
Down-regulation of cyclin D1 has previously been suggested to be the mechanism behind rapamycin-induced cell cycle arrest.44 To determine whether the sensitivity of the MM cell lines to the combination of rapamycin and dexamethasone could be attributed to different expression of cyclin D1, D2, and D3, directly or indirectly by way of genetic alterations, including FGFR345 and c-maf,46 the mRNA expression of these genes was analyzed by using RPA. No clear correlation could be made between cyclin D expression and rapamycin sensitivity in the cell lines tested (Figure 5A). As previously reported, U-266-1970 cells express a high level of cyclin D1 mRNA, corresponding to the 11q13 translocation present in these cells.47 Interestingly, we found that the cell lines most sensitive to the combination of rapamycin and dexamethasone, Karpas 707 and U-1958, actually expressed low levels of cyclin D1 and fairly high levels of cyclin D2 (Figure 5A).
The effect of rapamycin and dexamethasone on cell cycle regulatory proteins. (A) Exponentially growing MM cells were harvested, and total RNA was isolated. RPA was performed by using the multiprobe template hCYC-1. (B-C) Karpas 707 cells or (D-E) U-1958 cells were treated with either (B,D) rapamycin for 6, 24, and 48 hours or (C,E) rapamycin and/or dexamethasone for 24 hours. Cells were lysed and extracts were analyzed by Western blotting by using antibodies specific for p21, p27, and the cyclins A, B, D2, D3, and E.
The effect of rapamycin and dexamethasone on cell cycle regulatory proteins. (A) Exponentially growing MM cells were harvested, and total RNA was isolated. RPA was performed by using the multiprobe template hCYC-1. (B-C) Karpas 707 cells or (D-E) U-1958 cells were treated with either (B,D) rapamycin for 6, 24, and 48 hours or (C,E) rapamycin and/or dexamethasone for 24 hours. Cells were lysed and extracts were analyzed by Western blotting by using antibodies specific for p21, p27, and the cyclins A, B, D2, D3, and E.
The protein levels of cyclin D1, D2, D3, E, and A, which control S-phase entry, and cyclin B (active in G2/M phase), were analyzed in Karpas 707 and U-1958 cells following treatment with rapamycin and/or dexamethasone. In addition, we investigated the expression of CDK inhibitors p21 and p27, which may inhibit the activity of cyclin/CDK complexes and, thus, regulate progression from G1 to S phase. Corresponding to the low cyclin D1 mRNA levels detected in Karpas 707 and U-1958 cells (Figure 5A), no cyclin D1 protein could be detected in these cell lines (data not shown). In the Karpas 707 cells, rapamycin induced a decrease in cyclin E expression and a slight reduction of cyclin D2 and D3 levels (Figure 5B). Also in the U-1958 cells, rapamycin treatment led to reduced cyclin D2 and D3 (Figure 5D), an effect being more prominent than in the Karpas 707 cells. In contrast, cyclin E expression was not regulated in the U-1958 cells as a result of treatment with rapamycin (Figure 5D). Concomitant with the reduction of cyclin D2/D3, the expression of p27 protein was increased in both Karpas 707 and U-1958 cells, whereas p21 levels were not up-regulated (Figure 5B,D).
Combination of rapamycin and dexamethasone induces additive or synergistic down-regulation of cyclin D2
Dexamethasone does not induce cell cycle arrest in the Karpas 707 and U-1958 cell lines, whereas the combination of rapamycin and dexamethasone induces G0/G1 arrest to the same extent as rapamycin alone (Table 3). Treatment of Karpas 707 cells with dexamethasone was associated with enhanced expression of cyclins A, D3, and E and decreased expression of cyclin D2 (Figure 5C). In addition, the level of p21 was increased, whereas p27 expression was not affected. In the U-1958 cells, no changes in cell-cycle regulatory proteins were noted as a result of dexamethasone-treatment (Figure 5E). Notably, in both Karpas 707 and U-1958 cells the cyclin D2 levels were additively or synergistically decreased during combinatorial treatment with rapamycin and dexamethasone (Figure 5C,E).
Combination of rapamycin and dexamethasone down-regulates the expression of survivin
The possibility that rapamycin and/or dexamethasone might affect the expression of certain prosurvival genes was investigated in the Karpas 707 and U-1958 cell lines. Initial analyses on mRNA level suggested a potential regulation of survivin and bcl-xL (data not shown). Thus, these antiapoptotic molecules were selected for analysis of protein expression.
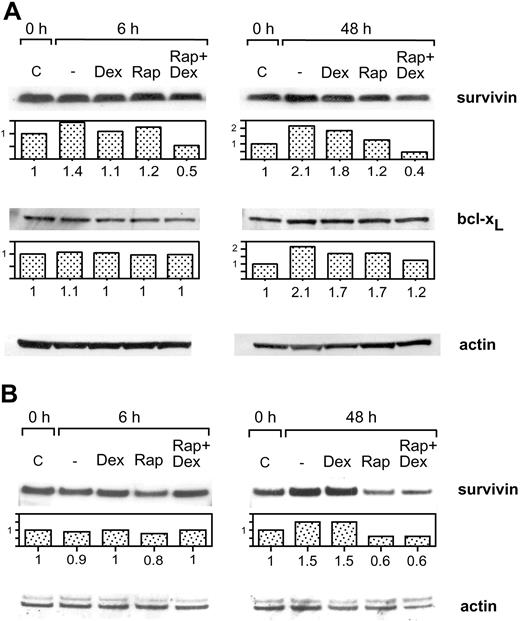
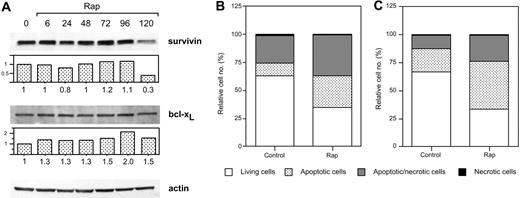
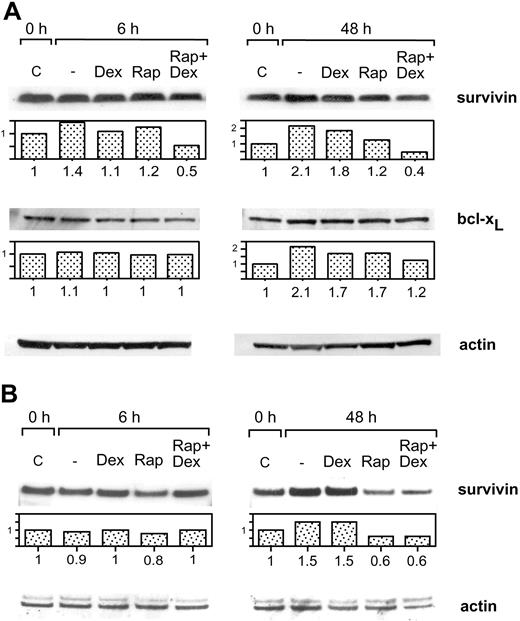
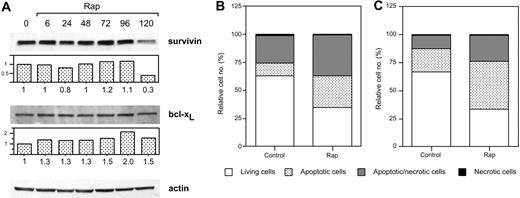
Treatment of Karpas 707 cells with dexamethasone or rapamycin did not decrease the expression of survivin or bcl-xL at 6 or 48 hours. However, the combination of rapamycin and dexamethasone resulted in diminished expression of survivin, whereas bcl-xL was not down-regulated (Figure 6A). Also in U-1958 cells survivin was down-regulated as a consequence of combined treatment with rapamycin and dexamethasone for 48 hours (Figure 6B). However, in this cell line rapamycin alone diminished the expression of survivin. When Karpas 707 cells were subjected to long-term treatment with rapamycin, a 70% decrease in survivin expression could be demonstrated (Figure 7A). This effect correlated with an increased amount of apoptosis as analyzed by AV/PI staining at 144 hours (Figure 7B). Long-term rapamycin treatment of the U-1958 cells also resulted in increased apoptosis (Figure 7C). bcl-xL levels were not down-regulated by rapamycin in any of the cell lines even at long-term treatment (Figure 7A and data not shown).
The effect of rapamycin and dexamethasone on the expression of survivin and bcl-xL (A) Karpas 707 cells were treated with rapamycin and/or dexamethasone for 6 and 48 hours. The cells were lysed, and extracts were subjected to analysis by Western blotting using antibodies specific for the antiapoptotic proteins survivin and bcl-xL. The expression was quantified and expressed as compared with control. (B) U-1958 cells were treated with rapamycin and/or dexamethasone for 6 and 48 hours. The cells were lysed, and extracts were subjected to analysis by Western blotting using antibodies specific for the antiapoptotic protein survivin.
The effect of rapamycin and dexamethasone on the expression of survivin and bcl-xL (A) Karpas 707 cells were treated with rapamycin and/or dexamethasone for 6 and 48 hours. The cells were lysed, and extracts were subjected to analysis by Western blotting using antibodies specific for the antiapoptotic proteins survivin and bcl-xL. The expression was quantified and expressed as compared with control. (B) U-1958 cells were treated with rapamycin and/or dexamethasone for 6 and 48 hours. The cells were lysed, and extracts were subjected to analysis by Western blotting using antibodies specific for the antiapoptotic protein survivin.
The effects of long-term rapamycin treatment on survivin and bcl-xL expression and on apoptosis. (A) Karpas 707 cells were incubated in the presence of rapamycin. Every 48 hours half of the spent medium was exchanged together with addition of fresh rapamycin. At 0, 6, 24, 48, 72, 96, and 120 hours cells were lysed, and extracts were subjected to Western blotting analysis by using antibodies specific for the antiapoptotic proteins survivin and bcl-xL. (B) Karpas 707 and U-1958 cells were treated with rapamycin as described earlier, and cells were harvested at 144 hours. Apoptosis was analyzed by AV/PI staining, and the cells were categorized as described in the legend for Figure 2. The relative cell number is presented as the percentage of 10 000 cells. Three independent experiments per cell line were performed and one representative is shown.
The effects of long-term rapamycin treatment on survivin and bcl-xL expression and on apoptosis. (A) Karpas 707 cells were incubated in the presence of rapamycin. Every 48 hours half of the spent medium was exchanged together with addition of fresh rapamycin. At 0, 6, 24, 48, 72, 96, and 120 hours cells were lysed, and extracts were subjected to Western blotting analysis by using antibodies specific for the antiapoptotic proteins survivin and bcl-xL. (B) Karpas 707 and U-1958 cells were treated with rapamycin as described earlier, and cells were harvested at 144 hours. Apoptosis was analyzed by AV/PI staining, and the cells were categorized as described in the legend for Figure 2. The relative cell number is presented as the percentage of 10 000 cells. Three independent experiments per cell line were performed and one representative is shown.
IGF-I or IL-6 at high concentrations only partially rescues MM cells treated with the combination of rapamycin and dexamethasone
Because the concentration of MM prosurvival factors in vivo might be higher than what is achieved in vitro during standard, serum-containing culture conditions, we examined whether exogenously added rIGF-I, LongR3-IGF-I, or rIL-6 could diminish the inhibitory effects of rapamycin and/or dexamethasone. The IGF-I analog LongR3-IGF-I was included in the experiments, because it has been shown to be more potent than the native molecule.32 In the experiments MM cells were incubated with rapamycin, dexamethasone, and ligands for 48 hours followed by analysis using the resazurin assay.
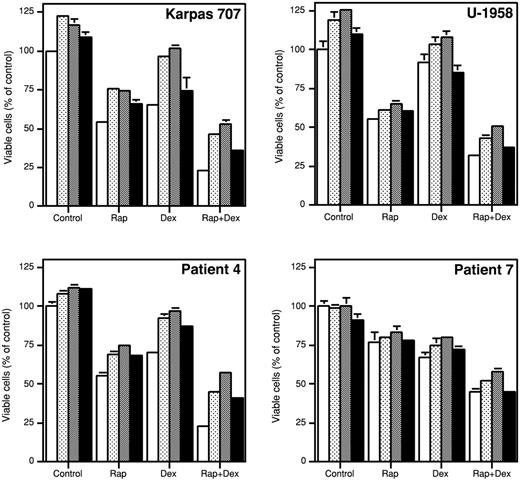
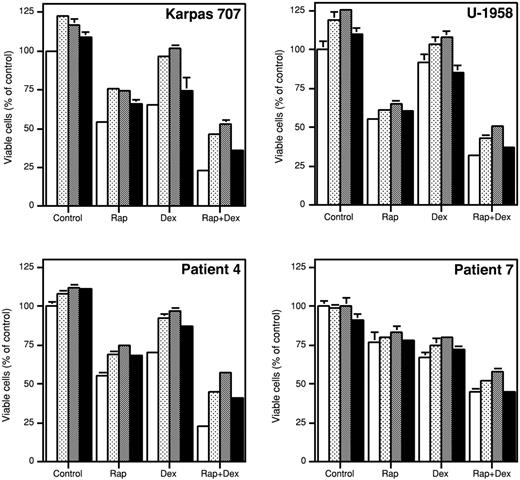
In the Karpas 707 cells, rIGF-I, LongR3-IGF-I, and rIL-6 slightly, but statistically significantly (P < .05), increased the number of viable cells as compared with control cultures (Figure 8). The growth inhibitory effect of dexamethasone was completely neutralized by rIGF-I and LongR3-IGF-I, whereas it was not affected by rIL-6 (Figure 8). None of the ligands were able to fully reverse the inhibitory effect of rapamycin alone or in combination with dexamethasone (Figure 8). Similar results were obtained using the U-1958 cell line (Figure 8).
The effect of survival factors on growth inhibition induced by rapamycin and/or dexamethasone. Karpas 707 cells, U-1958 cells, or purified MM cells from patient 4 or patient 7 were preincubated for 1 hour with rapamycin and/or dexamethasone (open bars) before addition of the MM survival factors rIGF-I (dotted bars), LongR3-IGF-I (shaded bars), or rIL-6 (filled bars). At 48 hours the relative number of viable cells was analyzed by the resazurin assay. Three independent experiments were preformed, and one representative is shown. The results are presented as mean ± SD, where n = 3.
The effect of survival factors on growth inhibition induced by rapamycin and/or dexamethasone. Karpas 707 cells, U-1958 cells, or purified MM cells from patient 4 or patient 7 were preincubated for 1 hour with rapamycin and/or dexamethasone (open bars) before addition of the MM survival factors rIGF-I (dotted bars), LongR3-IGF-I (shaded bars), or rIL-6 (filled bars). At 48 hours the relative number of viable cells was analyzed by the resazurin assay. Three independent experiments were preformed, and one representative is shown. The results are presented as mean ± SD, where n = 3.
To test the relevance of the findings obtained with the Karpas 707 and the U-1958 cell lines, we used 2 of the tumor samples previously presented in Figure 3 (patients 4 and 7). In the primary MM cells from patient 4, the addition of rIGF-I, LongR3-IGF-I, or rIL-6 slightly, but statistically significantly (P < .05), increased the number of viable cells as compared with control (Figure 8). Furthermore, rIGF-I, LongR3-IGF-I, and rIL-6 substantially reduced the amount of apoptosis induced by dexamethasone. The responses of the tumor cells from patient 7 were generally weaker. However, in both patient samples none of the ligands could fully counteract the apoptosis induced by rapamycin alone or in combination with dexamethasone, thus confirming data obtained by using the Karpas 707 and the U-1958 cell lines (Figure 8).
IGF-I– and IL-6–stimulated increase of p70S6K phosphorylation at Thr389 and Thr421/Ser424 is suppressed by treatment with rapamycin alone or in combination with dexamethasone
To investigate whether survival-promoting ligands at high concentrations were able to rephosphorylate/reactivate p70S6K despite treatment with rapamycin/dexamethasone, rIGF-I, LongR3-IGF-I, or rIL-6 was added to cultures with Karpas 707 cells preincubated for 1 hour in the presence of rapamycin with or without dexamethasone. After 10 minutes of exposure to the ligands the cells were lysed, and extracts were analyzed for p70S6K activity using phosphorylate-specific antibodies as described previously.
Clearly, rIGF-I, rIL-6, or LongR3-IGF-I stimulated phosphorylation of the p70S6K at Thr389 and Thr421/Ser424 as well as the Akt kinase at Ser473 (Figure 9). However, in cells that had been preincubated in the presence of rapamycin with or without dexamethasone, both basal and ligand-induced phosphorylation of p70S6K at Thr389 and Thr421/Ser424 were suppressed. In these experiments the suppression of Thr389 phosphorylation was complete, whereas Thr421/Ser424 phosphorylation was clearly down-regulated (Figure 9). Notably, ligand-induced phosphorylation of p70S6K at Thr421/Ser424 was more down-regulated in cells pretreated with both rapamycin and dexamethasone than in cells pretreated with rapamycin alone. The level of ligand-induced phosphorylation of Akt kinase at Ser473 was not affected by pretreatment with rapamycin in the presence or absence of dexamethasone (Figure 9).
The effects of survival factors on p70S6K and Akt phosphorylation in cells pretreated with rapamycin and/or dexamethasone. Karpas 707 cells were pretreated with rapamycin in the absence or presence of dexamethasone for 1 hour, before incubation with rIGF-I, LongR3-IGF-I (LR3), or rIL-6 for 10 minutes followed by lysis. The extracts were analyzed by Western blotting using antibodies specific for the p70S6K phosphorylation sites Thr389 and Thr421/Ser424 and the Akt phosphorylation site Ser473.
The effects of survival factors on p70S6K and Akt phosphorylation in cells pretreated with rapamycin and/or dexamethasone. Karpas 707 cells were pretreated with rapamycin in the absence or presence of dexamethasone for 1 hour, before incubation with rIGF-I, LongR3-IGF-I (LR3), or rIL-6 for 10 minutes followed by lysis. The extracts were analyzed by Western blotting using antibodies specific for the p70S6K phosphorylation sites Thr389 and Thr421/Ser424 and the Akt phosphorylation site Ser473.
Discussion
Although many patients with MM initially respond to chemotherapy, drug resistance eventually develops and, thus, prevents curative treatment. Detailed mapping of intracellular molecules and signaling pathways might provide more efficient, less toxic treatment opportunities, whereby cellular components, critical for survival of the tumor, can be selectively targeted. The phosphoprotein mTOR, downstream (eg, the IGF-IR), constitutes a central kinase whose activity can be selectively inhibited by the immunosuppressive drug rapamycin. Although the antineoplastic effect of rapamycin was discovered 20 years ago, it was not until the discovery of mTOR14 that rapamycin gained increased attention as a potential anticancer drug.20
All but one of the MM cell lines responded to rapamycin with 50% growth inhibition at 72 hours, and analysis of cell cycle phases demonstrated a clear G0/G1 arrest. Notably, the RPMI 8226 cell line, previously reported to be a nonresponder,48 was least sensitive to rapamycin, exhibiting 20% growth inhibition. In freshly obtained tumor cells from 8 patients with MM, however, rapamycin itself induced apoptosis. This unique finding was true also for cells from a patient with MM exhibiting stable disease not responding to chemotherapy (patient 3), indicating that rapamycin might be of therapeutical benefit also in patients with MM exhibiting drug resistance. The fact that rapamycin induces apoptosis in primary, noncycling MM cells contrasts to what was recently demonstrated in primary tumor cells from patients with B-CLL.25 Possibly, the characteristic feature of MM cells as representing close to terminally differentiated B cells might influence their ability to respond to rapamycin with apoptosis.
After incubation with rapamycin for 48 hours, only minor increases of apoptosis could be detected in the MM cell lines. Previously, the response to rapamycin has been attributed to a constitutively activated Akt.49 However, in this study sensitivity to rapamycin could not be correlated with high Akt activity (data not shown). When rapamycin was combined with dexamethasone, the amount of apoptosis drastically increased in 2 cell lines. A similar rapamycin-mediated sensitization to dexamethasone-induced apoptosis could also be demonstrated in purified bone marrow samples from 8 patients with MM, thus suggesting that this drug combination might be active also in vivo. Rapamycin has previously been shown to increase the sensitivity of murine T-cell lines to apoptosis induced by cisplatin.50 In line with this finding, preliminary data from our group demonstrate that rapamycin might also sensitize MM cells to apoptosis induced by doxorubicin and melphalan (data not shown). Thus, it is reasonable to suggest that signaling by ways of mTOR might be of central importance for the cellular resistance to apoptosis induced by diverse cytotoxic stimuli.
The basal level of p70S6K phosphorylation at Thr389 and Thr421/Ser424 was effectively down-regulated by rapamycin treatment, thus corroborating data previously obtained by others.49,51,52 Moreover, rapamycin also inhibited the expression of the p70S6K protein; however, the significance of this finding remains elusive. Dexamethasone temporarily down-regulated the basal phosphorylation of p70S6K at Thr389 and Thr421/Ser424 with maximum effect detected at 2 to 6 hours after induction. At 12 hours both sites were rephosphorylated and were not subjected to further regulation. Inhibitory effects of dexamethasone on p70S6K phosphorylation have previously been demonstrated in myoblasts41 and also in MM cells.40 However, the dexamethasone-induced transient down-regulation of p70S6K phosphorylation at Thr389 and Thr421/Ser424 represents an interesting new finding.
Although rapamycin has well-established effects on cell cycle phases and on expression of cell cycle regulatory proteins in different cell types,53 only a few studies have been conducted using MM cells.48,51 Although cyclin D1 down-regulation previously has been suggested to be a plausible mechanism behind rapamycin-induced growth arrest,44 cyclin D1 levels have been shown to remain unchanged during rapamycin treatment of both resistant and sensitive MM cells.49 We found that in Karpas 707 and U-1958 cells, the rapamycin-induced G0/G1 arrest was accompanied by a down-regulation of cyclin D2 and D3. Concomitantly, the CDK inhibitor p27 was up-regulated. Combined, these changes are likely to invoke the observed rapamycin-induced G0/G1 arrest in MM cells. Interestingly, a rapamycin-induced p27 up-regulation was detected in healthy tonsillar B cells, in agreement with our results using MM cells, but was not observed in cycling B-CLL cells.25 Although dexamethasone treatment of Karpas 707 cells was associated with p21 up-regulation, in accordance with previous observations in MM cells,54 this up-regulation did not result in G0/G1 arrest, possibly because of a simultaneous up-regulation of cyclins A, D3, and E. Similar to rapamycin, dexamethasone also down-regulated cyclin D2 in Karpas 707 cells, an effect previously demonstrated with the use of the ANBL6 MM cell line.55 In U-1958 cells, dexamethasone alone did not induce any changes in cell cycle regulatory proteins. Interestingly, combinatorial treatment with rapamycin and dexamethasone induced down-regulation of cyclin D2 to levels below what was achieved by either agent alone in both Karpas 707 and U-1958 cells. This effect was clearly synergistic in U-1958 cells because dexamethasone alone did not reduce cyclin D2 levels in this cell line. It is conceivable that the observed cell cycle arrest in response to the combination of rapamycin and dexamethasone results from increased expression of CDK inhibitor p27 coupled to an additive or synergistic down-regulation of cyclin D2.
The prosurvival molecule survivin has emerged as a promising target in cancer therapy because its expression seems to be restricted mainly to malignant cells.56 Down-regulation of survivin has recently been demonstrated in MM cells treated with various nuclear factor-kappaB inhibitors.57 The massive apoptosis induced by the combination of rapamycin and dexamethasone in Karpas 707 and U-1958 cells correlated with a decrease in survivin protein expression. Although 48 hours of rapamycin-treatment of Karpas 707 and U-1958 cells mainly led to inhibitory effects on cell cycle progression, long-term exposure also increased the amount of apoptosis. In the Karpas 707 cell line this effect was paralleled by a decrease in survivin expression. Survivin is abundantly expressed in MM cell lines but seems to be low or absent in freshly obtained MM cells (A.H. et al, manuscript in preparation, May 10, 2003). Therefore, it is tempting to speculate that the increased sensitivity of primary MM cells to rapamycin-induced apoptosis might be explained by their insufficient expression of survivin.
Because the bone marrow provides the MM cells with a milieu rich in survival factors, we assessed whether the antiapoptotic ligands IGF-I, LongR3-IGF-I, and IL-6 at high concentrations could quench the inhibitory effects achieved by rapamycin and dexamethasone. Using both the Karpas 707 and the U-1958 cell lines as well as freshly isolated MM cells, we found that all 3 ligands only partially counteracted the growth inhibition induced by rapamycin alone or in combination with dexamethasone. Western blotting analysis of the phosphorylation of p70S6K at Thr389 and Thr421/Ser424 revealed that, although IGF-I or IL-6 was able to increase phosphorylation at both sites, Thr389 remained unphosphorylated when cells had been preincubated in the presence of rapamycin with or without dexamethasone. However, phosphorylation at Thr421/Ser424 could still be increased, but to a much lesser extent. Importantly, the attenuated ligand-induced phosphorylation of p70S6K at Thr421/Ser424 was even more pronounced when rapamycin was combined with dexamethasone. This effect seemed not to be governed by way of a decrease in Akt phosphorylation because pretreatment with rapamycin in the presence or absence of dexamethasone did not affect the degree of ligand-induced phosphorylation of Akt at its activating site Ser473.
We show in this paper that rapamycin induces apoptosis in primary MM cells. In MM cell lines, rapamycin had mainly cytostatic effects, but, interestingly, rapamycin sensitizes these cells to dexamethasone-induced apoptosis. This effect correlated with a substantial decrease in expression of cyclin D2 and the antiapoptotic protein survivin. The addition of survival factors at high concentrations only partly restored the inhibitory effects of combinatorial treatment with rapamycin and dexamethasone, suggesting that rapamycin may be a useful drug in combination with conventional treatment of MM.
Prepublished online as Blood First Edition Paper, December 24, 2003; DOI 10.1182/blood-2003-05-1543.
Supported by grants from the Swedish Cancer Society, the Multiple Myeloma Research Foundation (MMRF), Hans von Kantzows Stiftelse and Selanders Stiftelse.
The publication costs of this article were defrayed in part by page charge payment. Therefore, and solely to indicate this fact, this article is hereby marked “advertisement” in accordance with 18 U.S.C. section 1734.
We thank Pernilla Martinsson and Charlotta Sandberg for excellent skillful technical assistance.

