Abstract
Leukocyte function antigen 1 (LFA-1) is essential for the formation of immune cell synapses and plays a role in the pathophysiology of various autoimmune diseases. We investigated the molecular details of LFA-1 activation during adhesion between cytotoxic cells and a target model leukemia cell. The cytolytic activity of a CD3–CD8+CD56+ natural killer (NK) subset was enhanced when LFA-1 was activated. In a comparison of LFA-1 ligands, intercellular adhesion molecule 2 (ICAM-2) and ICAM-3 promoted LFA-1–directed perforin release, whereas ICAM-1 had little effect. Ligand-induced LFA-1 clustering facilitated perforin release, demonstrating LFA-1 could regulate degranulation mechanisms. LFA-1 induced the activation of src family kinases, Vav1 and p44/42 mitogen-activated protein kinase (MAPK), in human CD56+ NK cells as evidenced by intracellular phospho-epitope measurements that correlated with effector-target cell binding and perforin-granzyme A–mediated cytolytic activity. These results identify novel, specific functional consequence of LFA-1–mediated cytolytic activity in perforin-containing human NK subsets.
Introduction
Leukocyte function antigen 1 (LFA-1) is an αβ heterodimer integrin involved in leukocyte adhesion.1 LFA-1 participates in lymphocyte adhesion, with prominent roles in the formation of the immunologic synapse2 and lymphocyte extravasation.3 LFA-1 adhesion is governed by the intercellular adhesion molecule 1 (ICAM-1), ICAM-2, and ICAM-3 ligands.1 Patients with leukocyte adhesion deficiency (LAD) disorder, a syndrome in which the LFA-1 integrin is mutated or missing, suffer severe recurrent bacterial infections and impaired overall immunity.4 The molecular details underlying such immunopathologies are not well understood.5,6
Functional studies of murine LFA-1–/– natural killer (NK) cells have shown that LFA-1 is necessary for NK killing activated by interleukin 2 (IL-2) and IL-12.7 LFA-1–/– CD8+ T cells are also defective for T-cell activation and effector function.8 Blocking the LFA-1/ICAM interaction inhibits effector-target cell adhesion, impairing cytolytic activity in NK cells.7,9,10 Cytotoxicity is also defective in NK cells from patients with LAD.11 NK cells represent a heterogeneous cell population with varying cytolytic effector functions.12-14 Immunophenotyping of NK cell subsets is insufficient for identifying functional differences among subsets because surface markers do not necessarily correlate with cytolytic effector function.15,16 We therefore investigated the molecular details of LFA-1 signaling in NK cells to characterize an LFA-1–specific function for NK cell cytotoxicitiy.17
In studying the functional outcome of LFA-1 ligation, we observed a functional difference between cells that express intermediate (CD8med) and high (CD8high) levels of CD8. Monitoring intracellular contents of perforin and granzyme A indicates that the CD56+CD8+ subsets contain high amounts of both perforin and granzyme A. We report that exocytosis of the cytolytic granules containing both perforin and granzyme A is coupled to LFA-1–mediated signaling mechanisms through src kinases, syk, Vav1, and p44/42 mitogen-activated protein kinase (MAPK), as assessed by intracellular phosphoprotein analysis. Inhibition of src, syk, or p44/42 inhibited cytolytic activity at either LFA-1 adhesion or LFA-1–directed perforin release, blocking NK cell killing activity. These results suggest that effector-target cell conjugation via LFA-1 activation of intracellular signals can facilitate perforin release in NK cell subsets.
Materials and methods
Immunologic and chemical reagents
Monoclonal antibodies (mAbs) to LFA-1 (clone 27), killer inhibitory receptor (KIR), NKG2D, ICAM-1, ICAM-3, CD3, CD4, CD8, CD11a, CD16, CD18, CD19, CD56, CD45 direct conjugates (fluorescein isothiocyanate/phycoerythrin/peridinin chlorophyll protein/cyanin5.5/allophycocyanin/biotin [FITC/PE/PerCP/PerCPCy5.5/APC/biotin]), granzyme A, and perforin (δG9; FITC/PE) were obtained from PharMingen (San Diego, CA). Perforin-Cy5 (δG9) and CD8-Cy5PE were gifts from the Herzenberg Laboratory (Stanford University, Stanford, CA). ICAM-2 mAb and ICAM-2/FITC (IC2/2) were from Research Diagnostics (Flanders, NJ). Phospho-specific antibodies to β1(Y785), Lck(S158), protein kinase C (PKC)θ(S695), PKCθ(T538), Slp76(Y145), PKCθ(S676), Src(Y418), β3(Y785), β3(Y773), Ikkα(S176/180), cRaf(S259), Gsk3α(S9), JNK(Y183/T185), Lat(Y132), Lck(Y192), PKCδ(T505), and Vav1(Y160) were from Biosource (Camarillo, CA). Phospho-specific antibodies to cJun(S63), Syk(Y525/526), Mek1/2(S217/221), phospholipase C (PLC)γ1(Y783), PKC-PAN, and PKCδ(S643) were from Cell Signaling Technology (Beverly, MA). Phospho-specific antibodies to p44/42(T201/Y202), Gsk3β(Y279), and Ikkα(S32/36) were from PharMingen. Phospho-specific antibodies to β2(S745) and β2(S756) were from C. C. Gahmberg (Helsinki University, Helsinki, Finland). LFA-1 antibody clones TS1/22 and TS1/18 were obtained from the Developmental Hybridoma Studies Bank (University of Iowa); clone CTB104 was from Santa Cruz Biotechnology (Santa Cruz, CA). Protein and chemical reagents used and sources included FITC (Pierce, Rockford, IL); Alexa Fluor dye series 488, 546, 568, 647, 660, 680, and chloromethylfluorescein diacetate (CMFDA; Molecular Probes, Eugene, OR); piceatannol, PP2, and PD98059 (Calbiochem, San Diego, CA); recombinant human IL-2 (Roche, Indianapolis, IN); recombinant human ICAM-1-FC, ICAM-2-Fc, ICAM-3-Fc (R&D Systems, Minneapolis, MN); and recombinant human IL-12 (BD Biosciences). ICAM-2 protein (500 μg) was conjugated to 2 × 10⁸ epoxy-activated beads (Dynal, Oslo, Norway). Beads (4 × 10⁵) containing a total of 2 μg ICAM-2 protein were used (see “Cytolytic activity, perforin release assays, and conjugate formation assays”). Mock treatments consisted of mouse IgG for antibodies, 1% bovine serum albumin (BSA) for proteins, or 0.001% dimethyl sulfoxide (DMSO) vehicle for chemicals.
Cell culture
Jurkat, U937, and HL60 cells were maintained in RPMI 1640, 10% fetal calf serum (FCS), 1% penicillin-streptomycin-glutamate (PSQ) at 1 × 10⁵ cells/mL. K562 cells were maintained in Iscove modified Dulbecco medium with 4 mM l-glutamine adjusted to contain 1.5 g/L sodium bicarbonate, 10% FCS, and 1% PSQ. Daudi cells were maintained in RPMI 1640 modified to contain 2 mM l-glutamine, 10 mM HEPES (N-2-hydroxyethylpiperazine-N′-2-ethanesulfonic acid), 1 mM sodium pyruvate, 4500 mg/L glucose, and 1500 mg/L sodium bicarbonate. Cells were maintained at 5% CO2 at 37° C in a humidified incubator. Human peripheral blood lymphocytes were obtained by Ficoll-plaque density centrifugation (Amersham Pharmacia, Uppsala, Sweden) from healthy donors (Stanford Blood Bank, Stanford, CA) and depleted for adherent cells. Lymphocytes were cultured in 5% male human sera (type AB, Irvine Scientific, Irvine, CA), RPMI 1640 with 1% PSQ.
Flow cytometry
Intracellular and extracellular staining was performed as described.18,19 Intracellular probes for active kinases were made by conjugating phospho-specific antibodies to the Alexa Fluor dye series as described and used in phosphoprotein optimized conditions. Cells were fixed in tissue culture plates at 1 × 10⁶ cells/mL (2% paraformaldehyde [PFA] final concentration) for 15 minutes at 37° C. Cells were seeded into 96-well plates and permeabilized with Perm/Wash (BD Biosciences) containing 4% FCS, for 15 minutes at 4° C. Cells were stained with antibody cocktails in Perm/Wash (30 minutes, 25° C) and washed twice (Perm/Wash). All centrifugation and flow cytometric processes were performed on ice with ice-cold buffers using pretitered antibodies at optimal antibody concentrations and fluorophore-to-protein (FTP) ratios. Intracellular perforin and granzyme A analyses were performed using similar paraformaldehyde/saponin-based buffers. Methanol permeabilization did not work for these subsets. Fourcolor flow cytometry data were collected on a FACSCalibur machine (Becton Dickinson, San Jose, CA) and are representative of 3 independent experiments. Data were analyzed using Flowjo software (Treestar, San Carlos, CA). Phosphorylated kinase clustering analysis was done with Hierarchical Cluster Explorer (University of Maryland).
Fluorescence-activated cell sorting (FACS) was performed using 3-color sorting with live cell gating and surface markers CD3-PerCPCy5.5, CD56-PE, and CD8-FITC or CD16-FITC, CD56-PE, CD8-PerCPCy5.5 on a FACS Vantage machine (Becton Dickinson). Sorted cells were supplemented with 200 ng/mL IL-2 for 12 hours after sorting. In experiments involving sorted cells comparisons were made for cells from the same donor.
Cytolytic activity, perforin release assays, and conjugate formation assays
Target cell lysis was measured by flow cytometric-based detection of CMDFA-labeled target cells. HL60, K562, Daudi, Jurkat, or U937 cells were labeled with 1 μg CMFDA (30 minutes, 37° C). Effector cells were washed twice and mock treated, IL-2 or IL-12 activated (200 ng/mL, 12 hours), or treated with ICAM-2 beads or soluble ICAM-1, ICAM-2, or ICAM-3 fusion proteins (10 μg/mL, 30 minutes, 37° C) before plating into 96-well round-bottom plates with target cells at varying effector-target ratios and were then incubated at 37° C for 4 hours. Cells were then processed for multiparameter flow cytometry. Cells were fixed in 1% paraformaldehyde, permeabilized in 0.2% saponin, and stained with antibody cocktails in permeabilization buffer. Percent specific lysis was calculated using the following equation: % specific lysis = [CMFDA+PI+]/[CMFDA+] × 100. Percent perforin was calculated using the following equation: % perforin = 100 × [(experimental perforin MFI – isotype mAb MFI)/(total perforin MFI – isotype mAb MFI)]. MFI refers to median fluorescent intensity of flow cytometric-based intracellular detection. Cell conjugates were determined by flow cytometry as described.20 Chemical inhibition experiments used 10 μM indicated compound (30 minutes, 37° C) prior to stimulation except where noted. All experiments were performed in triplicate.
Results
LFA-1 is involved in effector-target cell adhesion and facilitates human cytotoxic cell activation
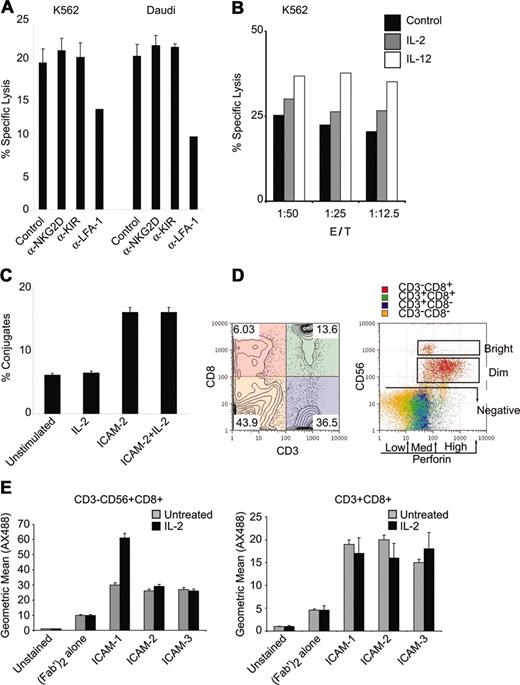
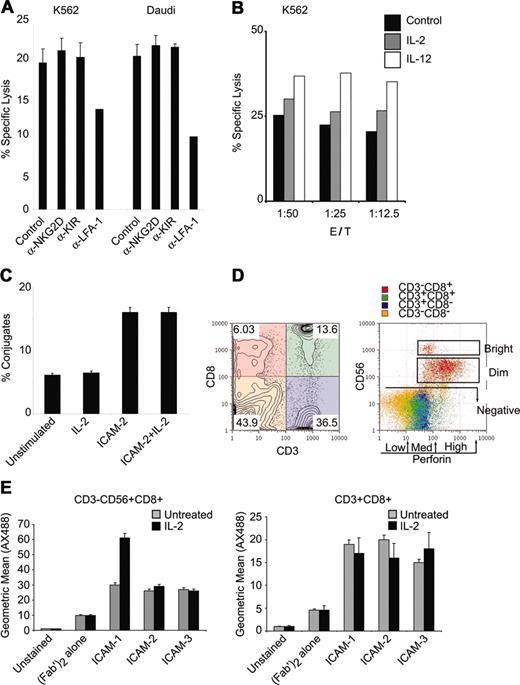
We used a flow cytometric effector-target killing assay21 to quantitatively monitor lysis of a human erythroleukemia cell line (K562 cells) and a Burkitt lymphoma cell line (Daudi cells) in the presence of fresh lymphocytes. Cytotoxicity toward both K562 and Daudi cells was observed (Figure 1A). Specific cell lysis was dependent on LFA-1 because blocking antibodies inhibited the cytotoxic activity against both cell types (Figure 1A). Antibodies to the NKGD receptor, an NK cell receptor that can facilitate NK cell activity, did not diminish cytotoxicity in these assays (Figure 1A). Blocking antibodies to the NK cell inhibitor receptor KIR did not attenuate NK cell cytotoxicity (Figure 1A). These results suggest that LFA-1 is essential for cytotoxic function.
NK cytolytic activity is dependent on LFA-1. (A) Fresh lymphocytes were tested for natural cytolysis of CMFDA-labeled K562 or Daudi tumor cell lines in a 4-hour flow cytometric killing assay at 1:12.5 target cell/NK cell target ratio. Samples were incubated with α-NKG2D, α-KIR, or α–LFA-1 (clone TS1/22) antibodies (10 μg/mL). (B) Lymphocytes were treated with IL-2 or IL-12 (200 ng/mL) for 12 hours and incubated with K562 targets at the indicated target/NK ratio and specific lysis was assessed by flow cytometry. (C) Lymphocytes were treated with IL-2 (200 ng/mL) or ICAM-2 (1 μg) and incubated with CMDFA-labeled K562 cells. Lymphocytes were prestained with CD56-PerCPCy5.5 for 10 minutes, mixed with K562 cells at 1:12.5 target cell/NK ratio for 10 minutes, and fixed directly in 2% PFA. Conjugates were assessed as previously described.20 (D) PBMCs depleted for adherent cells were stained for surface CD3-PerCPCy5.5, CD8-PE, CD56-APC, and intracellular perforin-FITC expression. Quadrant gating for CD3 and CD8 is color coded and displayed on CD56 and perforin parameters for gated populations. Distinction between CD56bright and CD56dim and the distinctions among perforin low, medium, and high levels are displayed. Subset frequencies for intracellular perforin levels in CD3+/–CD8+/–CD56+/– subsets are displayed in Table 1. Numbers in each quadrant correspond to population frequencies within those quadrants. (E) ICAM binding to CD56+CD8+ NK cells and CD3+CD8+ cells. The 1 × 10⁶ cells that were cultured in the presence or absence of IL-2 (100 ng/mL, 12 hours) were labeled with ICAM-1, ICAM-2, or ICAM-3 fusion proteins (1.25 μg) at 37°C for 15 minutes in the presence of mouse IgG MOPC21 (4 μg/mL) and human sera. Cells were washed and stained with goat antihuman FC-AX488 (Fab′)2, and CD56-PE, CD8-PerCPCy5.5, and CD3-APC. Geometric means for ICAM-AX488 are displayed for CD3– CD56+CD8+ and CD3+CD8+ gated populations. Error bars in panels A, C, and E indicate standard deviation of at least 3 experiments.
NK cytolytic activity is dependent on LFA-1. (A) Fresh lymphocytes were tested for natural cytolysis of CMFDA-labeled K562 or Daudi tumor cell lines in a 4-hour flow cytometric killing assay at 1:12.5 target cell/NK cell target ratio. Samples were incubated with α-NKG2D, α-KIR, or α–LFA-1 (clone TS1/22) antibodies (10 μg/mL). (B) Lymphocytes were treated with IL-2 or IL-12 (200 ng/mL) for 12 hours and incubated with K562 targets at the indicated target/NK ratio and specific lysis was assessed by flow cytometry. (C) Lymphocytes were treated with IL-2 (200 ng/mL) or ICAM-2 (1 μg) and incubated with CMDFA-labeled K562 cells. Lymphocytes were prestained with CD56-PerCPCy5.5 for 10 minutes, mixed with K562 cells at 1:12.5 target cell/NK ratio for 10 minutes, and fixed directly in 2% PFA. Conjugates were assessed as previously described.20 (D) PBMCs depleted for adherent cells were stained for surface CD3-PerCPCy5.5, CD8-PE, CD56-APC, and intracellular perforin-FITC expression. Quadrant gating for CD3 and CD8 is color coded and displayed on CD56 and perforin parameters for gated populations. Distinction between CD56bright and CD56dim and the distinctions among perforin low, medium, and high levels are displayed. Subset frequencies for intracellular perforin levels in CD3+/–CD8+/–CD56+/– subsets are displayed in Table 1. Numbers in each quadrant correspond to population frequencies within those quadrants. (E) ICAM binding to CD56+CD8+ NK cells and CD3+CD8+ cells. The 1 × 10⁶ cells that were cultured in the presence or absence of IL-2 (100 ng/mL, 12 hours) were labeled with ICAM-1, ICAM-2, or ICAM-3 fusion proteins (1.25 μg) at 37°C for 15 minutes in the presence of mouse IgG MOPC21 (4 μg/mL) and human sera. Cells were washed and stained with goat antihuman FC-AX488 (Fab′)2, and CD56-PE, CD8-PerCPCy5.5, and CD3-APC. Geometric means for ICAM-AX488 are displayed for CD3– CD56+CD8+ and CD3+CD8+ gated populations. Error bars in panels A, C, and E indicate standard deviation of at least 3 experiments.
Because IL-2, IL-12, IL-15, and IL-18 can enhance mature NK cell cytotoxicity,22-24 we investigated whether cytokine stimulation would promote LFA-1–mediated cytotoxicity. IL-2 treatment enhanced cytotoxicity at various effector-target cell ratios, with IL-12 demonstrating a strong enhancement (Figure 1B). LFA-1 adhesion can be promoted by IL-12,25 IL-15,25 and various chemokines (SD1-α and IL-8).26,27 It is therefore possible that an enhancement in cellular adhesion by LFA-1 is responsible for the increased cytolytic activity observed after treatment with IL-12. We tested if treatment with IL-2 promoted cellular adhesion in NK cells. IL-2 treatment did not enhance conjugate formation between CD56+ NK cells and target cells (Figure 1C). Stimulation with an LFA-1 ligand promoted conjugate adhesion (Figure 1C), as previously described.28
CD56 expression correlates with high perforin content and enhanced cytolytic activity on LFA-1 stimulation
We tried to determine whether the LFA-1–mediated cytotoxicity observed was unique to an NK cell subset or to cytotoxic T lymphocytes (CTLs) because perforin release is a common killing mechanism of NK cells and CTLs. We distinguished cell subsets by CD3, CD8, and CD56 expression in conjunction with staining for intracellular perforin (Table 1). Surface stains for CD3 and CD8 identified 4 populations that were evaluated for CD56 and perforin expression (Figure 1D). CD56 expression was subdivided into CD56+ (CD56bright and CD56dim) and CD56– (Figure 1D, left panel). Intracellular perforin levels were categorized into low, medium, and high fractions (Figure 1D, right panel). High levels of perforin were correlated with levels of CD56 expression more than with CD8 or CD3 expression (Figure 1D). CD3+CD8+ CTLs displayed low to medium levels of intracellular perforin as compared to CD3–CD8+ cells (Figure 1D).
We used soluble ICAM ligands to test LFA-1 functions in subsets capable of cytolytic activity. Because the majority of NK cells express CD16, the FcγRIII receptor that binds IgG and is responsible for antibody-induced cellular cytotoxicity (ADCC), we used human sera containing human IgG in our culture system to avoid ICAM-Fc nonspecific binding to CD16. We tested for ICAM binding in the presence of human IgG in both CD56+CD8+ NK cells and CD3+CD8+ T cells. All ICAMs bound CD56+CD8+ cells, with ICAM-1 binding being enhanced in IL-2–stimulated cells (Figure 1E, left panel). All ICAMs bound CD3+CD8+ cells at levels lower than those observed in the CD56+CD8+ cells (Figure 1E, right panel). Although different affinities have been reported for ICAM ligand binding to LFA-1 in in vitro studies,29 ICAM binding to surface-expressed LFA-1 was detectable in both the NK and CTL populations.
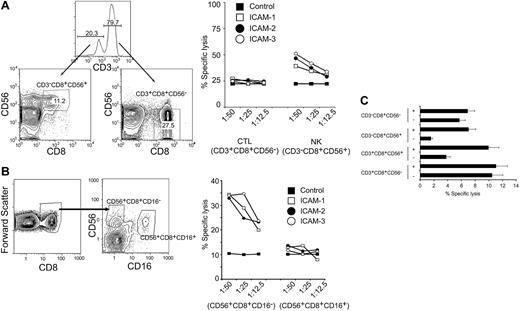
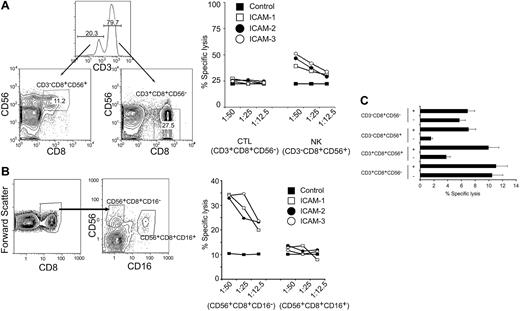
We have previously shown that LFA-1 can signal on ligand binding in T cells.30 We therefore profiled the level of the different ICAM ligands on the target cells (K562, Daudi, Jurkat, U937, HL60) to identify target cells that expressed low levels of ICAMs. We reasoned that if target cells expressed high levels of surface ICAMs they could signal through LFA-1 and make it difficult to observe LFA-1/ICAM ligand-specific effects as stimulated by exogenous addition of ICAM ligands. HL60 cells had lower levels of surface-expressed ICAMs than other cell types tested, thus these cells were used for further evaluation. Populations of cytolytic lymphocytes (CD3+CD8+CD56–), NK T cells (CD3+CD56+CD8+), and NK subsets (CD3–CD8+CD56+ and CD3–CD8+CD56–) were purified from human peripheral blood. We compared populations of CTLs (CD3+CD8+CD56–) and NK cells (CD3–CD8+CD56+), sorted by FACS, under a range of effector-target cell ratios. All cells were cultured in the presence of IL-2 for 12 hours. The cells were stimulated with ICAM-1, ICAM-2, or ICAM-3 ligands 30 minutes prior to mixing with CMFDA-labeled HL60 cells. The CTLs (CD3+CD8+CD56–) displayed cytolytic activity that was not enhanced by stimulation with the ICAM ligands (Figure 2A). However, the cytolytic activity of the NK cells (CD3–CD8+CD56+) was enhanced by ICAM stimulation (Figure 2A). These results suggest that whereas CTLs can be appropriately stimulated with IL-2 to kill target cells, the NK subpopulations can increase their cytolytic capacity on LFA-1 stimulation.
Purified NK cell populations are responsive to LFA-1–induced cytolytic activity. (A) CTLs (CD3+CD8+CD56–) or NK cells (CD3–CD8+CD56+), sorted by FACS, were cultured in IL-2 (200 ng/mL) for 12 hours and treated with either control IgG, ICAM-1, ICAM-2, or ICAM-3 (10 μg/mL) 30 minutes prior to mixing with target CMFDA-labeled HL60 at various effector-target (E/T) cell ratio (as indicated) for 4 hours. Specific cell lysis was quantitated by flow cytometry and displayed as percent specific lysis. Results are representative of 4 independent donors. Numbers indicate population frequencies. (B) CD56+CD8+CD16– and CD56+CD8+CD16+ cells, sorted by FACS, were cultured in IL-2 (200 ng/mL) for 12 hours and treated with either control IgG, ICAM-1, ICAM-2, or ICAM-3 (10 μg/mL) 30 minutes prior to mixing with target CMFDA-labeled HL60 at a particular E/T cell ratio (as indicated) for 4 hours. Specific cell lysis was quantitated by flow cytometry and displayed as percent specific lysis. (C) Cytotoxic T-cell lymphocytes (CTL: CD3+CD8+CD56–), natural killer T cells (NKT: CD3+CD8+CD56+), natural killer CD56+ cells (NK56+: CD3–CD8+CD56+), and natural killer CD56– cells (NK56–: CD3–CD8+CD56–) were sorted by FACS, cultured in IL-2 (200 ng/mL) for 12 hours, and treated with either control IgG or ICAM-2 (10 μg/mL) 30 minutes prior to mixing with target CMFDA-labeled HL60 at a 1:6.25 E/T cell ratio for 4 hours. Specific cell lysis was quantitated by flow cytometry and computed. Error bars are the standard deviation of 3 experiments.
Purified NK cell populations are responsive to LFA-1–induced cytolytic activity. (A) CTLs (CD3+CD8+CD56–) or NK cells (CD3–CD8+CD56+), sorted by FACS, were cultured in IL-2 (200 ng/mL) for 12 hours and treated with either control IgG, ICAM-1, ICAM-2, or ICAM-3 (10 μg/mL) 30 minutes prior to mixing with target CMFDA-labeled HL60 at various effector-target (E/T) cell ratio (as indicated) for 4 hours. Specific cell lysis was quantitated by flow cytometry and displayed as percent specific lysis. Results are representative of 4 independent donors. Numbers indicate population frequencies. (B) CD56+CD8+CD16– and CD56+CD8+CD16+ cells, sorted by FACS, were cultured in IL-2 (200 ng/mL) for 12 hours and treated with either control IgG, ICAM-1, ICAM-2, or ICAM-3 (10 μg/mL) 30 minutes prior to mixing with target CMFDA-labeled HL60 at a particular E/T cell ratio (as indicated) for 4 hours. Specific cell lysis was quantitated by flow cytometry and displayed as percent specific lysis. (C) Cytotoxic T-cell lymphocytes (CTL: CD3+CD8+CD56–), natural killer T cells (NKT: CD3+CD8+CD56+), natural killer CD56+ cells (NK56+: CD3–CD8+CD56+), and natural killer CD56– cells (NK56–: CD3–CD8+CD56–) were sorted by FACS, cultured in IL-2 (200 ng/mL) for 12 hours, and treated with either control IgG or ICAM-2 (10 μg/mL) 30 minutes prior to mixing with target CMFDA-labeled HL60 at a 1:6.25 E/T cell ratio for 4 hours. Specific cell lysis was quantitated by flow cytometry and computed. Error bars are the standard deviation of 3 experiments.
To investigate the role of the human IgG Fc portion in the functional activity of the ICAM fusion proteins, we sorted CD56+CD8+ populations based on FcγRIII (CD16) expression and performed effector-target killing assays. CD16 can trigger cytolytic mechanisms in NK cells and is primarily involved in ADCC. CD56+CD8+ cells were sorted into CD16+ and CD16– populations (Figure 2B), incubated for 12 hours in the presence of IL-2, and used in effector-target killing assays at various ratios. Sorted populations were stimulated with ICAM ligands and specific cell lysis of target cells was measured by flow cytometry. The CD56+CD8+CD16– cells displayed greater cytolytic activity in the presence of the ICAM fusion proteins than did the CD56+CD8+CD16+ cells (Figure 2B). These results suggest that CD16 triggering by either the human IgG in the media or by the Fc portion of the ICAM fusion proteins is not responsible for the observed enhanced cytolytic activity in the CD56+CD8+ NK population.
Populations of CD3+CD8+CD56– (CTL), CD3+CD8+CD56+ (NKT), CD3–CD8+CD56+ (NK56+), and CD3–CD8+CD56– (NK56–) cells were sorted by FACS to more than 95% purity. The cytolytic activities of the CTL and NK56– populations were not enhanced by ICAM-2 stimulation (Figure 2C). The cytotoxic activity of the NKT population was enhanced roughly 2-fold by ICAM-2 (Figure 2C). Treatment with ICAM-2 enhanced the cytotoxic activity of the NK56+ population by roughly 4-fold (Figure 2C). In our assays, we did not observe enhancement of purified CTL-directed killing by ICAM stimulation, although CTLs displayed proficient killing with IL-2 stimulation alone (Figure 2C). These data show that the cytotoxic activity of CD56+CD8+ NK cells could be enhanced on LFA-1 stimulation.
ICAM-2/LFA-1 ligation promotes perforin release in CD56+CD8+ NK cells
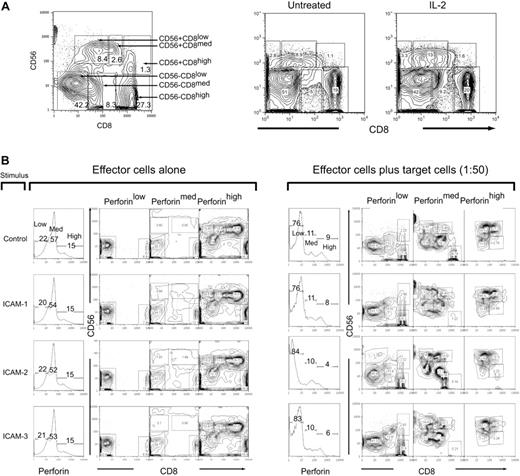
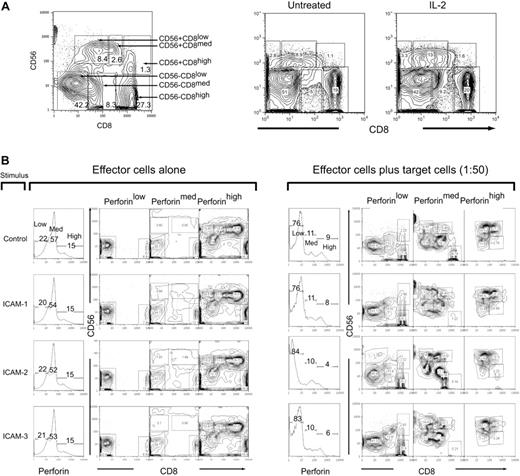
We used multiparameter flow cytometry to monitor the perforin changes in NK populations after effector-target cell mixing to identify the subset that exhibited the greatest loss of perforin. We identified 6 distinct populations that were categorized as either CD56+ or CD56– and then subcategorized into CD8 low, medium, and high to give the following subpopulations: CD56+CD8low, CD56+CD8med, CD56+CD8high, CD56–CD8low, CD56–CD8med, CD56–CD8high (Figure 3A, left panel). The population subset frequencies did not change significantly when treated with IL-2 (Figure 3A, right panel; Table 2).
CD56 and CD8 population subsets in human peripheral blood. (A) Six subsets were identified in human T cells by staining with CD56 and CD8. Gating and subsequent identification are indicated in the figure for population frequencies after IL-2 treatment. (B) IL-2–activated PBMCs (200 ng/mL, 12 hours) were mock-treated (IgG) or treated with ICAM-1, ICAM-2, or ICAM-3 (10 μg/mL FC fusion protein) 30 minutes prior to incubation with target HL60 cells at a 1:50 E/T ratio for 4 hours. Cells were then prepared for flow cytometry with CD8-Cy5PE, CD56-PE surface stains and perforin-Cy5 intracellular stains. Cells were gated in perforin content low, medium, and high, and then subsequently analyzed for CD56 and CD8 expression. Panel on the left is in the absence of target cells and panels on the right are in the presence of target cells. Numbers in panels correspond to population frequencies in those gates.
CD56 and CD8 population subsets in human peripheral blood. (A) Six subsets were identified in human T cells by staining with CD56 and CD8. Gating and subsequent identification are indicated in the figure for population frequencies after IL-2 treatment. (B) IL-2–activated PBMCs (200 ng/mL, 12 hours) were mock-treated (IgG) or treated with ICAM-1, ICAM-2, or ICAM-3 (10 μg/mL FC fusion protein) 30 minutes prior to incubation with target HL60 cells at a 1:50 E/T ratio for 4 hours. Cells were then prepared for flow cytometry with CD8-Cy5PE, CD56-PE surface stains and perforin-Cy5 intracellular stains. Cells were gated in perforin content low, medium, and high, and then subsequently analyzed for CD56 and CD8 expression. Panel on the left is in the absence of target cells and panels on the right are in the presence of target cells. Numbers in panels correspond to population frequencies in those gates.
In the absence of target cells, stimulations with the ICAM ligands did not change the distribution of perforin content (Figure 2B, left panel). The CD56+ populations were found primarily in the perforin high subgate (Figure 3B). CD56–CD8– cells were also present in the cells with high perforin content as were CD56–D8+ cells (Figure 3B, left panel). The subsets containing medium and low perforin content were CD56– that were subdivided into either CD8+ or CD8– (Figure 3B, left panel). On mixing with target HL60 cells, there was a distributional change of perforin levels (Figure 3B). ICAM-2 stimulation promoted the greatest loss of high perforin content (Figure 3B, right panel). Both ICAM-2 and ICAM-3 accumulated slightly higher perforin low–containing subsets than control and ICAM-1–stimulated cells (Figure 3B, right panel). In all stimulated cells, there was a redistribution of the CD56+ cells into the perforin-medium region, as well as the accumulation of CD56– cells in the perforin-low region (Figure 3B, right panel). These results suggest that although all LFA-1 ligands promoted perforin loss, there was a specific loss of cells containing perforin-high content by ICAM-2.
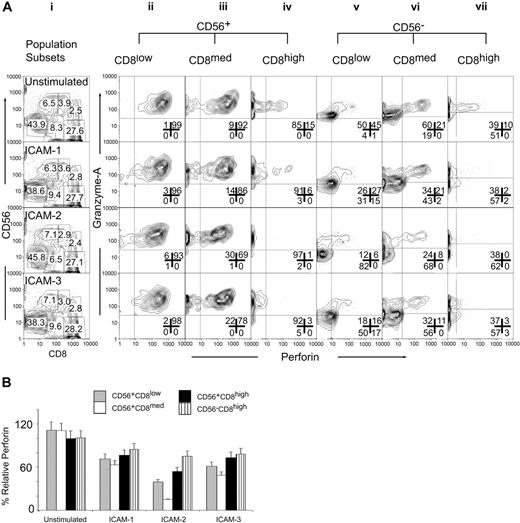
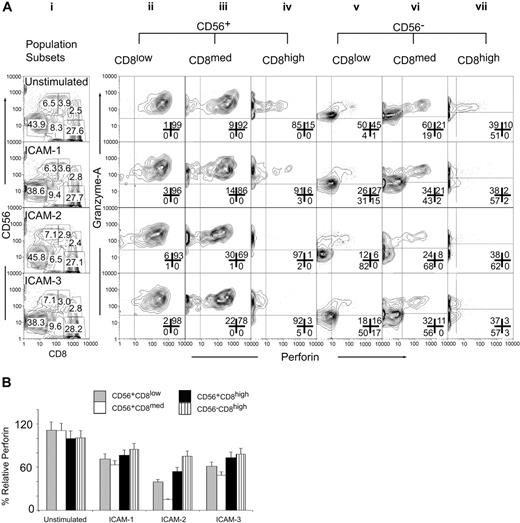
We quantified the levels of intracellular perforin and granzyme A in the CD56CD8 subsets responsive to ICAM stimulation. Cytotoxicity assays were performed in the presence of ICAM-1, ICAM-2, or ICAM-3 soluble ligand using HL60 target cells. By forward gating (Figure 4Ai) we separated the 6 CD56CD8 populations and then analyzed for the intracellular content of perforin and granzyme A. The CD56+CD8low population displayed no significant changes in intracellular perforin or granzyme A levels on stimulation with ICAM-1, ICAM-2, or ICAM-3 (Figure 4Aii). The CD56+CD8med population displayed a slight increase in the perforin-negative population after treatment with ICAM-2 or ICAM-3 (Figure 4Aiii). Stimulation of the CD56+CD8high (Figure 4Aiv) and the CD56–CD8high (Figure 4Avii) populations with ICAM-1, ICAM-2, or ICAM-3 caused a decrease in granzyme A and in perforin levels. Perforin levels in the CD56+CD8low subset were most sensitive to ICAM-2 stimulation (Figure 4Av). This was also reflected by the accumulation of granzyme A staining. The CD56+CD8med subset also displayed the greatest loss of perforin and granzyme A on ICAM-2 stimulation as compared to the other ICAM ligands (Figure 4Avi).
ICAM-2 exhibits differences from ICAM-1 and ICAM-3 in mediating perforin and granzyme release from CD56+CD8+ CTL subsets. (A) IL-2–activated PBMCs (200 ng/mL, 12 hours) were mock-treated (IgG) or treated with ICAM-1, ICAM-2, or ICAM-3 (10 μg/mL Fc fusion protein) 30 minutes prior to incubation with target HL60 cells at a 1:50 E/T ratio for 4 hours. Cells were then prepared for flow cytometry with CD8-Cy5PE, CD56-PE surface stains, and perforin-Cy5 and granzyme A–FITC intracellular stains. Cells were gated for CD56+CD8low, CD56+CD8med, CD56+CD8high, CD56–CD8–, CD56–CD8high populations as shown in panel i and population frequencies within appropriate gate. Panels ii-vii are subset-gated populations displayed for perforin and granzyme A log fluorescent intensities. Results are representative of 3 independent experiments and were similar at 1:25 and 1:12.5 E/T ratios (data not shown). Numbers in each panel correspond to population frequencies. (B) Relative perforin changes in CD56CD8 subsets after target cell mixing. Median fluorescence values were computed for CD56CD8 subsets and made relative to median fluorescence values. Error bars show standard deviations of 3 experiments.
ICAM-2 exhibits differences from ICAM-1 and ICAM-3 in mediating perforin and granzyme release from CD56+CD8+ CTL subsets. (A) IL-2–activated PBMCs (200 ng/mL, 12 hours) were mock-treated (IgG) or treated with ICAM-1, ICAM-2, or ICAM-3 (10 μg/mL Fc fusion protein) 30 minutes prior to incubation with target HL60 cells at a 1:50 E/T ratio for 4 hours. Cells were then prepared for flow cytometry with CD8-Cy5PE, CD56-PE surface stains, and perforin-Cy5 and granzyme A–FITC intracellular stains. Cells were gated for CD56+CD8low, CD56+CD8med, CD56+CD8high, CD56–CD8–, CD56–CD8high populations as shown in panel i and population frequencies within appropriate gate. Panels ii-vii are subset-gated populations displayed for perforin and granzyme A log fluorescent intensities. Results are representative of 3 independent experiments and were similar at 1:25 and 1:12.5 E/T ratios (data not shown). Numbers in each panel correspond to population frequencies. (B) Relative perforin changes in CD56CD8 subsets after target cell mixing. Median fluorescence values were computed for CD56CD8 subsets and made relative to median fluorescence values. Error bars show standard deviations of 3 experiments.
Quantifying the relative distributions of perforin levels in the CD56CD8 subsets supported the selective loss of perforin in the CD56+CD8med population by ICAM-2 (Figure 4B). ICAMs induced perforin release in the CD56–CD8high and CD56+CD8high populations. ICAM-2 and ICAM-3, but not ICAM-1, mediated perforin/granzyme A release in the CD56+CD8high, CD56+CD8med, and CD56–CD8med populations. This effect was observed in the CD56+CD8low populations and to a lesser extent in the CD56–CD8med population (Supplementary Figure S1; please see the “Data Set” link at the top of the online article on the Blood website). These results demonstrated that multivariate analysis could detect rare population shifts that occur on stimulus that in turn was correlated with an observable physiologic outcome. In this case, ICAM-2 stimulus induced perforin/granzyme A release, which was correlated with target cell lysis.
We assessed whether cross-linking of bound ICAM-1, ICAM-2, and ICAM-3 ligands to LFA-1 on the cell surface influenced perforin release in the absence of a target cell. In whole peripheral blood mononuclear cells (PBMCs), cross-linking the surface-bound ICAM-2 mediated a greater loss in perforin-containing subsets in the absence of a target cell than cross-linking of surface-bound ICAM-1 or ICAM-3 (Figure 5A). We observed that cross-linked surface-bound ICAM-2 alone induced perforin release only in the presence of IL-2 preactivated cells, whereas ICAM-2–coated beads did so in the absence or presence of IL-2 (Figure 5B) at far lower concentrations of total protein (2 μg ICAM-2 beads versus 10 μg for soluble ICAM-2). These results suggested that a multivalent presentation of ICAM-2 could facilitate LFA-1–induced degranulating mechanisms.
LFA-1–dependent perforin release in human CD56+CD8+ cells. (A) Detection of intracellular perforin after ICAM ligand cross-linking on total PBMCs. Human PBMCs, preactivated with IL-2 (200 ng/mL, 12 hours) were treated with ICAM-1, ICAM-2, or ICAM-3 Fc proteins (10 μg/mL, 30 minutes), then samples were cross-linked with antihuman IgG antibodies for 4 hours. Cells were stained for intracellular perforin (perforin-Cy5 conjugate) by flow cytometry. Relative population frequency is denoted by drawn gate and values are on the right of each stimulation. Results are representative of triplicate experiments. (B) Perforin release of CD56+CD8+ cells. Human PBMCs were treated with ICAM-2 (10 μg/mL) or ICAM-2 Fc–coated beads (4 × 10⁵ beads containing 2 μg ICAM-2) in the presence of IL-2 for 12 hours and then incubated with CMFDA-labeled target HL60 cells at a 1:50 E/T ratio for 4 hours. Intracellular perforin was assessed in the CD56+CD8+ population and quantified for release as discussed in “Materials and methods.” (C) Cytolytic activity was measured in the presence of LFA-1 blocking antibody TS1/22. Blocking mAbs were incubated at 20 μg/mL, 30 minutes prior to ICAM-2 Fc treatment (10 μg/mL, 30 minutes) and subsequent antihuman IgG (5 μg/mL) application and then incubated with CMFDA-labeled target HL60 cells at a 1:50 E/T ratio for 4 hours. (D) Intracellular perforin release was quantified in the presence of LFA-1 blocking antibodies. Blocking mAbs were incubated at 20 μg/mL, 30 minutes prior to ICAM-2 Fc treatment (10 μg/mL, 30 minutes) and subsequent antihuman IgG (5 μg/mL) application. Perforin release was quantified as described for the CD56+CD8+ human population subset. Error bars show standard deviation of 3 experiments.
LFA-1–dependent perforin release in human CD56+CD8+ cells. (A) Detection of intracellular perforin after ICAM ligand cross-linking on total PBMCs. Human PBMCs, preactivated with IL-2 (200 ng/mL, 12 hours) were treated with ICAM-1, ICAM-2, or ICAM-3 Fc proteins (10 μg/mL, 30 minutes), then samples were cross-linked with antihuman IgG antibodies for 4 hours. Cells were stained for intracellular perforin (perforin-Cy5 conjugate) by flow cytometry. Relative population frequency is denoted by drawn gate and values are on the right of each stimulation. Results are representative of triplicate experiments. (B) Perforin release of CD56+CD8+ cells. Human PBMCs were treated with ICAM-2 (10 μg/mL) or ICAM-2 Fc–coated beads (4 × 10⁵ beads containing 2 μg ICAM-2) in the presence of IL-2 for 12 hours and then incubated with CMFDA-labeled target HL60 cells at a 1:50 E/T ratio for 4 hours. Intracellular perforin was assessed in the CD56+CD8+ population and quantified for release as discussed in “Materials and methods.” (C) Cytolytic activity was measured in the presence of LFA-1 blocking antibody TS1/22. Blocking mAbs were incubated at 20 μg/mL, 30 minutes prior to ICAM-2 Fc treatment (10 μg/mL, 30 minutes) and subsequent antihuman IgG (5 μg/mL) application and then incubated with CMFDA-labeled target HL60 cells at a 1:50 E/T ratio for 4 hours. (D) Intracellular perforin release was quantified in the presence of LFA-1 blocking antibodies. Blocking mAbs were incubated at 20 μg/mL, 30 minutes prior to ICAM-2 Fc treatment (10 μg/mL, 30 minutes) and subsequent antihuman IgG (5 μg/mL) application. Perforin release was quantified as described for the CD56+CD8+ human population subset. Error bars show standard deviation of 3 experiments.
We investigated if LFA-1–blocking antibodies could diminish the perforin release in the CD56+CD8+ cells. LFA-1 blocking antibody clone (TS1/22) inhibited ICAM-2–induced cytolytic activity (Figure 5C). Although there was a slight increase in specific lysis in the presence of TS1/22 alone, it was several fold lower than the specific lysis induced by ICAM-2 stimulation (Figure 5C). Incubation of cells with TS1/22 prior to ICAM-2 stimulation also prevented perforin loss in the CD56+CD8+ cells (Figure 5D). These observations indicate that ICAM-2 can promote perforin release in the human CD56+CD8+ cell populations through an interaction with LFA-1. Thus the ICAM-2/LFA-1 interaction is an important signal initiated at a cytotoxic cell–target cell interface.
LFA-1 signals to Vav1 and p44/42 in CD56+ NK cells
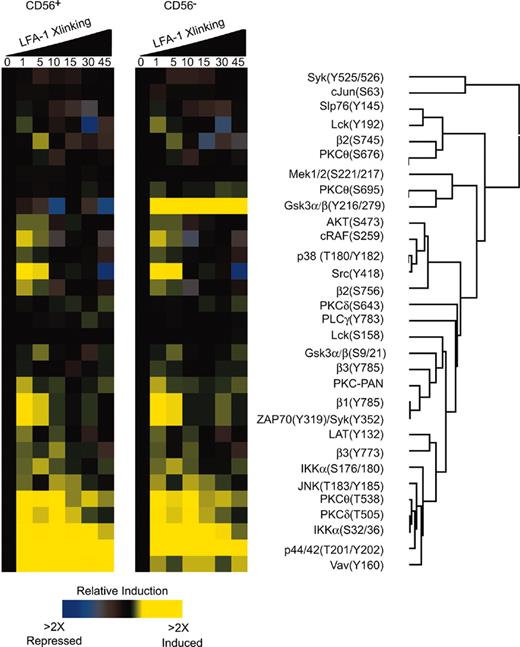
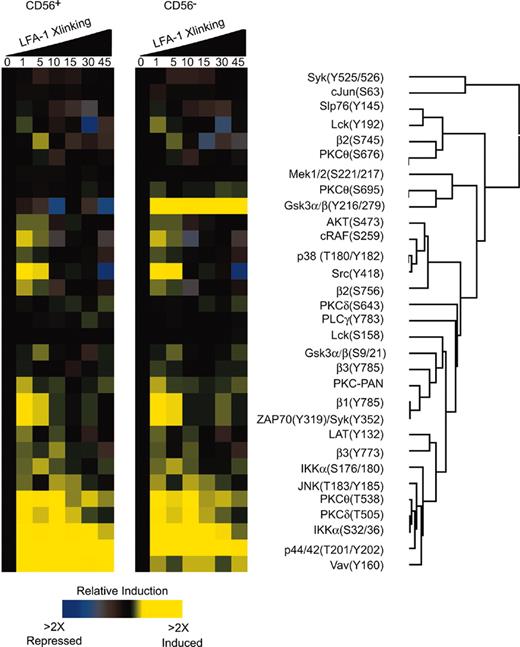
We investigated the signaling mechanisms that result from LFA-1 on CD56+ NK cells by intracellular phosphoprotein epitope profiling.27-29 The ratio of the signal in stimulated to unstimulated cells was used to generate a phospho-signature profile that was analyzed by clustering analysis (Figure 6A). The phospho-signatures were assessed as a function of time for LFA-1 stimulus in CD56+ NK cells and CD56– cells. Low level phosphorylation events were detected in both subsets including integrins β1, β2, β3, Syk, JNK, PKC isozymes, Lat, and Lck. The most prominent signatures for both subsets were for Vav1, Slp76, p44/42, and Ikkα (Figure 6). At 1 minute, phosphorylation of β1, β2, β3, Syk, PKCθ, Slp76, Mek, p44/42, Gsk3α/β, Ikkα, PKC-PAN, Lat, and Lck could be observed (Figure 6). Clustering analysis indicated that the phosphorylation events of p44/42, Vav1, Ikkα, β2 integrin, PKCθ, and PKCδ were correlated (Figure 6). At 5 minutes phosphorylation of Gsk3α/β, Ikkα, and β2 integrin were detected (Figure 6) in the CD56– population. We have previously reported that in naive T cells, LFA-1 can signal through PKCδ, cytohesin-1, and p44/42.27 Our current results confirm that phosphorylation of Vav1 and Ikkα occurs on LFA-1 stimulation in human NK cells. These phosphorylation events were more strongly observed in the CD56+ than the CD56– population on LFA-1 stimulation; however, both subsets signaled through these proteins (Figure 6). Recently, a role for Vav1 in NK cell cytotoxicity has been reported31-33 that β2 integrin engagement indeed induces Vav1 phosphorylation.32
Phospho-epitope profiling in human CD56+ NK cells. (A) Kinetic analysis of phosphoprotein after stimulation with anti–LFA-1 cross-linking in human CD56+ NK cells. Peripheral blood was cross-linked for LFA-1 antibody (mAb clone 27) and stained in 4-color combinations of CD56-PE-Cy5 and 3 phosphospecific antibodies coupled to Alexa 488, Alexa 568, Alexa 647, Alexa 660, or PE. Ratios of the fluorescent intensities (geometric mean) were calculated relative to unstimulated cells. All values were derived from CD56+ and CD56– gated populations and computed using Cluster and Treeview software programs.
Phospho-epitope profiling in human CD56+ NK cells. (A) Kinetic analysis of phosphoprotein after stimulation with anti–LFA-1 cross-linking in human CD56+ NK cells. Peripheral blood was cross-linked for LFA-1 antibody (mAb clone 27) and stained in 4-color combinations of CD56-PE-Cy5 and 3 phosphospecific antibodies coupled to Alexa 488, Alexa 568, Alexa 647, Alexa 660, or PE. Ratios of the fluorescent intensities (geometric mean) were calculated relative to unstimulated cells. All values were derived from CD56+ and CD56– gated populations and computed using Cluster and Treeview software programs.
We did, however, detect differences in LFA-1 stimulation of CD56+ and CD56– cells. The most apparent difference was in the phosphorylation of Gsk3α/β. CD56+ cells displayed a decrease in the phosphorylation levels of Gsk3α/β(Y216/279) compared to CD56– cells that displayed an increase in Gsk3α/β phosphorylation at Y216/279 (Figure 6). The phosphorylation of Gsk3α/β on S9/21 by AKT inactivates Gsk3α/β,34 an event that was depicted in the phospho-profile for both CD56+ and CD56– populations where phosphorylation of AKT(S473) at 1 minute preceded phosphorylation of Gsk3α/β (S9/21) at 5 minutes (Figure 6). The activation of Gsk3α/β has been shown to be dependent on the phosphorylation at Y216/279.35 We did not investigate the role of Gsk3α/β phosphorylation at Y216/279 in CD56– cells because we observed greater LFA-1–mediated cytolytic activity in the CD56+ populations. We focused on the activation mechanisms of the CD56+ population.
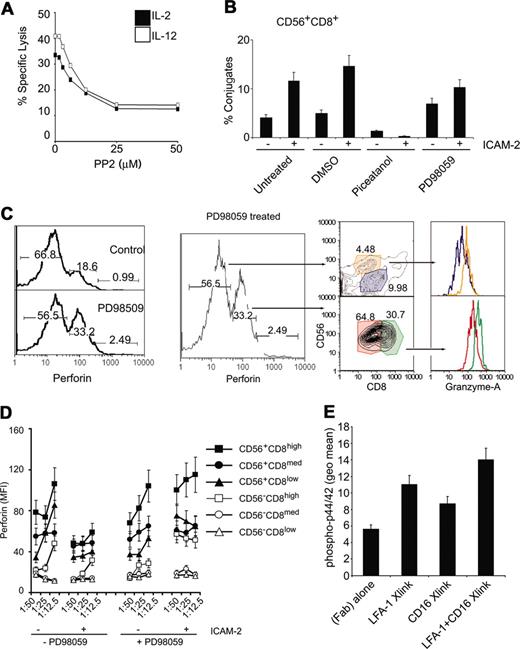
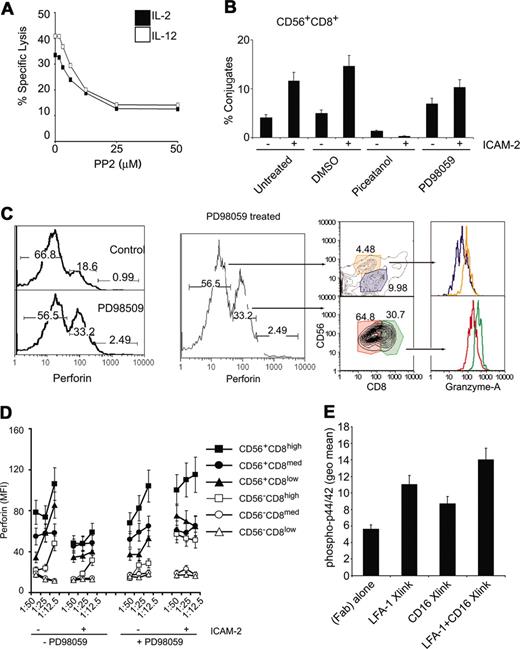
NK cell cytotoxicity is regulated by 2 nonexclusive pathways involving Src, PI3k, and Syk/Zap70.12 The β integrins can phosphorylate Vav1 in an Syk-dependent manner.36 Because src phosphorylation was observed (Figure 6) and is an upstream kinase that can phosphorylate Syk,37 we tested if src inhibition would affect cytolytic activity. Inhibition of src decreased cytolytic activity in a dose-dependent manner (Figure 7A). Interestingly, both src and phosphatidylinositol-3 kinase (PI3K) can lead to p44/42 activation that is known to regulate NK cell cytotoxicity.36,38 We investigated whether either of the known pathways were responsible for LFA-1 adhesion to target cells or for perforin release.
p44/42 MAPK and Syk activities map to distinct junctures in the LFA-1–dependent adhesion of CD56+CD8+ NK cells. (A) Src inhibition decreases lysis of target cells. CMFDA-labeled K562 cells were incubated at 1:25 E/T ratio of targets that had been treated with either IL-2 of IL-12 (100 ng/mL, 12 hours) in the presence of increasing concentrations of the src inhibitor PP2. Specific lysis is plotted. (B) Conjugate formation of CMFDA-labeled HL60 cells and CD56+CD8+ cells. Conjugate flow cytometric assay was performed on PBMCs treated with indicated chemicals (10 μM, 30 minutes) prior to treatment with ICAM-2 (10 μg/mL, 30 minutes). CMFDA-labeled HL60 cells were incubated at 1:25 E/T ratio for 5 minutes and fixed with 2% paraformaldehyde directly. Cells were then immunolabeled with CD8 and CD56 antibodies and gated for CD8+CD56+ cell populations, and percent HL60 fluorescence was calculated relative to total HL60 cells. (C) Intracellular perforin levels (perforin-PE conjugate) after E/T cell mixing in the presence or absence of 10 μM PD98059 (preincubated for 30 minutes before cell mixing). Low and medium perforin-containing subsets are gated and displayed for CD56 and CD8 markers as denoted by arrows. Perforin medium subsets (CD56+CD8med, CD56+CD8high) were further gated and displayed for granzyme A levels, as denoted by color-coded gates. Similar analysis was performed for perforin low subsets. Numbers at the top of each gate represent the population frequency in each section. (D) Perforin content in CD56CD8 subsets following E/T cell mixing of target HL60 cells in the presence of 20 μM PD98059. Some cells were stimulated with ICAM-2 (10 μg/mL) prior to incubation with target cells. Median fluorescent values are displayed for CD56CD8 subsets at various E/T ratios. (E) Phospho-p44/42 detection after LFA-1 and CD16 cross-linking. PBMCs were incubated with 1 μg/1 × 106 cells of β2 integrin mAb (clone CTB104) and CD16 (clone 3G8), followed by goat antimouse IgG (Fab′)2. Cells were stimulated at 37° C for 15 minutes before being processed for intracellular flow cytometry. Error bars in panels B, C, and D show standard deviation of 3 experiments.
p44/42 MAPK and Syk activities map to distinct junctures in the LFA-1–dependent adhesion of CD56+CD8+ NK cells. (A) Src inhibition decreases lysis of target cells. CMFDA-labeled K562 cells were incubated at 1:25 E/T ratio of targets that had been treated with either IL-2 of IL-12 (100 ng/mL, 12 hours) in the presence of increasing concentrations of the src inhibitor PP2. Specific lysis is plotted. (B) Conjugate formation of CMFDA-labeled HL60 cells and CD56+CD8+ cells. Conjugate flow cytometric assay was performed on PBMCs treated with indicated chemicals (10 μM, 30 minutes) prior to treatment with ICAM-2 (10 μg/mL, 30 minutes). CMFDA-labeled HL60 cells were incubated at 1:25 E/T ratio for 5 minutes and fixed with 2% paraformaldehyde directly. Cells were then immunolabeled with CD8 and CD56 antibodies and gated for CD8+CD56+ cell populations, and percent HL60 fluorescence was calculated relative to total HL60 cells. (C) Intracellular perforin levels (perforin-PE conjugate) after E/T cell mixing in the presence or absence of 10 μM PD98059 (preincubated for 30 minutes before cell mixing). Low and medium perforin-containing subsets are gated and displayed for CD56 and CD8 markers as denoted by arrows. Perforin medium subsets (CD56+CD8med, CD56+CD8high) were further gated and displayed for granzyme A levels, as denoted by color-coded gates. Similar analysis was performed for perforin low subsets. Numbers at the top of each gate represent the population frequency in each section. (D) Perforin content in CD56CD8 subsets following E/T cell mixing of target HL60 cells in the presence of 20 μM PD98059. Some cells were stimulated with ICAM-2 (10 μg/mL) prior to incubation with target cells. Median fluorescent values are displayed for CD56CD8 subsets at various E/T ratios. (E) Phospho-p44/42 detection after LFA-1 and CD16 cross-linking. PBMCs were incubated with 1 μg/1 × 106 cells of β2 integrin mAb (clone CTB104) and CD16 (clone 3G8), followed by goat antimouse IgG (Fab′)2. Cells were stimulated at 37° C for 15 minutes before being processed for intracellular flow cytometry. Error bars in panels B, C, and D show standard deviation of 3 experiments.
We focused on the CD56+CD8+ cells because this population showed the greatest loss of perforin compared to other NK cell populations. We tested if inhibition of Syk and p44/42 MAPK affected effector-target cell conjugation as measured by a flow cytometric conjugate formation assay.20 To delineate cell subsets, we labeled PBMCs with fluorophore-conjugated antibodies at 4° C, then mixed them with CMFDA-labeled target cells, incubated at 37° C for 5 minutes, and then rapidly stopped the reaction with formaldehyde. Inhibition of Syk by piceatannol prevented conjugate formation, whereas inhibition of p44/42 MAPK by PD98059 allowed for conjugate formation (Figure 7B).
Inhibiting p44/42 MAPK attenuated release of perforin on effector-target cell mixing as compared to noninhibited reactions (Figure 7C, left panel). On treatment with PD98059, the drop in frequency of perforin-expressing cells in low, medium, and high subsets indicated that inhibition of the p44/42 MAPK cascade blocked perforin release. We gated on the PD98059-induced, perforin-retained populations to identify the subsets. The perforin-medium population contained mainly CD56+CD8med/high populations (Figure 7C). Further gating on these perforin-inhibited subsets for intracellular granzyme A also indicated that they contained higher levels of granzyme A than other subsets (Figure 7C). Perforin release was also inhibited by PD98059 treatment in all CD56+ subsets (Figure 7D, right panel). These results suggest that Syk activity is necessary for LFA-1 adhesion of effector-target cells and is consistent with a report indicating that Syk/Zap-70 is necessary for LFA-1 to LFA-1 activation on the same cell.39 p44/42 MAPK was not necessary for E/T conjugate formation, but was necessary for perforin release. Thus, the LFA-1 signals activate at least 2 different signaling pathways in NK cells: (1) the activation of Syk was necessary for the initial adhesion between the NK cell and target cell, and (2) the p44/42 MAPK activity was involved in perforin release.
Although it was observed that LFA-1/ICAM interactions could enhance cytolytic activity in CD56+CD8+ cell subsets that were CD16–, we investigated if LFA-1 signaling could enhance CD16 signaling. We reasoned that because CD16 has been reported to signal to p44/42 MAPK40 and PD98059 treatment prevented perforin release in all NK cell subsets, it was possible the costimulation of CD16 and LFA-1 could promote enhanced signaling in NK cells that express both receptors. Cross-linking the β2 integrin induced p44/42 MAPK phosphorylation as did CD16 cross-linking with a specific mAb (3G8; Figure 7E). Cross-linking both LFA-1 and CD16 induced higher levels of phospho-p44/42 than LFA-1 or CD16 cross-linking alone (Figure 7E). These results suggest that LFA-1 and CD16 signaling mechanisms can integrate to promote NK cell–specific functions.
Discussion
In this report, we investigated the cytolytic activity of NK cell subsets and determined that ICAM-2 promoted perforin and granzyme A release in CD56+ and CD8+ cells. Furthermore, ICAM-2 specifically induced perforin release of NK cells that were CD3– and expressed high levels of CD56 and intermediate levels of CD8. It was observed that LFA-1 signaling through the Syk, Vav1, and the p44/42 MAPK pathways correlated with significant physiologic outcomes.
CD56 (neural cell adhesion marker [NCAM]) is an immunoglobulin superfamily member glycoprotein whose expression is restricted to NK cells and a subset of CD4 and CD8 T cells with unknown function. CD56bright NK cells express high levels of the high-affinity IL-2R,41 suggesting that these NK cells circulate in a functionally active state.42 High correlation between cytolytic effector function and CD56 expression has been reported.16 CD56 expression is stable during culture and, therefore, does not represent different stages of maturation.43 It has been reported that CD56dim NK cells are more cytotoxic than CD56bright NK cells44,45 ; however, after activation with IL-2, CD56bright and CD56dim cells have similar levels of cytotoxicity.46 We pretreated all cells with IL-2 to eliminate variability among the subsets. In addition, CD56bright NK cells produce greater levels of interferon γ (IFN-γ) and tumor necrosis factor α (TNF-α) on stimulation with phorbol myristate acetate (PMA)/ionomycin than CD56dim cells.43 Therefore, although the CD3–CD56+CD8+ subset represents a small percentage of total NK cells, it may represent a more functionally capable subset in vivo.
We observed that ICAM-2 was similar to ICAM-3 in mediation of cytolytic activity, as evidenced by release of perforin and granzyme A. Soluble ICAM-1 was much less efficient. CD56+CD8+ cells were more responsive to ICAM-2 than ICAM-1 or ICAM-3. These differences may be attributed to differences in ICAM fusion protein affinities for LFA-1 and do not exclude the possibility that surface-expressed ICAM ligands differ in structure from soluble forms and may interact with LFA-1 differently. Particularly in the presence of additional receptor stimulations, LFA-1 may preferentially bind ICAM-1 over ICAM-2 and ICAM-3. In sorted populations, the CD56+CD8+ cells that were CD16– demonstrated enhanced cytolytic activity on ICAM stimulation, although it is possible that LFA-1 and CD16 cooperate in cytolytic mechanisms because cross-linking both receptors enhanced signaling to p44/42, which is an event important for perforin release. The results also do not exclude the possibility that ICAM-2 stimulated unidentified cytotoxic-capable subsets because perforin losses were also observed in a population that was negative for CD56 and CD8 (Figure 4).
It was previously demonstrated that a clustered presentation of surface-expressed ICAM-2 increased cytolytic activity in bulk PBMCs.47 The work presented here supports the notion that a topographically appropriate display of clustered ICAM-2 can positively affect cytolytic activity. It can be argued that ICAM-2 stimulation simply promoted LFA-1 activation and this increase in the adhesive capability of the NK cells allowed the interaction of other surface markers to result in the pronounced perforin loss. Although increased LFA-1–dependent adhesion by ICAM-2 ligand and ICAM-2–derived peptides has been reported,28,48,49 it was possible to force perforin-granule exocytosis on mixing with ICAM-2–coated beads or surface-bound ICAM-2 ligand crosslinking, clearly demonstrating that LFA-1 is directly coupled to perforin degranulation. It is also possible that LFA-1 is only one of a number of surface molecule interactions that integrate at signaling junctures for perforin degranulation as evidenced by CD16 and LFA-1 signal integration of p44/42 activation. LFA-1 may also be functionally coupled to other such receptors.
Intracellular phospho-epitope profiling in NK cells identified the LFA-1–dependent phosphorylation of several target proteins. The most intense phosphorylations were detected for p44/42, Vav1, Ikkα, β2 integrin, PKCδ, and PKCθ (Figure 6). Pharmacologic inhibition studies have shown that the PKC isozymes and Vav1 are involved in NK cytolytic activity.50,51 Nuclear factor κB (NF-κB) activation, an event that follows IKKα phosphorylation, is dependent on PKCθ and Vav1 in T cells; however, it is not known whether these pathways are operative in NK cells. Inhibition or ablation of Syk, either by pharmacologic means (via inhibition by piceatannol), biochemical means (dominant-negative Syk), or genetic means (Syk–/– mice), inhibits natural cytotoxicity.52,53 Inhibition of src, a kinase upstream of Syk54 that is essential for adhesion-dependent phosphorylation of Syk,37 blocked NK cell activity and LFA-1–dependent adhesion (data not shown). Thus LFA-1 adhesion is directly linked to the activation of kinases that have been previously identified to be necessary for NK cell cytotoxicity.
It has also been reported that target ligation in NK cells activates a Ras-independent p44/42 MAPK pathway55 that was later defined to be a PI3K-regulated pathway (PI3K → Rac1 → PAK → MEK → Erk).38 Inhibition of p44/42 MAPK compromised perforin release. Here we demonstrated that LFA-1 activated the p44/42 MAPK pathway, connecting a cell-surface event with perforin granule exocytosis. Thus, the LFA-1 signaling pathway contains signaling junctures that map to both the effector-target cell adhesion event and activation of cytolytic machinery in the human CD56+CD8+ cytotoxic cell population. The detailed mechanisms that involve Vav1 activation remain to be identified but could possibly connect LFA-1 adhesion with LFA-1 signaling because Vav1-deficient thymocytes are defective in LFA-1 adhesion56 and Vav1 has been shown to be downstream of PI3K to integrate into the p44/42 pathway.57,58 These results provide direct evidence for a functional consequence of LFA-1 integrin adhesion with cytolytic signaling mechanisms.
We demonstrated that LFA-1 signaling functionally contributes to CD56+CD8+ cytolytic activity in addition to possessing an adhesive role. These events were necessary for effector-target cell binding of CD56+CD8+ cells, perforin-granzyme A–mediated release, and subsequent cytolytic activity. Further characterization of the regulation of the intracellular signaling mechanisms imparted by LFA-1 or other interacting receptors could lead to a better understanding of events that promulgate from the effector-target cell interface.
Prepublished online as Blood First Edition Paper, April 27, 2004; DOI 10.1182/blood-2003-08-2652.
Supported by National Heart, Lung and Blood Institute grant N01-HV-28183I and as a Bristol-Meyer Squibb Irvington Institute fellow (O.D.P.). G.P.N. was supported in this work as a Scholar of the Leukemia Society of America and was supported by National Institutes of Health grants P01-AI39646, AR44565, AI35304, N01-AR-6-2227, A1/GF41520-01, and the Juvenile Diabetes Foundation.
The online version of the article contains a data supplement.
The publication costs of this article were defrayed in part by page charge payment. Therefore, and solely to indicate this fact, this article is hereby marked “advertisement” in accordance with 18 U.S.C. section 1734.
We are grateful for reagents from BD Biosciences (PharMingen), Biosource International, Dynal, Molecular Probes, and the Herzenberg Laboratory and for the resources of the Stanford FACS facility. Special thanks to both Helen Blau and Irv Weissman for insightful comments. Thanks to Khoua Vang for administrative help and manuscript preparation.

