Abstract
Like their human counterparts, mouse plasmacytoid dendritic cells (pDCs) play a central role in innate immunity against viral infections, but their capacity to prime T cells in vivo remains unknown. We show here that virus-activated pDCs differentiate into antigen-presenting cells able to induce effector/memory CD8+ T-cell responses in vivo against both epitopic peptides and endogenous antigen, whereas pDCs activated by synthetic oligodeoxynucleotides containing unmethylated cytosine-guanine motifs (CpG) acquire only the ability to recall antigen-experienced T-cell responses. We also show that immature pDCs are unable to induce effector or regulatory CD8+ T-cell responses. Thus, murine pDCs take part in both innate and adaptive immune responses by directly priming naive CD8+ T cells during viral infection.
Introduction
Human plasmacytoid dendritic cells (pDCs) were originally characterized as an immature CD11c– dendritic cell (DC) subset with plasmacytoid morphology and the capacity to produce high levels of type I interferons (IFNs) upon viral stimulation.1,2 These IFN-producing cells are crucial in innate immunity, as they stimulate the antiviral activity of natural killer (NK) cells.3,4 Upon CD40L, viral, or bacterial stimulation, pDCs differentiate into functional antigen-presenting cells (APCs) that promote T-helper 1 (Th1)– or Th2-oriented CD4+ T-cell responses.2,5-7 More recently, CD40L-activated human pDCs were shown to induce CD8+ regulatory T cells,8 whereas influenza virus–stimulated pDCs prime virus-specific cytotoxic T cells (CTLs).9 Virus-activated pDCs also induce the differentiation of CD40-activated B cells into plasma cells that secrete virus-specific antibodies.10 Thus, human pDCs appear to be a highly flexible cell subset capable of adapting to various stimuli and playing central roles in both innate and adaptive immunity.
Recently, the murine equivalent of human pDCs has been identified according to morphologic and functional characteristics in several lymphoid organs.11-13 Murine pDCs display a CD11cloB220+ phenotype and immature features, expressing almost no costimulatory molecules and only low levels of major histocompatibility complex (MHC) class II molecules. Like their human counterparts, murine pDCs produce type I IFN11-13 and activate NK cell cytotoxicity upon viral stimulation.14 Immature and activated pDCs are poor stimulators of CD4+11-13,15 and CD8+16 T cells and have a tolerogenic effect on CD4+ populations.17 However, these results are controversial, as it was recently shown that synthetic oligodeoxynucleotides containing unmethylated cytosine-guanine motifs (CpG)–activated pDCs promote Th1 CD4+ T-cell responses16,18 and that mouse cytomegalovirus (CMV)–infected pDCs prime CD8+ T cells.14 All these results were obtained in vitro, and their physiologic relevance remains to be determined.19
In this study, we evaluated the capacity of pDCs to prime in vivo naive CD8+ T cells, following their in vivo activation by CpG through toll-like receptor 9 (TLR9) or by a TLR9-independent viral stimulus.20 We show that after activation by influenza virus, pDCs turned into efficient APCs that primed effector/memory CD8+ T-cell responses in vivo against epitopic peptides or endogenous antigen, whereas immature and CpG-activated pDCs failed to initiate such responses. Neither immature nor CpG-activated pDCs impaired further antigen-specific priming by conventional CD11chi DCs (cDCs), excluding the possibility that they have a regulatory role. In contrast, whereas immature pDCs remained unable to stimulate memory CD8+ T cells, CpG-activated pDCs recalled an antigen-specific response in vivo. This is the first demonstration that pDCs can prime CD8+ T-cell responses in vivo following viral stimulation and generate effector/memory responses. In conclusion, this DC subset plays a crucial role in adaptive antiviral immunity, as well as in innate immunity.
Materials and methods
Mice
Six-week-old female or male 129sv (H-2b) mice were purchased from Charles River (L'Arbesle, France) and used between 7 and 10 weeks of age. C57BL/6 mice transgenic (Tg) for the anti–male histocompatability-Y antigen (H-Y) T-cell receptor (TCR)21 were crossed into a recombination-activating gene 2 (RAG2)–deficient background.22 Both Tg and Ly5.1 C57BL/6 mice were obtained from Centre de Distribution, Typage et Archivage animal (Orléans, France). Rag–/–γc–/– H-2a mice23 were obtained from J. Di Santo (Institut Pasteur, Paris, France) and were bred at the animal facilities of the Pasteur Institute. All mice were maintained in specific pathogen-free conditions. All animal work was approved by institutional animal experimentation committees.
Culture medium
Complete medium (CM) consisted of RPMI-1640 containing l-alanyl-l-glutamine dipeptide supplemented with 10% fetal calf serum (FCS), 5 × 10⁻⁵ M β2-mercaptoethanol, and antibiotics (penicillin 100 U/mL streptomycin 100 μg/mL). Synthetic HL-1 medium was obtained from BioWhittaker (Walkersville, MD) and supplemented with l-glutamine, 5 × 10⁻⁵ M β2-mercaptoethanol, and antibiotics. Serum-free expansion medium (SFEM) StemSpan (StemCell Technologies, Meylan, France) containing antibiotics was used for recovery after DC sorting.
Peptides and cell lines
The synthetic peptides OVA257-264 (SIINFEKL), corresponding to H-2b–restricted CTL epitope encompassing residues 257 to 364 of ovalbumin;24 GP3333-41 (KAVYNFATC), corresponding H-2b–restricted CTL epitope residues 33 to 41 of glycoprotein of lymphocytic chroiomeningitis virus;25 and HY (KCSRNRQYL), corresponding to H-2b–restricted CTL epitope of HY,26 were all purchased from Neosystem (Strasbourg, France). B3Z, a CD8+ T-cell hybridoma specific for the Kb-restricted OVA257-264 epitope, was a generous gift from N. Shastri (University of California, Berkeley). It was maintained in CM containing 1 μg/mL G418 and 400 μg/mL hygromycin B. The EL-4 thymoma was obtained from the American Type Culture Collection (Manassas, VA).
DC activation
CpG oligonucleotide (ODN 1826; TCCATGACGTTCCTGACGTT, CpG) was synthesized by Genset (Paris, France). Influenza A/Puerto Rico/8/34 (PR8) was grown in 10-day-old embryonated hens' eggs, purified on a sodium tartrate gradient, and dialyzed against phosphate-buffered saline (PBS). Purified virus was inactivated by heating at 56° C for 60 minutes, and absence of residual infectivity was checked by plaque assay on Madin-Darby canine kidney (MDCK) cells. For in vivo DC activation, 100 μg CpG or 100 μL heat-inactivated influenza virus at 1000 hemagglutinating units (HAUs) were intravenously injected into 129sv mice. DCs were purified from injected mice 18 hours after CpG injection or 3 hours after virus injection. For in vitro activation, total DCs or DC subsets were incubated for 18 hours with 10 μg/mL of CpG or with 100 HAUs of heat-inactivated influenza virus.
Cell purification
DCs were isolated from spleens of untreated, CpG-injected, or virus-injected 129sv mice as previously described.27 Briefly, spleens were harvested and treated for 45 minutes with 400 U/mL collagenase D and 50 μg/mL DNase I (Boehringer Mannheim, Mannheim, Germany). Spleens were then dissociated and the single-cell suspensions were incubated with anti-CD11c–coated magnetic beads (N418 clone; Miltenyi Biotec, Bergisch-Gladbach, Germany) according to the manufacturer's recommendations in PBS containing 2.5 mM EDTA (ethylenediaminetetraacetic acid) and 0.5% of bovine serum albumin (BSA; Sigma-Aldrich, Saint Quentin Fallavier, France). Purified anti-CD16/32 monoclonal antibodies (mAbs) and labeled anti-CD11c and anti-B220 mAbs (2.4G2, HL-3, and RA3-6B2; BD Pharmingen, Le Pont de Claix, France) were also added. After the incubation, the cells were washed and CD11c+ cells were selected on an automated magnetic cell sorter (AutoMACS; Miltenyi Biotec) using the posselds program. At this step, the cell suspensions were composed of 80% to 95% of CD11c+ cells, including up to 30% of CD11cloB220+ cells. The cDCs and pDCs were further sorted on a FACStar cell sorter (BD Biosciences, San Diego, CA) on the basis of CD11c and B220 expression. Sorted DC subsets were always more than 98% pure.
Antigen presentation assays
The stimulation of B3Z T-cell hybridoma was monitored by measuring the amount of interleukin-2 (IL-2) released into the supernatants of 18-hour cultures in the presence of purified pDCs, cDCs, or CD11c– cells in 96-well culture plates. Various numbers of APCs loaded or not with 1 μg/mL of OVA257-264 peptide for 30 minutes were incubated with B3Z hybridoma (105 cells/well) in 0.2 mL of CM. After 18 hours, plates were centrifuged and culture supernatants were frozen for at least 2 hours at –80° C. Then, 104 cells/well of the IL-2–dependent CTL-L cell line were cultured with 100 μL of these supernatants. After 48 hours, [3H]-thymidine (1.85 MBq/mL [50 μCi/mL]; International Chemical and Nuclear, Orsay, France) was added to the wells. The cells were harvested 6 hours later with an automated cell harvester (Skatron, Lier, Norway). Incorporated thymidine was detected by scintillation counting. All experiments were carried out in duplicate.
The in vitro stimulation of HY cells (5 × 10³ T cells/well) was detected by monitoring their proliferation in the presence of serial dilutions of DCs from female mice previously incubated or not with 1 μg/mL HY peptide for 30 minutes. After 72 hours of culture, HY T-cell proliferation was detected by [3H]-thymidine incorporation as described in the previous paragraph.
Flow cytometry
Isolated cells were suspended in PBS supplemented with 1% BSA and 0.1% NaN3. In each experiment, cells were incubated with rat anti-CD16/32 mAbs (2.4G2) to block nonspecific binding and labeled for 30 minutes in the dark with the following mAbs: anti-CD11c (HL-3), anti-B220 (RA3-6B2), anti-CD40 (HM40-3), anti-CD86 (GL1), anti-Kb (AF6-88.5), anti-CD45.1 (A20), anti-CD45.2 (104), anti-CD8 (53-6.7), and anti-CD44 (IM7). Biotinylated mAbs were detected by streptavidin-conjugated peridinin chlorophyll A protein (PerCP). All mAbs were purchased from BD Pharmingen. Events were acquired on a FACSCan or FACSCalibur flow cytometer and analyzed using CellQuest Software (BD Biosciences).
Immunization of mice
Purified cDCs or pDCs were incubated with OVA257-264 or GP3333-41 peptide (1 μg/mL in SFEM StemSpan medium for 30 minutes) and extensively washed to eliminate free peptide. Naive 129sv mice received 2 × 10⁵ cDCs or pDCs by intravenous route.
T-cell isolation and adoptive transfer
HY Tg T cells were isolated from the lymph nodes (LNs) of female HY mice. After being harvested, the LN DCs were depleted by magnetic sorting using anti-CD11c magnetic beads and AutoMACS (Miltenyi Biotec). Before being transferred into host mice, HY T cells were labeled with 5 μM CFSE (5,6-carboxyfluorescein diacetate succinimidyl ester; Molecular Probes, Leiden, The Netherlands) for 15 minutes at room temperature in the dark. The cells were then washed with CM and counted. CFSE-labeled HY T cells (4 × 10⁵) and purified male 129sv DCs (2 × 10⁵) were intravenously cotransferred into Rag–/–γc–/– mice.
Hemisplenectomy
To follow the OVA- and GP33-specific T-cell responses induced in injected mice after one or 2 injections of DCs, immunized mice were surgically hemisplenectomized one week after the first DC transfer. More than 95% of the mice survived the intervention. These mice were injected a second time with 2 × 10⁵ purified DCs 3 to 6 weeks after the first DC transfer. When evaluating effector/memory T-cell responses induced by virus-activated pDCs, only mice that developed a primary response were tested.
In vitro cytotoxicity assay
Splenocytes were isolated from 129sv immunized mice 7 days after DC transfer and restimulated in vitro for 5 days with OVA257-264 (1 μg/mL) or GP3333-41 (0.1 μg/mL) peptide in the presence of syngeneic irradiated naive spleen cells. Splenocytes from Rag–/–γc–/– mice that had received HY Tg T cells were tested ex vivo for cytotoxic activity without any in vitro restimulation. The cytotoxic activity was determined during a 5-hour in vitro [51Cr]-release assay as previously described.28 Briefly, [51Cr]–EL-4 (H-2b) tumor cells loaded with 50 μMOVA257-264, GP3333-41, or HY peptide were used as target cells for H-2b effector cells. Various effector-to-target ratios were used and all assays were done in duplicate. The [51Cr] released in each well was counted by using a MicroBeta Trilux liquid scintillation Counter (Wallac, Turku, Finland). The percentage of specific lysis was calculated as 100 × (experimental release – spontaneous release)/(maximal release – spontaneous release). Maximum release was obtained by adding 10% Triton X-405 to target cells and spontaneous release was determined by incubating target cells in medium alone.
Cytokine ELISA assay
Splenocytes from immunized mice (106 cells/well for 129sv mice, 2 × 10⁵ cells/well for Rag–/–γc–/– mice) were restimulated in vitro in the presence or absence of 1 μg/mL of the corresponding peptide in CM (mice immunized once) or HL-1 (mice immunized twice) synthetic medium. The culture supernatants were harvested after 72 hours. IL-5, IL-10, and IFN-γ concentrations were then measured in these supernatants by a standard sandwich enzyme-linked immunosorbent assay (ELISA). IL-12p40 was detected in the supernatants of DCs that had been cultured for 18 hours in various conditions (see Figure 1 legend). Maxisorp plates (NUNC, Roskilde, Denmark) were coated with unconjugated anti–IL-5, anti–IL-10, anti–IFN-γ, or anti–IL-12p40 capture mAbs (TRFK5, JES5-2A5, R4-6A2, and C15.6; BD Pharmingen). Bound cytokines were detected by using corresponding biotinylated mAbs (TRFK4, SXC-1, XMG1.2, and C17.8; BD Pharmingen). The plates were developed using streptavidin–horseradish peroxidase (streptavidin-HRP; BD Pharmingen) and o-phenylenediamine (Sigma-Aldrich) as a substrate. All measurements were performed in duplicate. The assays were standardized with recombinant murine cytokines (BD Pharmingen) and results are expressed in pg/mL or ng/mL. For IFN-γ, the results shown are obtained by subtracting nonspecific cytokine secretion in the absence of the priming peptide from specific secretion in the presence of this peptide. IFN-α was detected in DC culture supernatants by mouse IFN-alpha ELISA Kit (R&D Systems, Lille, France) following the manufacturer's instructions.
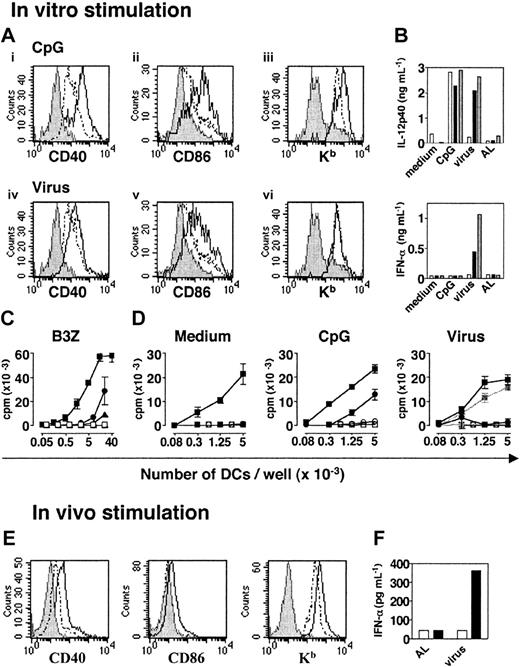
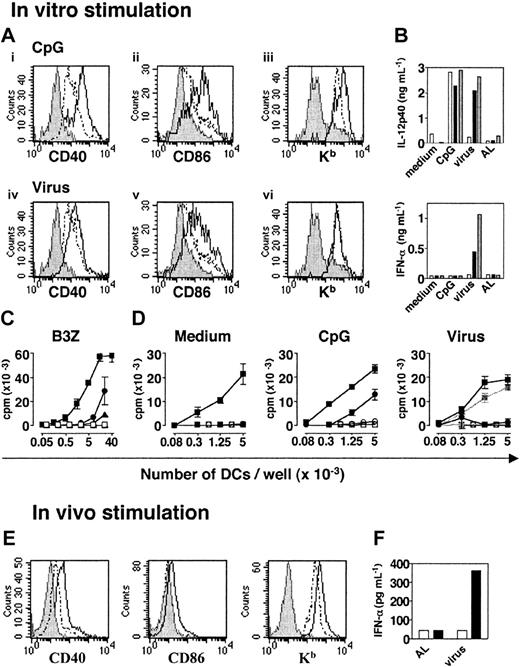
Phenotypic and functional characterization of pDCs before and after activation with CpG or heat-inactivated influenza virus. (A) Expression of CD40, CD86, and Kb molecules on CD11cloB220+ spleen cells after in vitro activation. CD11c+/lo were isolated from naive 129sv mice and cultured in CM alone or with CpG (top) or heat-inactivated influenza virus (bottom). Histograms compare the expression of each marker by live gated CD11cloB220+ untreated (- -) or activated (—) cells. Labeling with isotype control mAbs is represented in gray. (B) IL-12p40 and IFN-α production by purified cDCs (□), pDCs (▪), and total DCs (▦) isolated from the spleens of 129sv mice after in vitro activation. Sorted cDCs or pDCs (1.5 × 10⁵) or total DCs (105) were cultured in the following conditions: medium, CpG, inactivated influenza virus, or equivalent dilution of AL as a control. (C) Peptide presentation to B3Z T-cell hybridoma by pDCs (circles), cDCs (squares), or CD11c– spleen cells (triangles). OVA-specific B3Z hybridoma T cells were cocultured with graded numbers of purified pDCs, cDCs, or CD11c– spleen cells previously loaded (filled symbols) or unloaded (open symbols) with the OVA257-264 peptide. The amount of IL-2 secreted by B3Z was determined by a CTL-L assay. (D) Proliferative response of naive CD8+ T cells from LNs of HY transgenic mice to unstimulated (left), CpG-activated (middle), and virus-activated (right) pDCs (•) or cDCs (▪) loaded with the HY peptide. Unloaded pDCs (○) or cDCs (□) were used as a specificity control. The right panel also shows the proliferative response of HY T cells to DCs incubated with control AL (gray lines and symbols). (E) pDCs were purified from the spleens of untreated or CpG-injected 129sv mice and labeled. Plasmacytoid DCs were analyzed by gating on live CD11cloB220+ cells. Histograms compare the expression of each marker by untreated spleen pDCs (dashed line) or CpG-activated pDCs (solid line). Labeling with isotype control mAbs is represented in gray. (F) IFN-α production by spleen pDCs and cDCs purified from mice injected with heat-inactivated influenza virus or control AL. Purified pDCs (▪) and cDCs (□) were incubated for 18 hours in SFEM StemSpan medium and IFN-α secretion was assessed in culture supernatants by ELISA. All data are representative of 2 experiments. Error bars in panels C and D represent SDs from the means of duplicate experiments.
Phenotypic and functional characterization of pDCs before and after activation with CpG or heat-inactivated influenza virus. (A) Expression of CD40, CD86, and Kb molecules on CD11cloB220+ spleen cells after in vitro activation. CD11c+/lo were isolated from naive 129sv mice and cultured in CM alone or with CpG (top) or heat-inactivated influenza virus (bottom). Histograms compare the expression of each marker by live gated CD11cloB220+ untreated (- -) or activated (—) cells. Labeling with isotype control mAbs is represented in gray. (B) IL-12p40 and IFN-α production by purified cDCs (□), pDCs (▪), and total DCs (▦) isolated from the spleens of 129sv mice after in vitro activation. Sorted cDCs or pDCs (1.5 × 10⁵) or total DCs (105) were cultured in the following conditions: medium, CpG, inactivated influenza virus, or equivalent dilution of AL as a control. (C) Peptide presentation to B3Z T-cell hybridoma by pDCs (circles), cDCs (squares), or CD11c– spleen cells (triangles). OVA-specific B3Z hybridoma T cells were cocultured with graded numbers of purified pDCs, cDCs, or CD11c– spleen cells previously loaded (filled symbols) or unloaded (open symbols) with the OVA257-264 peptide. The amount of IL-2 secreted by B3Z was determined by a CTL-L assay. (D) Proliferative response of naive CD8+ T cells from LNs of HY transgenic mice to unstimulated (left), CpG-activated (middle), and virus-activated (right) pDCs (•) or cDCs (▪) loaded with the HY peptide. Unloaded pDCs (○) or cDCs (□) were used as a specificity control. The right panel also shows the proliferative response of HY T cells to DCs incubated with control AL (gray lines and symbols). (E) pDCs were purified from the spleens of untreated or CpG-injected 129sv mice and labeled. Plasmacytoid DCs were analyzed by gating on live CD11cloB220+ cells. Histograms compare the expression of each marker by untreated spleen pDCs (dashed line) or CpG-activated pDCs (solid line). Labeling with isotype control mAbs is represented in gray. (F) IFN-α production by spleen pDCs and cDCs purified from mice injected with heat-inactivated influenza virus or control AL. Purified pDCs (▪) and cDCs (□) were incubated for 18 hours in SFEM StemSpan medium and IFN-α secretion was assessed in culture supernatants by ELISA. All data are representative of 2 experiments. Error bars in panels C and D represent SDs from the means of duplicate experiments.
ELISPOT assay
Specific IFN-γ–producing cells in the spleens of immunized mice were counted by an enzyme-linked immunospot (ELISPOT) assay as previously described.29 Ninety-six–well Multiscreen-HA sterile plates (Millipore, Molsheim, France) were coated with purified anti–IFN-γ mAbs at 2 μg/mL. Plates were washed and blocked with CM or HL-1 medium for 1 hour before adding the cells. Various numbers of splenocytes from immunized and control mice were then added to irradiated syngeneic splenocytes (5 × 10⁵ per well) in the presence or absence of 1 μg/mL of the appropriate peptide in CM (mice immunized once) or HL-1 (mice immunized twice). The cells were cultured for 24 (HY T cells) or 48 hours (polyclonal T cells) at 37° C. They were then washed and the biotinylated mAbs were added at 2 μg/mL in a solution of PBS, 0.5% Tween, and 1% BSA. Two hours later, the plates were washed and streptavidin–alkaline phosphatase (AKP) was added to the wells in a solution of PBS, 0.5% Tween, and 1% FCS. Two hours later, the plates were washed and BCIP/NBT (5-bromo-4-chloro-3-indolyl phosphate/nitro blue tetrazolium substrate; Sigma-Aldrich, 100 μL) was added to each well. Ten to 15 minutes later, the revelation was stopped with water. The spots were counted using the automated Bioreader-3000 pro counter (Bioreader, Karben, Germany). For each mouse, the number of peptide-specific IFN-γ–producing cells was determined by calculating the difference between the number of spots generated in the absence and in the presence of the priming peptide. Results are expressed as spot-forming cells (sfc's) per number of splenocytes in the wells.
Statistical analysis
Statistical analyses were performed using the Prism software (GraphPad Software, San Diego, CA). We used the 2-tailed unpaired t test with the Welch correction to analyze the results presented in Figures 4 and 5 (★, P < .05; ★★, P < .01; ★★★, P < .001; and NS, P > .05).
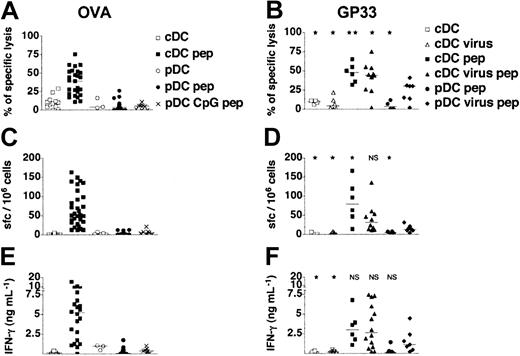
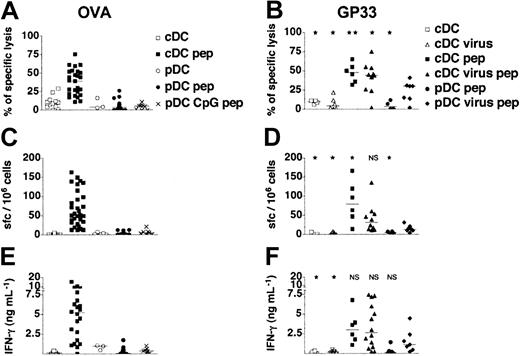
In vivo induction of CD8+T-cell responses by adoptive transfer of DC subsets. (A,C,E) Purified pDCs and cDCs isolated from untreated or CpG-injected 129sv mice were loaded or not with OVA257-264 peptide (pep) and transferred into syngeneic mice. (B,D,F) Purified pDCs and cDCs isolated from untreated or heat-inactivated influenza virus-injected 129sv mice were loaded or not with GP3333-41 peptide and transferred into 129sv syngeneic mice. Seven days later, spleen cells were tested for peptide-specific CTL responses (A-B), for the frequency of peptide-specific IFN-γ–producing cells among splenocytes (C-D), and for the IFN-γ concentration in response to OVA257-264 or GP3333-41 peptide (E-F). CTL activity was assessed on OVA257-264 (A) or GP3333-41 peptide–loaded target cells (B). The percentages of specific lysis presented were obtained for a 30:1 effector-to-target ratio after subtraction of unspecific lysis. (C-D) Frequency of peptide-specific IFN-γ spot-forming cells (sfc's) in spleens was quantified by ELISPOT. (E-F) IFN-γ production was determined in culture supernatants of restimulated splenocytes from immunized mice. Each symbol corresponds to an individual mouse. Results show the cumulative results obtained in 10 independent experiments for OVA-loaded, unstimulated pDCs and in 4 independent experiments for GP33-loaded, unstimulated pDCs and CpG and virus-activated pDCs. Horizontal bars represent medians. Statistical analysis compared the CD8+ T-cell responses induced by each DC group to those induced by virus-activated peptide-loaded pDCs. NS indicates not significant.
In vivo induction of CD8+T-cell responses by adoptive transfer of DC subsets. (A,C,E) Purified pDCs and cDCs isolated from untreated or CpG-injected 129sv mice were loaded or not with OVA257-264 peptide (pep) and transferred into syngeneic mice. (B,D,F) Purified pDCs and cDCs isolated from untreated or heat-inactivated influenza virus-injected 129sv mice were loaded or not with GP3333-41 peptide and transferred into 129sv syngeneic mice. Seven days later, spleen cells were tested for peptide-specific CTL responses (A-B), for the frequency of peptide-specific IFN-γ–producing cells among splenocytes (C-D), and for the IFN-γ concentration in response to OVA257-264 or GP3333-41 peptide (E-F). CTL activity was assessed on OVA257-264 (A) or GP3333-41 peptide–loaded target cells (B). The percentages of specific lysis presented were obtained for a 30:1 effector-to-target ratio after subtraction of unspecific lysis. (C-D) Frequency of peptide-specific IFN-γ spot-forming cells (sfc's) in spleens was quantified by ELISPOT. (E-F) IFN-γ production was determined in culture supernatants of restimulated splenocytes from immunized mice. Each symbol corresponds to an individual mouse. Results show the cumulative results obtained in 10 independent experiments for OVA-loaded, unstimulated pDCs and in 4 independent experiments for GP33-loaded, unstimulated pDCs and CpG and virus-activated pDCs. Horizontal bars represent medians. Statistical analysis compared the CD8+ T-cell responses induced by each DC group to those induced by virus-activated peptide-loaded pDCs. NS indicates not significant.
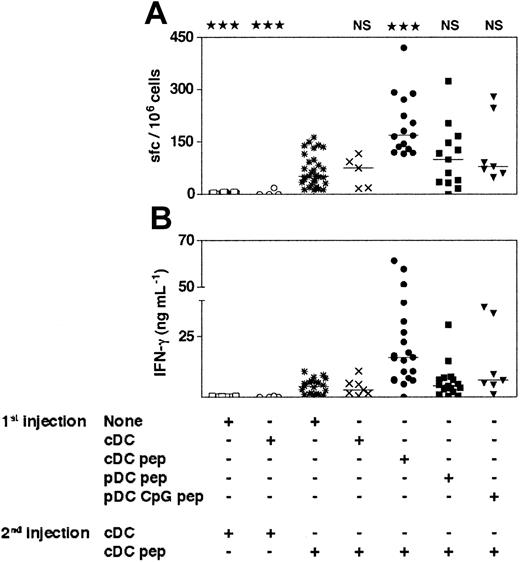
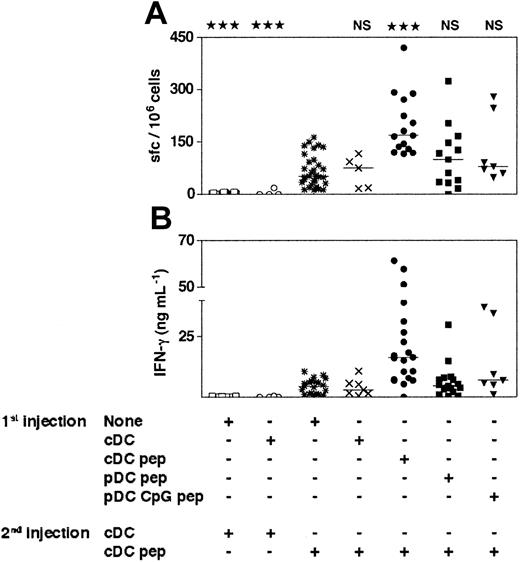
The cDCs induce primary-like CD8+T-cell responses in mice that have been previously immunized with immature or CpG-activated pDCs. The 129sv mice were injected with purified immature or CpG-activated cDCs or pDCs loaded or not with OVA257-264 peptide (1st injection). Three weeks later, mice received a second injection of purified cDCs loaded or not with OVA257-264 peptide (2nd injection). Seven days after the second injection, the frequency of peptide-specific, IFN-γ–producing cells (A) and the IFN-γ concentration in response to OVA257-264 peptide (B) were determined. Each symbol corresponds to an individual mouse. Horizontal bars represent medians. The cumulative results of 4 independent experiments are shown. Statistical analysis compared the responses induced by OVA-loaded cDCs to the responses induced by the other DC groups. The same degree of statistical significance was obtained for the results of the ELISPOT and ELISA experiments.
The cDCs induce primary-like CD8+T-cell responses in mice that have been previously immunized with immature or CpG-activated pDCs. The 129sv mice were injected with purified immature or CpG-activated cDCs or pDCs loaded or not with OVA257-264 peptide (1st injection). Three weeks later, mice received a second injection of purified cDCs loaded or not with OVA257-264 peptide (2nd injection). Seven days after the second injection, the frequency of peptide-specific, IFN-γ–producing cells (A) and the IFN-γ concentration in response to OVA257-264 peptide (B) were determined. Each symbol corresponds to an individual mouse. Horizontal bars represent medians. The cumulative results of 4 independent experiments are shown. Statistical analysis compared the responses induced by OVA-loaded cDCs to the responses induced by the other DC groups. The same degree of statistical significance was obtained for the results of the ELISPOT and ELISA experiments.
Results
Plasmacytoid DCs are poorly efficient at in vitro antigen presentation
A novel DC subset defined as plasmacytoid DCs and phenotypically described as CD11cloB220+Ly6+ cells has been identified in mice.11-13 To characterize these cells further, we purified pDCs from the spleens of 129sv mice by positively selecting CD11clo/+ cells and then sorting them on the basis of B220 expression. Purified CD11cloB220+ cells showed a plasmacytoid morphology, as previously described,11-13 and were CD19–, CD8lo, CD4+/–, CD11b–, GR1+, CD40–, CD80–, CD86–, I-Ab+/–, and Kb+ (data not shown). After stimulation with CpG (ODN 1826) or heat-inactivated influenza virus in vitro, the expression of CD40 and CD86 molecules increased on the CD11cloB220+ subpopulation (Figure 1A). Kb expression was only up-regulated after CpG stimulation. Both CD11cloB220+ and CD11c+B220– cells produced IL-12p40 after CpG stimulation (Figure 1B). However, only the CD11cloB220+ subset produced IL-12p40 and IFN-α in response to heat-inactivated influenza virus. Thus, both signals induced phenotypic maturation of CD11cloB220+ cells and the production of IL-12p40, but IFN-α was only secreted after viral stimulation.
Unstimulated pDCs were far less efficient than cDCs at presenting the OVA257-264 peptide to B3Z T-cell hybridoma (Figure 1C). High number of pDCs induced secretion of IL-2, indicating that pDCs are able to present peptides. However, nonstimulated pDCs did not induce the in vitro proliferation of naive CD8+ T cells derived from HY Tg mice21 (Figure 1D). After CpG stimulation, pDCs acquired the capacity to induce HY T-cell proliferation. In contrast, virus-activated pDCs failed to stimulate any detectable response of HY T cells (Figure 1D).
Usually, 2 × 10⁵ to 3 × 10⁵ pDCs were obtained from 1 129sv mouse, but after 18 hours of stimulation in vitro, 60% to 80% of the purified cells died. Moreover, culture of pDCs led to a slight up-regulation of maturation markers, a phenomenon previously observed for cDCs. Therefore, to avoid the injection of dead cells, to limit the effect of culture-induced signaling, and to estimate physiologic DC activation as far as possible, pDCs were purified after in vivo stimulation with CpG or heat-inactivated virus. After injection of CpG, CD40, CD86 and Kb expression was up-regulated on pDCs (Figure 1E). No IFN-α was secreted by cDCs or pDCs from CpG-injected mice (data not shown). In contrast, after intravenous injection of heat-inactivated influenza virus, purified pDCs produced large amounts of IFN-α (Figure 1F). No IFN-α was produced when pDCs were purified from allantoid liquid (AL)–injected control mice. Thus, pDCs are activated in vivo by CpG or influenza virus.
Plasmacytoid and conventional DCs migrate to the spleens of recipient mice after intravenous transfer
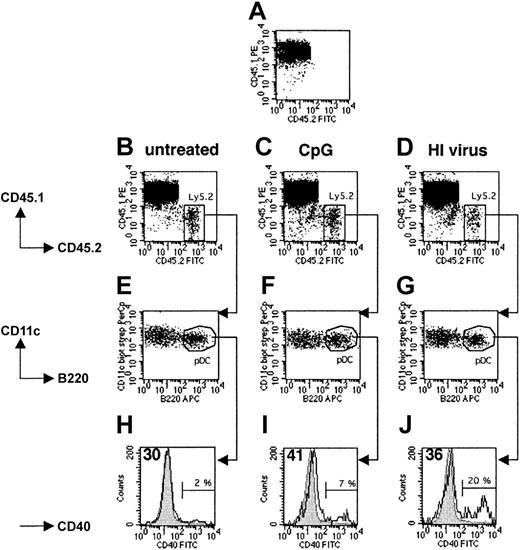
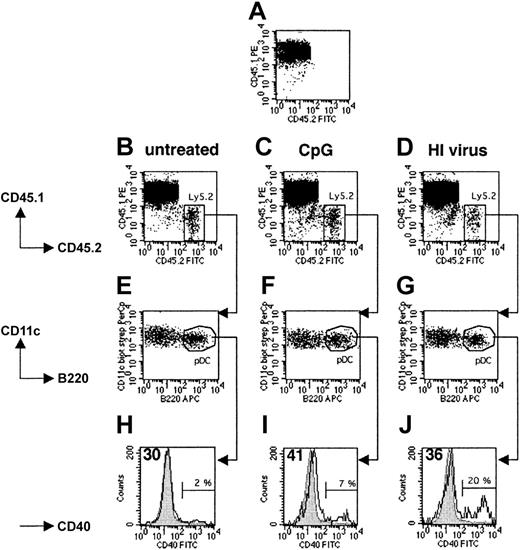
To determine whether both pDCs and cDCs enter to the spleens of recipient mice after intravenous injection, we injected 5 × 10⁶ to 8 × 10⁶ splenic DCs isolated from untreated, CpG-injected, or heat-inactivated virus-injected Ly5.2+ 129sv mice into Ly5.1+ C57BL/6 hosts. Fifteen hours later, 1% to 2% of all live spleen DCs in the host mice originated from the donor (Figure 2B-D). As expected, no Ly5.2+ DCs were found in noninjected Ly5.1+ control mice (Figure 2A). Importantly, the ratio of cDCs to pDCs was identical in the recovered and transferred populations in all cases, indicating that there was no selective migration or survival among these DC subsets (Figure 2E-G). Donor Ly5.1– pDCs isolated from untreated mice expressed similar levels of CD40 as endogenous Ly5.1+ pDCs from the host (Figure 2H) and freshly isolated Ly5.2+ pDCs from naive mice (data not shown). Thus, the purification and transfer procedure did not induce phenotypic maturation. After transfer, CpG-activated pDCs continued to express higher levels of CD40 (Figure 1E) than untreated endogenous pDCs (Figure 2I), as was the case at the time of injection. A slight increase in CD40 expression was observed on 80% of the pDCs recovered from mice injected with heat-inactivated virus, the remaining 20% expressing high levels of CD40 (Figure 2J). Thus, both the pDC and cDC subpopulations enter the spleens of recipient mice after intravenous transfer, and migration is not affected by the in vivo activation of splenic pDCs prior to their isolation. Furthermore, activated pDCs develop a mature phenotype.
Migration and maturation of pDCs transferred into the host spleen. CD11c+ spleen cells purified from untreated (B,E,H), CpG-injected (C,F,I), or heat-inactivated (HI) influenza virus-injected (D,G,J) Ly5.2+ 129sv mice were intravenously transferred into Ly5.1+ C57BL/6 recipient mice. Fifteen hours later, mice were killed and total DCs were isolated from spleens and labeled with either CD11c, B220, CD45.1, and CD45.2 mAbs or CD11c, B220, CD45.1, and CD40 mAbs and analyzed. (A) Control Ly5.1 mouse that did not receive Ly5.2+ DCs. (B-D) Ly5.2+ cells (labeled with CD45.2 mAbs) were found in the spleens of Ly5.1 recipient mice. (E-G) Analysis of CD11c and B220 expression by recovered Ly5.2+ cells. (H-J) Analysis of CD40 expression by Ly5.1–CD11c+B220+ cells. For all analyses, we checked that the Ly5.1– population corresponded to the injected Ly5.2+ DCs. Gray histograms represent CD40 expression by unstimulated endogenous Ly5.1+ pDCs. Open histograms represent CD40 expression by transferred Ly5.2+ pDCs. Percentages indicate the proportion of transferred pDCs that strongly up-regulated the expression of CD40 at their surface. The mean intensity of the fluorescence signal of the main peak of transferred DCs is indicated in the top left corners of histograms. Results are representative of 2 independent experiments. FITC indicates fluorescein isothiocyanate.
Migration and maturation of pDCs transferred into the host spleen. CD11c+ spleen cells purified from untreated (B,E,H), CpG-injected (C,F,I), or heat-inactivated (HI) influenza virus-injected (D,G,J) Ly5.2+ 129sv mice were intravenously transferred into Ly5.1+ C57BL/6 recipient mice. Fifteen hours later, mice were killed and total DCs were isolated from spleens and labeled with either CD11c, B220, CD45.1, and CD45.2 mAbs or CD11c, B220, CD45.1, and CD40 mAbs and analyzed. (A) Control Ly5.1 mouse that did not receive Ly5.2+ DCs. (B-D) Ly5.2+ cells (labeled with CD45.2 mAbs) were found in the spleens of Ly5.1 recipient mice. (E-G) Analysis of CD11c and B220 expression by recovered Ly5.2+ cells. (H-J) Analysis of CD40 expression by Ly5.1–CD11c+B220+ cells. For all analyses, we checked that the Ly5.1– population corresponded to the injected Ly5.2+ DCs. Gray histograms represent CD40 expression by unstimulated endogenous Ly5.1+ pDCs. Open histograms represent CD40 expression by transferred Ly5.2+ pDCs. Percentages indicate the proportion of transferred pDCs that strongly up-regulated the expression of CD40 at their surface. The mean intensity of the fluorescence signal of the main peak of transferred DCs is indicated in the top left corners of histograms. Results are representative of 2 independent experiments. FITC indicates fluorescein isothiocyanate.
In vivo stimulation of naive transgenic CD8+ T cells by pDCs
To compare the capacity of splenic pDCs and cDCs to stimulate in vivo naive CD8+ T cells, we used an adoptive transfer model ensuring both that T cells are naive and that antigen presentation strictly depends on a defined DC subset. We transferred 4 × 10⁵ CFSE-labeled LN cells from female H-2b Rag–/– HY mice depleted of DCs into allogeneic Rag–/–γc–/– H-2a female hosts lacking both NK cells and lymphocytes.23 These cells were coinjected with 2 × 10⁵ purified H-2b male total DCs, pDCs, or cDCs.30 As the control group, DC-depleted HY T cells were injected alone into male hosts. Eight days after transfer, 4 × 10⁶ to 6 × 10⁶ T cells were recovered from the spleens of mice injected with total DCs and 15 × 106 to 20 × 106 from those injected with cDCs, showing that strong T-cell expansion had occurred in both cases. Only 2 × 10⁵ to 5 × 10⁵ T cells were recovered from the spleens of mice injected with pDCs and 8 × 10⁴ to 10 × 104 from hosts injected with T cells alone (data not shown). The CFSE profiles of T cells activated by cDCs and total DCs confirmed strong expansion, with most of the cells having divided more than 8 times. However, weaker CFSE dilution was observed for T cells injected with pDCs (Figure 3A). Most of the T cells coinjected with total DCs, cDCs, and pDCs expressed CD44. The weak activation of the T cells coinjected with pDCs is probably due to slight contamination of the transferred pDCs with cDCs, leading to full activation of few T cells including both expansion and CD44 expression. T cells injected alone did not proliferate and were CD44lo, indicating that transferred T cells are not spontaneously activated after their transfer. Furthermore, T cells injected alone or cotransferred with pDCs did not functionally differentiate, as hardly any IFN-γ production (Figure 3B-C) or cytolytic activity (Figure 3D) could be detected. In contrast, strong and similar functional responses were obtained from T cells stimulated by total DCs and cDCs.
The pDCs fail to activate CD8+transgenic T-cell responses in vivo. Rag–/–γc–/– mice were injected intravenously with naive CFSE-labeled HY Tg T cells alone or with total DCs (totDCs), pDCs, or cDCs from male 129sv mice as indicated. One uninjected Rag–/–γc–/– mouse was used as a control (no HY). (A) Seven days later, spleen cells were harvested. CFSE profiles (top) and CD44 markers (bottom) on CD8+ Tg T cells were analyzed. Dot plots show representative results obtained in one of the mice tested in the experiment. (B) HY-specific IFN-γ production by CD8+ T cells from injected mice in culture supernatants of splenocytes. (C) Frequency of HY-specific IFN-γ–producing T cells in the spleens of injected mice was quantified by ELISPOT. (D) HY-specific T cells from injected mice were assessed for their ability to lyse peptide-coated EL-4 target cells ex vivo (left). Unspecific lysis of unloaded EL-4 cells is also shown (right). (B-D) Results are means ± SDs of 2 (HY, HY+ totDCs, and HY+ cDCs) or 3 mice (HY + pDCs) and are representative of 3 independent experiments. Error bars represent SDs. E/T indicates effector-to-target ratio.
The pDCs fail to activate CD8+transgenic T-cell responses in vivo. Rag–/–γc–/– mice were injected intravenously with naive CFSE-labeled HY Tg T cells alone or with total DCs (totDCs), pDCs, or cDCs from male 129sv mice as indicated. One uninjected Rag–/–γc–/– mouse was used as a control (no HY). (A) Seven days later, spleen cells were harvested. CFSE profiles (top) and CD44 markers (bottom) on CD8+ Tg T cells were analyzed. Dot plots show representative results obtained in one of the mice tested in the experiment. (B) HY-specific IFN-γ production by CD8+ T cells from injected mice in culture supernatants of splenocytes. (C) Frequency of HY-specific IFN-γ–producing T cells in the spleens of injected mice was quantified by ELISPOT. (D) HY-specific T cells from injected mice were assessed for their ability to lyse peptide-coated EL-4 target cells ex vivo (left). Unspecific lysis of unloaded EL-4 cells is also shown (right). (B-D) Results are means ± SDs of 2 (HY, HY+ totDCs, and HY+ cDCs) or 3 mice (HY + pDCs) and are representative of 3 independent experiments. Error bars represent SDs. E/T indicates effector-to-target ratio.
Thus, in contrast to cDCs, and in a context excluding any potential antigen cross-presentation, ex vivo–isolated nonactivated pDCs are not able to induce the activation, expansion, or differentiation of naive CD8+ T cells in vivo.
In vivo stimulation of naive polyclonal CD8+ T cells by pDCs
We then tested the ability of pDCs to induce specific CD8+ T-cell responses in a more physiologic context. Control cDCs and pDCs were purified from spleens of 129sv mice loaded with the OVA257-264 or the LCMV GP3333-41 peptide and intravenously injected into syngenic mice. One week later, splenocytes were recovered from immunized mice and CD8+ T-cell responses were assessed by measuring IFN-γ production and cytotoxic T-cell activity. Immature pDCs never primed any OVA- or GP33-specific CTL activity or IFN-γ production, whereas peptide-loaded cDCs induced heterogeneous but specific IFN-γ responses and CTL activity (Figure 4). Furthermore, neither IL-5 nor IL-10 was produced regardless of the DC subset injected (data not shown). As expected, no CD8+ T-cell responses were induced by unloaded pDCs or cDCs.
We next determined whether pDCs stimulated in vivo by CpG or virus acquired the ability to prime naive CD8+ T cells in vivo. We did not detect OVA-specific CTL responses, IFN-γ production (Figure 4), IL-5 production, or IL-10 production (data not shown) after injection of OVA-loaded CpG-activated pDCs. As influenza virus was produced in the allantoid, which contains a large amount of ovalbumin that might generate OVA-specific responses, we used the GP3333-41 CD8+ T-cell epitope to assess the capacity of virus-stimulated pDCs to induce peptide-specific CD8+ T-cell responses. As opposed to immature pDCs that failed to prime GP33-specific T cells, virus-activated pDCs induced CTL responses associated with production of IFN-γ in 4 of 7 immunized mice (Figure 4). Fewer IFN-γ–secreting cells and less IFN-γ were detected than for cDCs. These results were confirmed in a transfer experiment using the HY transgenic model (Figure S1; see the Supplemental Figures link at the top of the online article on the Blood website). Male pDCs induced strong proliferation and accumulation of HY T cells only after their activation with heat-inactivated virus. This expansion was associated with up-regulation of CD44 and specific differentiation into IFN-γ–secreting cells. Thus, viral activation clearly endows pDCs with the ability to prime naive CD8+ T cells. Furthermore, these results clearly indicate that pDCs are able to process and present endogenous antigens to induce CD8+ T-cell responses. Unlike immature and CpG-activated pDCs, virus-stimulated pDCs prime CD8+ T-cell responses with cytotoxic and IFN-γ production functions.
Immature or CpG-activated pDCs do not induce antigen-specific unresponsiveness in 129sv mice
As it has been suggested that pDCs are tolerogenic,17 and despite the absence of antigen-specific IL-10 secretion in our experiments (data not shown), we determined whether prior injection of immature or CpG-activated pDCs would specifically suppress induction of CD8+ T-cell responses. To test this hypothesis, we injected OVA-loaded immature or CpG-activated pDCs into 129sv mice by the intravenous route. Twenty-one days later, mice received 2 × 10⁵ OVA-loaded cDCs. IFN-γ production and the frequency of IFN-γ–producing cells were similar in mice primed with loaded pDCs and boosted with loaded cDCs and in mice that received a single injection of loaded cDCs (Figure 5). Similar results were obtained after a boost with subcutaneous injection of OVA257-264 peptide in incomplete Freund adjuvant (data not shown). As expected, OVA-specific responses were significantly stronger in mice injected twice with loaded cDCs than in mice injected once with OVA-loaded cDCs, and no response was observed when mice were boosted with unloaded cDCs. Hence, previous injection of OVA-loaded immature or CpG-activated pDCs does not affect the generation of OVA-specific CD8+ T-cell responses by cDCs. Injection of immature or CpG-activated pDCs loaded with OVA257-264 peptide does not induce antigen-specific tolerance or CD8 regulatory T cells. Furthermore, simultaneous injection of graded numbers of immature pDCs with cDCs did not affect the CD8+ T-cell responses induced by cDCs (Figure S2), indicating that immature pDCs have no inhibitory activity on the induction of such response.
CD8+ T cells primed by virus-activated pDCs generate effector/memory T cells
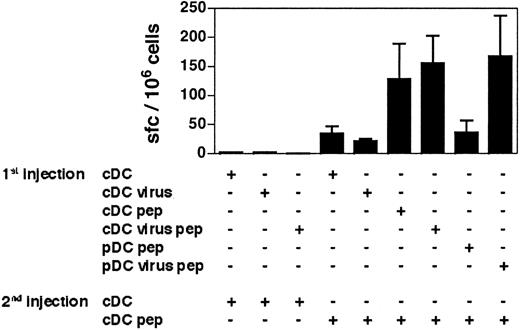
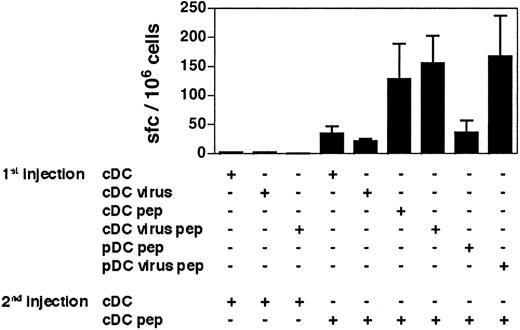
To determine whether the CD8+ T-cell responses induced by virus-activated pDCs can be recalled, we immunized mice twice with various combinations of DC subsets at 30 days of interval. Both loaded virus-activated pDCs and cDC-primed CD8+ T cells gave similar recall responses when boosted with cDCs (Figure 6). Thus, whereas virus-activated pDCs seem to be less efficient than cDCs at inducing primary responses, both DC subsets generate antigen-experienced CD8+ T cells fully able to respond to a second in vivo stimulation. These results confirm that virus-activated pDCs are able to activate CD8+ T cells and strongly suggest that they support the generation of effector/memory CD8+ T-cell responses as efficiently as cDCs.
The cDCs induce secondary-like CD8+T-cell responses in mice that have previously received virus-stimulated pDCs. The 129sv mice primed with the DC subsets indicated in the figure (1st injection) received a second injection of GP33-loaded or unloaded DCs (2nd injection) 30 days later. One week after the second injection, the frequency of GP33-specific IFN-γ–producing cells in response to the GP3333-41 peptide was determined by ELISPOT. The results presented are the cumulative data obtained in 4 independent experiments. Bars represent the means of 2 to 7 mice ± SDs.
The cDCs induce secondary-like CD8+T-cell responses in mice that have previously received virus-stimulated pDCs. The 129sv mice primed with the DC subsets indicated in the figure (1st injection) received a second injection of GP33-loaded or unloaded DCs (2nd injection) 30 days later. One week after the second injection, the frequency of GP33-specific IFN-γ–producing cells in response to the GP3333-41 peptide was determined by ELISPOT. The results presented are the cumulative data obtained in 4 independent experiments. Bars represent the means of 2 to 7 mice ± SDs.
CpG-activated pDCs, but not immature pDCs, can stimulate antigen-experienced T cells in vivo
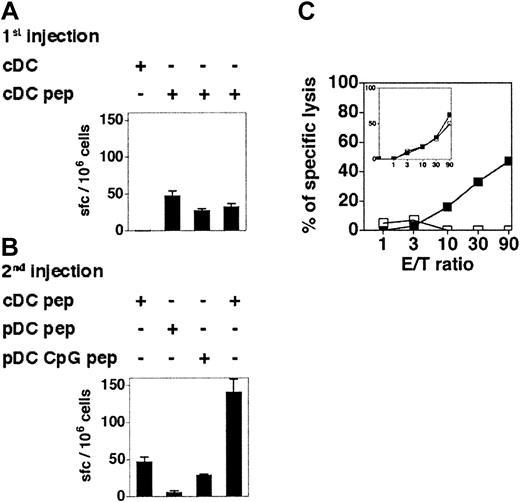
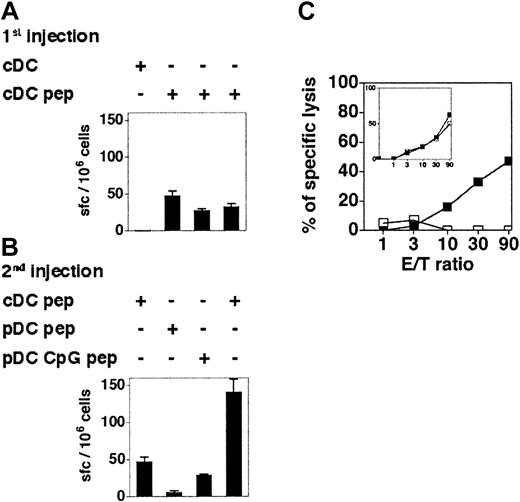
It has been reported that immature murine pDCs can stimulate antigen-experienced nonpolarized transgenic CD4+ T cells to produce IFN-γ in vitro.16 To determine the capacity of immature and CpG-activated pDCs to stimulate memory CD8+ T-cell responses in vivo, 129sv mice were immunized with cDCs loaded with OVA257-264. One week later, these mice were hemisplenectomized and the primary responses were quantified by IFN-γ ELISPOT assay (Figure 7A) and by measuring the CTL activity (Figure 7C inset) of recovered splenocytes. Mice showing similar OVA-specific CD8+ T-cell responses were boosted with OVA-loaded immature or CpG-activated pDCs 6 weeks later, and the OVA-specific responses of individual mice were analyzed (Figure 7). Immature OVA-loaded pDCs were unable to reactivate antigen-experienced CD8+ T cells, as neither IFN-γ–producing cells nor OVA-specific CTL activity were detected. In contrast, CpG-activated pDCs were able to recall CD8+ T-cell responses, although they were less efficient than cDCs. Hence, immature pDCs are unable to activate CD8+ T cells in vivo, but pDCs acquire the capacity to recall antigen-experienced CD8+ T cells after in vivo CpG stimulation.
CpG-activated but not immature pDCs are able to recall CD8+T-cell memory. (A-B) The 129sv mice were injected with cDCs loaded or not with OVA257-264 peptide (1st injection) and hemisplenectomized 7 days later. The frequency of OVA-specific IFN-γ–producing cells in the spleen was determined by ELISPOT assay (A). Six weeks after the first injection, these mice were boosted with a second injection of cDCs, immature pDCs, or CpG-activated pDCs, loaded or not with OVA257-264 peptide (2nd injection). (B) The frequency of OVA-specific IFN-γ–producing cells after the boost was determined by ELISPOT. Each bar corresponds to an individual mouse. Error bars represent SDs. Results are representative of 3 independent experiments. (C) CTL responses in mice that have received peptide-loaded pDCs (□) or CpG-activated pDCs (▪) 6 weeks after being primed with OVA-loaded cDCs. Primary CTL responses induced by cDCs are shown in the inset. Each curve corresponds to one mouse. Results are representative of 2 independent experiments.
CpG-activated but not immature pDCs are able to recall CD8+T-cell memory. (A-B) The 129sv mice were injected with cDCs loaded or not with OVA257-264 peptide (1st injection) and hemisplenectomized 7 days later. The frequency of OVA-specific IFN-γ–producing cells in the spleen was determined by ELISPOT assay (A). Six weeks after the first injection, these mice were boosted with a second injection of cDCs, immature pDCs, or CpG-activated pDCs, loaded or not with OVA257-264 peptide (2nd injection). (B) The frequency of OVA-specific IFN-γ–producing cells after the boost was determined by ELISPOT. Each bar corresponds to an individual mouse. Error bars represent SDs. Results are representative of 3 independent experiments. (C) CTL responses in mice that have received peptide-loaded pDCs (□) or CpG-activated pDCs (▪) 6 weeks after being primed with OVA-loaded cDCs. Primary CTL responses induced by cDCs are shown in the inset. Each curve corresponds to one mouse. Results are representative of 2 independent experiments.
Discussion
Plasmacytoid DCs produce cytokines1,2,12,31 and activate NK cells3,4 and are thus clearly involved in innate immune responses. In contrast, their role in adaptive responses remains unclear. The pDCs indirectly regulate T-cell function via IFN-α/β–mediated effects on other DC subsets.14,32 However, their capacity to prime CD8+ T cells remains controversial and appears to depend on the virus used to stimulate pDCs, even though this has only been studied in vitro.14,16 In this study, we analyzed the ability of nonactivated and activated pDCs to generate CD8+ T-cell responses in vivo. We first show that pDCs home to the spleen after intravenous transfer and undergo phenotypic maturation when stimulated with CpG or heat-inactivated influenza virus. Despite being activated, pDCs do not differentiate into a classical-like DC subset (CD11c+B220–CD8+CD205–) in contrast to the situation following viral infection.33 This indicates that live influenza virus delivers stronger or different signals compared with killed influenza virus.
We clearly showed that immature pDCs fail to prime effector CD8+ T cells in vivo, a result that is consistent with in vitro studies.11-13,15,16 Immature DCs have previously been shown to be tolerigenic.34-37 We also show that immature pDCs do not induce antigen-specific CD8+ regulatory T cells or render mice tolerant toward a second immunization in our in vivo priming model. Similar results were obtained by Salio et al38 and are in agreement with the results of Wakkach et al,39 showing that pDCs do not induce CD4+ regulatory T cells in vivo. Thus, immature pDCs do not exert a regulatory role in vivo, even though they express low levels of costimulatory molecules.
After CpG-mediated TLR9 triggering,40 pDCs fail to prime CD8+ T cells in vivo, contrasting with in vitro observations, and do not induce regulatory T cells. However, CpG-activated pDCs, but not immature pDCs, did recall in vivo effector/memory CD8+ T cells, confirming that the TLR9-mediated activation of pDCs increases their capacity to activate T cells. Our results contrast with those of Krug et al,16 who showed that immature pDCs activate antigen-experienced CD4+ T cells. However, in Krug's study,16 the T-cell population consisted of unpolarized transgenic T cells primed in vitro and restimulated after short-term culture, meaning that they could easily be reactivated. Nevertheless, we show here that CpG-activated pDCs are less efficient than cDCs at stimulating effector/memory responses. Thus, neither immature nor CpG-activated pDCs behave like professional APCs in vivo, as they do not prime naive T cells. In a recent paper, Salio et al38 showed that CpG-activated spleen pDCs are able to induce in vivo CTL responses to endogenous antigens. However in this study, spleen pDCs were activated in vivo with a high amount of CpG (200 μg/mice), and CTL responses were detectable only upon in vivo restimulation with a strong immunogen (vaccinia virus). While this result shows that CpG-activated pDCs are capable of in vivo priming of CD8+ T-cell responses, it also indicates that activation by CpG is not very efficient at turning pDCs into potent immunostimulatory cells.
In contrast, pDCs stimulated in vivo by heat-inactivated influenza virus, which signals through a TLR9-independent pathway,20 trigger specific CTL responses in vivo. Although our results suggest that virus-activated pDCs are less efficient than cDCs at priming CD8+ T cells, this stimulation might be due to the 15% to 20% of virus-activated pDCs that highly up-regulated CD40 expression after their intravenous transfer, making them as efficient as cDCs. Virus-activated pDCs also generated specific effector/memory CD8+ T-cell responses that could be recalled 4 weeks later. These data demonstrate for the first time that pDCs differentiate into professional APCs after viral stimulation in vivo.
The fact that a single population of DCs can both produce type I IFNs and induce specific T-cell responses, linking innate and adaptive immunity, may represent a key event in protection against most viral infections. Type I IFNs are secreted early in response to infection with viruses, although the nature of the main IFN-producing cells in vivo remains unclear and depends on the virus.31,41,42 IFN-α/β have been reported to enhance both humoral and cellular antiviral immune responses potently in vivo,43-46 mainly through their action on DCs.32 IFN-α has recently been shown to promote CD8+ T-cell cross-priming.47 Thus, pDCs may acquire the ability to generate specific antiviral responses in the absence of direct infection as demonstrated for human pDCs.9
This is the first demonstration that pDCs play a direct role in CD8+ T-cell priming in vivo. Some studies have suggested that pDCs are mainly dedicated to cytokine secretion upon stimulation, whereas cDCs present antigens and prime T cells.14,15 However, our results suggest that pDCs orchestrate antiviral immunity by activating innate effectors, producing cytokines that stimulate other DC subsets, and initiating CD8+ T-cell responses.
Prepublished online as Blood First Edition Paper, May 27, 2004; DOI 10.1182/blood-2004-02-0426.
Supported by the Agence Nationale de Recherche sur le SIDA. G.S. was supported by fellowships from the French government and Association pour la Recherche contre le Cancer.
The online version of the article contains a data supplement.
An Inside Blood analysis of this article appears in the front of this issue.
The publication costs of this article were defrayed in part by page charge payment. Therefore, and solely to indicate this fact, this article is hereby marked “advertisement” in accordance with 18 U.S.C. section 1734.
We thank Anne-Marie Balazuc for sorting the DC subpopulations.

