Abstract
The c-myb proto-oncogene has been implicated in leukemogenesis, but possible mechanisms remain ill defined. To gain further insight to this process, we used transcript profiling in K562 cells expressing a dominant-negative Myb (MERT) protein. A total of 105 potential Myb gene targets were identified. Neuromedin U (NmU), a peptide affecting calcium transport, underwent the greatest expression change (∼ 5-fold decrease). To verify a linkage between c-myb and NmU, their mRNA levels were quantitated using real-time polymerase chain reaction in primary acute myeloid leukemia (AML) and acute lymphoid leukemia (ALL), as well as normal hematopoietic cells. We found that c-myb was elevated in AML and ALL samples, but NmU expression was increased only in AML cells. Significantly, only AML cells expressed the cognate receptor of NmU, NMU1R, suggesting the presence of a novel autocrine loop. We examined this possibility in detail. Exogenous NmU “rescued” growth suppression in K562-MERT cells and stimulated the growth of primary AML cells. Short interfering RNA “knockdown” of NmU in K562 cells arrested cell growth. Exposing Indo-1–labeled K562 cells to NmU induced an intracellular Ca++ flux consistent with engagement of the NMU1R. Combined, these results suggest that NmU expression is related to Myb and that the NmU/NMU1R axis constitutes a previously unknown growth-promoting autocrine loop in myeloid leukemia cells.
Introduction
The proto-oncogene c-myb encodes a transcription factor, Myb, that is expressed predominantly in immature hematopoietic cells1-3 where it plays a critical role in definitive hematopoiesis.4-6 c-Myb transactivates its target genes by binding to a well-defined consensus sequence, [PyAAC(T/G)G], referred to as the Myb responsive element.7 Of genes known to be induced by Myb, many regulate cell proliferation, differentiation, and survival including c-myc,8-12 cdc2,13 c-kit,14-16 GATA1,17 mim1,18 myeloblastin,19 and bcl2.20,21
The oncogenic potential of myb was first observed in birds, when it was discovered that a truncated form of the cellular proto-oncogene, called viral-myb (v-myb), was contained within the AMV and E26 leukemia viruses.22-24 v-myb has deletions at its 5′ and 3′ ends, which results in a protein missing a small, but apparently inconsequential, portion of its DNA-binding domain and virtually its entire negative regulatory domain. Loss of the negative regulatory domain is thought to contribute to the transforming ability of the protein.25 These deletions may have arisen as a result of retroviral insertional mutagenesis because the myb locus is known to undergo retroviral insertion.22 Further, retroviral insertion of c-myb in chicken and mouse models produces a truncated form of the c-myb gene, which causes B- and T-cell lymphomas26-29 and myeloid leukemias,10,30-32 respectively.
In humans, aberrant expression of c-myb has been associated with leukemia33 as well as a number of solid tumor cancers such as colon cancer.34 Exposing human cell lines and primary leukemic blast cells to antisense c-myb oligodeoxynucleotides inhibits their growth at doses where normal hematopoietic progenitor cells survive.35 One explanation for this differential sensitivity is that c-Myb regulates a unique set of genes in leukemic cells that are required for survival.36
To identify potential Myb target genes in human leukemia cells, we used a tamoxifen-inducible, dominant-negative Myb expression construct (MERT) that had been used previously with success to examine Myb function in murine T cells20,37-39 and murine myeloblastic cells.10 We engineered K562 cells40 to express MERT (K562-MERT) and then performed transcript profiling experiments comparing gene expression in the presence or absence of tamoxifen. Using this strategy, we identified 105 potential Myb gene targets including neuromedin U (NmU), which underwent the largest change observed. NmU was first isolated from porcine spinal cord extracts and named for its uterine contraction activity.41 It is reportedly expressed in bone marrow cells,42 but its function is unknown. We report herein that c-myb and NmU expression are elevated in primary acute myelogenous leukemia (AML) cells and the identification of a novel autocrine growth loop in myeloid leukemia cells formed by NmU and its cognate receptor, NMU1R.
Materials and methods
Adherent and suspension cell culture
The 293 and K562 cells were originally obtained from the American Type Culture Collection (Manassas, VA). They were maintained in Dulbecco modified media, and RPMI 1640, respectively, supplemented with 10% fetal bovine serum (FBS), 1% l-glutamine (2 mM), and 0.5% penicillin/streptomycin (pen/strep) antibiotics (50 U/mL and 50 μg/mL, respectively). Primary hematopoietic cells were purified by Ficoll-Hypaque sedimentation from bone marrow aspirates, pheresis specimens, and peripheral blood from 6 healthy donors and patients with acute lymphocytic leukemia (ALL; n = 7) or AML (n = 11). Bone marrow aspirates, pheresates, and peripheral blood were obtained in accordance with the guidelines approved by the Institutional Review Board of the University of Pennsylvania.
Primary AML cells from 4 patients were cultured for 8 days in duplicate in Iscove medium supplemented with a cytokine cocktail (100 ng/mL stem cell factor [SCF], 6 ng/mL interleukin 3 [IL-3], and 6 ng/mL IL-6) in the absence or presence of 100 μM NmU peptide (NH2-FRVDEEFQSPFASQSRGYFLFRPRN-NH2; Invitrogen Life Technologies, Carlsbad, CA). Cell cultures were examined with an inverted microscope at days 2, 4, 6, and 8. On the first day there appeared to be differences in cell numbers; the cells were counted using a hemacytometer and viability determined, to confirm and quantitate the visual impression of differences in cell growth.
Colony-forming assays
K562-MERT cells (1.5 × 10³ cells/mL) were cultured in a methylcellulose mixture containing 10 ng granulocyte-macrophage colony-stimulating factor (GM-CSF) and 20 ng IL-3, in the absence and presence of 1 μM 4-hydroxytamoxifen (4-OHT) or 35 μM NmU peptide or both. As a control, K562 cells were cultured under the same conditions. Colonies were scored on day 14 of culture. One colony was defined as a colony containing 20 or more cells. The area of K562-MERT colonies was determined using IP Lab software (Scanalytics, Fairfax, VA).
MIGR-MERT preparation
MIGR-MERT was constructed by simultaneously subcloning the DNA-binding domain (DBD) of c-myb as a BgII/SphI fragment and EnER, which is comprised of a Drosophila Engrailed transrepressor (En) and a modified mouse estrogen receptor (ER), as a SphI/EcoRI fragment into the BgII/EcoRI sites of the retroviral bisictronic vector MIGR1 (generously provided by Warren Pear, University of Pennsylvania, Philadelphia). To obtain the DBD of c-myb, pcDNA3myb was amplified in the presence of c-myb primers (forward primer: 5′-AGATCTGCCACCATGAATCGAACAGATGTGCAG-3′; reverse primer: 5′-GCATGCATTGTAGAATTCCAGTGGTT3′) using standard protocols for polymerase chain reaction (PCR). The 360–base pair (bp) amplicon was cloned into pCR-II-TOPO (Invitrogen) as per the manufacturer's instructions and recovered from pCR-II-TOPO by a BglII and SphI double digest. To obtain the EnER gene fragment, pEnERSN (a generous gift from L. Wolff, National Cancer Institute, Bethesda, MD) was digested with SphI and EcoRI.
Preparation of K562-MERT cell line
MIGR-MERT was combined with a GP plasmid, which encodes the Gag and Pol proteins, and a VSV-G plasmid, which encodes the viral Env protein, at a ratio of 1:1:1.5, respectively. The plasmid mixture was cotransfected into 293 cells using the Superfect Transfection Reagent (Qiagen, Valencia, CA) at a ratio of 1:5 total DNA/Superfect Transfection Reagent and cultured as recommended by the manufacturer. The retroviral supernatant was harvested 48 hours after transfection and filtered (0.22 μm). K562 cells (1 × 10⁶ cells/mL) were then infected with filtered retrovirus in the presence of polybrene (8 μg/mL) and centrifuged at 1500g for 90 minutes at room temperature.43 Afterward, the cells were washed with 10 volumes of RPMI supplemented with 10% FBS, 1% l-glutamine, and 0.5% pen/strep and cultured. K562-MERT cells were enriched based on green fluorescent protein (GFP) expression using a FACSTAR flow cytometer (Becton Dickinson, San Jose, CA).
Cell cycle analyses
K562 and K562-MERT cells (1 × 10⁵ cells/mL) were treated in the absence and presence of 1 μM 4-OHT for 72 hours. Following treatment, the cells were fixed with 70% ice-cold ethanol for a minimum of 30 minutes at 4° C. The fixed cells were washed twice with phosphate-buffered saline (PBS), treated with 5 μg/mL DNase-free RNase (Roche, Indianapolis, IN) for 30 minutes at 37° C, and stained with 50 μg/mL propidium iodide (PI) for at least 30 minutes at 4° C in the dark. The PI-stained cells were measured in a FACScan flow cytometer using the CellQuest software (Becton Dickinson) and the data were analyzed for cell cycle distribution using the ModfitLT Mac V3 software.
Isolation of RNA and preparation of cDNA
Total RNA was isolated from K562-MERT and primary cells from healthy donors and patients with AML and ALL using the RNeasy Mini kit (Qiagen) as per the manufacturer's instructions. The RNA was subsequently treated with 1 U/μg RNase-free DNase (Roche) for 1 hour at 37° C and repurified using the RNeasy Mini kit (Qiagen) according to the manufacturer's instructions. Total RNA (0.5 μg) was then reverse transcribed with random hexamer primers (5 ng/mL) and 25 units Moloney Murine Leukemia Virus (M-MLV) Reverse Transcriptase (Invitrogen) as instructed by the manufacturer.
Microarray analysis
K562-MERT cells were cultured in the absence or presence of 1 μM tamoxifen for 72 hours. Total RNA was isolated as described (“Isolation of RNA and preparation of cDNA”) and submitted to Incyte (Wilmington, DE). At Incyte, polyA selection, cyanine 3 (Cy3) and Cy5 labeling, hybridization to an Incyte-manufactured microarray chip containing 10 000 genes, and analyses using GemTools, Microsoft Access, and Statistica software (StatSoft, Tulsa, OK) were completed as described.44,45
Quantitative analysis of c-myb, NmU, GAPDH, and 18S RNA by real-time PCR
Total RNA was purified from K562-MERT cells treated in the absence and presence of 1 μM 4-OHT for 72 hours and reverse transcribed as described. The cDNA was subsequently amplified in TaqMan Universal Master Mix (Applied Biosystems, Foster City, CA) supplemented with gene-specific primers (0.5 μM) and the appropriate gene-specific TaqMan probe (0.1 μM). The PCR parameters set on the iCycler (BioRad Laboratories, Hercules, CA) consisted of 2 minutes at 50° C, 10 minutes at 95° C, then 40 cycles each of 15 seconds at 95° C and 1 minute at 60° C. The same PCR conditions were used for cDNA that was synthesized from the RNA that was purified from healthy donors and patients with AML or ALL. The primers and probes for c-myb, NmU, glyceraldehyde-3-phosphate dehydrogenase (GAPDH), and 18S RNA were designed using Primer Express software (Applied Biosystems). All of the probes contained the reporter dye 6-carboxyfluorescein (FAM) at the 5′ end and quencher dye 6-carboxytetra-methylrhodamine (TAMRA) at the 3′ prime end. The sequences for the primers and probes were as follows: c-myb, forward primer: 5′TCATGGAGACAGTGCACCTGTT-3′, reverse primer: 5′-GGACGATCATGCACCTTGCT-3′, probe: 5′-AGAACACCACTCCACTCCATCTCTGCCA-3′; NmU, forward primer: 5′-GAAGACACAGAAGTTGGGCAAGT3′, reverse primer: 5′-CTCTTCATTCTTCTCTCATGCAGGT-3′, probe: 5′-AGCAACGGATGCACAACTGACGACA-3′); GAPDH, forward primer: 5′-GAAGGTGAAGGTCGGAGTC-3′, reverse primer: 5′-GAAGATGGTGATGGGATTTC-3′, probe: 5′-CAAGCTTCCCGTTCTCAGCC3′, and 18S RNA, forward primer: 5′-GGACATCTAAGGGCATCACAGACC-3′, reverse primer: 5′-TGACTCAACACGGGAAACCTCAC-3′, probe: 5′-TGGCTGAACGCCACTTGTCCCTCTAA-3′. A standard curve for each amplicon was included to quantitate the expression of c-myb, NmU, GAPDH, and 18S RNA in the test cDNA. The standard curve consisted of 5 serial dilutions of a plasmid containing either c-myb, NmU, GAPDH, or 18S RNA and was considered acceptable when the correlation coefficient exceeded 0.995. To quantitate the amount of each gene in a given sample, the mean number of copies from a triplicate determination for each gene in the test cDNA was normalized to the mean number of copies of 18S RNA. These values were converted to the number of copies of a given gene in 1 μg RNA.
Preparation of siRNA and delivery to K562 cells
Using a plasmid containing full-length human NmU (GenBank accession no. NM_006681), T7-NmU-forward primer 5′-TAATACgACTCACTATAC CAg TTg TgC ATC CgT TgC Tg-3′,T7-NmU-reverse primer 5′-TAATACgACTCACTATAC CgA ACC CTg CTg ACC TTC TTC-3′, and standard PCR protocols, we obtained the template for transcription reactions. Double-stranded RNA was generated from the amplicon using Megashortscript Kit (Ambion, Austin, TX) as recommended by the manufacturer. Following transcription, the DNA template was degraded with 10 units DNAse I (15 minutes, 37° C) and double-stranded RNA was digested with 5 units RNAse III (Ambion) (1 hour, 37° C) to obtain a pool of short interfering (si) RNA ranging from 14 to 21 bp. The siRNA pool was purified using size exclusion columns (Princeton Separations, Adelphia, NJ) as instructed by the manufacturer, and the concentration was determined by UV spectrometry. Fluorescent-labeled siRNAs were prepared as described by substituting uridine triphosphate (UTP) with ChromaTide UTP (Molecular Probes, Eugene, OR) in the transcription reaction. Control and NmU siRNAs (8 μg) were delivered to K562 cells by nucleofection (Amaxa Biosystems, Gaithersburg, MD) using Nucleofection kit V and program Q29. Using fluorescent-labeled siRNA and flow cytometry, the nucleofection efficiency was determined to be 86%.
Western blot analysis
Cells were lysed in 10 mM HEPES (4-(2-hydroxyethyl)-1-piperazine ethanesulfonic acid, pH 7.9), 10 mM KCl, 0.1 mM EDTA (ethylenediaminetetraacetic acid), 1 mM dithiothreitol (DTT), 1% Igepal and Mini Complete protease inhibitor cocktail as instructed by the manufacturer (Roche). Protein lysates (50 μg) were fractionated by 10% sodium dodecyl sulfate–polyacrylamide gel electrophoresis (SDS-PAGE), transferred electrophoretically to a polyvinylidine difluoride (PVDF) membrane, and incubated with anti-NMU1R (1 μg/mL; Alpha Diagnostic International, San Antonio, TX) for 48 hours at 4° C using standard Western blot procedures. The negative control was HL-60 cell lysates and the positive control was peripheral leukocytes from a healthy donor.
Intracellular Ca++ flux
K562 cells (1 × 10⁷) in log-phase growth were resuspended in 1 mL prewarmed Hanks balanced saline solution (HBSS; 25 mM HEPES, pH 7.4, 2.4 mM CaCl2, 1.3 mM MgSO4, 10 mM glucose, 124 mM NaCl, 5 mM KCl, and 1.24 mM KH2PO4) and labeled with a mixture containing 3 μM Indo-1, am (Molecular Probes) and 4 mM probenecid for 30 minutes at 37° C in the dark. The cells were then washed 4 times with HBSS and resuspended in fresh HBSS. Intracellular Ca++ flux of viable, Indo-1–labeled K562 cells (1 × 10⁶ cells/mL) was measured following the addition of 300 μM NmU using a fixed alignment, 6-color, 3-laser LSR flow cytometer (Becton Dickinson). The data acquired by the LSR flow cytometer were analyzed using FlowJo software version 2.7.8. Because FL4 (397-417 nm) detects Ca++ bound to Indo-1 and FL5 (480-500 nm) detects free Ca++, the data are presented as the ratio of FL5/FL4 as a function of time. Ionomycin (1 mg/mL; Sigma-Aldrich, St Louis, MO), a calcium-specific ionophore, was added to the Indo-1–labeled K562 cells following the addition of the agonist to ensure that the K562 cells were adequately labeled with Indo-1.
Statistical analyses
The Student t test was used to evaluate differences in cell number in the absence and presence of NmU or tamoxifen. P < .05 was considered significant.
Results
The effect of MERT on cell growth and cell cycle progression in transduced K562 cells
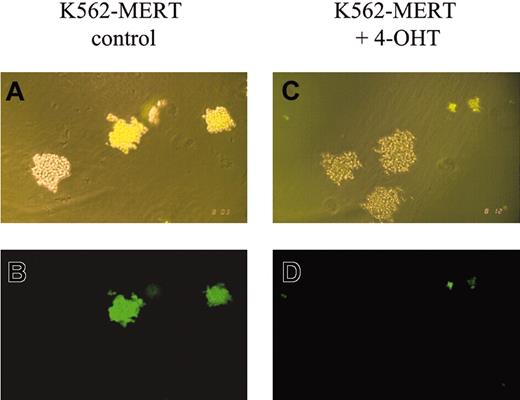
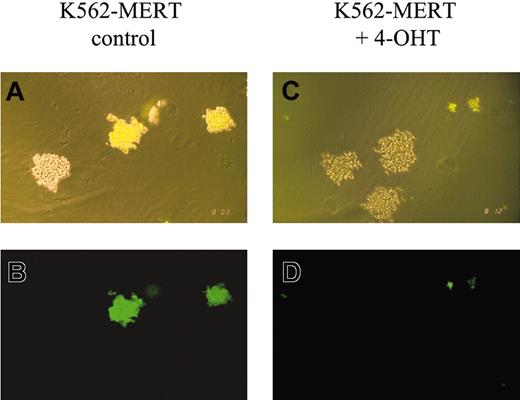
Methylcellulose colony-forming assays using K562-MERT cells in the absence and presence of tamoxifen revealed marked differences. In the absence of tamoxifen, GFP+ colonies of K562-MERT and untransduced K562 cells were comparable in size (Figure 1A-B). However, in the presence of tamoxifen the GFP+ colonies of K562-MERT cells appeared smaller than those K562 cells that do not express MERT (Figure 1C-D). FACS analysis of K562-MERT cells in the absence and presence of tamoxifen revealed a 10-fold decrease in GFP-expressing K562-MERT cells, whereas the percent of GFP+ K562 cells transduced with MIGR1 did not change between untreated and tamoxifen-treated cells (data not shown). Taken together, these data suggest that the small GFP+ colonies of K562-MERT cells in methylcellulose cultures are due to the inhibition of Myb activity by MERT in tamoxifen-treated K562-MERT cells.
K562-MERT colonies are smaller in the presence of tamoxifen. A mixture of K562 and K562-MERT cells were cultured in methylcellulose in the absence (A-B) and presence (C-D) of 1 μM tamoxifen. After 14 days, the resulting colonies were examined by phase (A,C) and fluorescent (B,D) microscopy using an Olympus IMT-2 microscope (Olympus, Melville, NY), 100 × magnification, 10 ×/0.25 objective lens, 10 × ocular lens, and an Olympus C-35AD-4 camera. The bright and dim colonies in panels A and C contain K562-MERT and K562 cells, respectively.
K562-MERT colonies are smaller in the presence of tamoxifen. A mixture of K562 and K562-MERT cells were cultured in methylcellulose in the absence (A-B) and presence (C-D) of 1 μM tamoxifen. After 14 days, the resulting colonies were examined by phase (A,C) and fluorescent (B,D) microscopy using an Olympus IMT-2 microscope (Olympus, Melville, NY), 100 × magnification, 10 ×/0.25 objective lens, 10 × ocular lens, and an Olympus C-35AD-4 camera. The bright and dim colonies in panels A and C contain K562-MERT and K562 cells, respectively.
Based on these observations, we hypothesized that K562-MERT cells were undergoing cell cycle arrest or apoptosis (or both) in the presence of tamoxifen. In untreated and tamoxifen-treated K562 cells, no change in cell cycle progression was observed (Figure 2A-B). However, K562-MERT cells treated with tamoxifen for 3 days arrested at the G1/S transition of the cell cycle compared to the untreated K562-MERT cells, demonstrating that endogenous Myb activity in these cells was abrogated by MERT in the presence of tamoxifen (Figure 2C-D). To determine whether the small GFP+ colonies of K562-MERT cells (Figure 1D) in the presence of tamoxifen were the result of cells undergoing apoptosis, we measured the expression of annexin V. There was no change in annexin V expression in untreated and tamoxifen-treated K562 and K562-MERT cells (data not shown). Taken together, these data indicate that the small size of GFP+ K562-MERT colonies in the tamoxifen-treated methylcellulose cultures is most reasonably attributed to impaired cell proliferation and not apoptotic cell death.
K562-MERT cells arrest in the G1/S phase of the cell cycle when Myb activity is inhibited. K562 (A-B) and K562-MERT (C-D) cells were cultured for 72 hours in the absence and presence of 1 μM tamoxifen. The DNA content in the PI-stained cells was measured by flow cytometry and analyzed by ModFitLT Mac V3 software. The first shaded peak is the G0/G1 phase and the second shaded peak is the G2/M phase of the cell cycle. The hatched area between the 2 peaks is the S phase of the cell cycle. The insert contains the percentages of the total cell population in each phase of the cell cycle.
K562-MERT cells arrest in the G1/S phase of the cell cycle when Myb activity is inhibited. K562 (A-B) and K562-MERT (C-D) cells were cultured for 72 hours in the absence and presence of 1 μM tamoxifen. The DNA content in the PI-stained cells was measured by flow cytometry and analyzed by ModFitLT Mac V3 software. The first shaded peak is the G0/G1 phase and the second shaded peak is the G2/M phase of the cell cycle. The hatched area between the 2 peaks is the S phase of the cell cycle. The insert contains the percentages of the total cell population in each phase of the cell cycle.
Microarray analysis of gene expression in tamoxifen-treated K562-MERT cells
When c-Myb activity was suppressed by MERT in our model system, only 37 of 10 000 arrayed genes increased their expression more than 2-fold. These genes included hemoglobin, transferrin, and platelet glycoprotein IIIa (Table 1). These genes have been reported to be associated with differentiating cells, which is consistent with the fact that expression of c-Myb decreases when hematopoietic cells progress toward terminal differentiation. Conversely, the expression of 68 genes decreased more than 2-fold when Myb activity was inhibited by tamoxifen in K562-MERT cells. Among the most repressed in gene expression were NmU, cdc7, and H3 histone (Table 1). These genes are, for the most part, associated with cell cycle progression and proliferation, which is also consistent with what is known of the role of c-Myb in hematopoietic cell development. Given that overexpression of c-Myb has been associated with human leukemias,33 we reasoned that Myb-regulated genes involved in leukemogenesis would most likely decrease when Myb activity was inhibited. Therefore, we focused our analysis on those genes that decreased in expression following tamoxifen treatment of K562-MERT cells. Of the down-regulated genes, NmU was of particular interest because its expression changed the most (4.9-fold decrease) and it has been reported to be present in bone marrow.42
Quantitative real-time PCR analyses of c-Myb, NmU, GAPDH, and 18S RNA expression in K562 cell lines and primary cells from patient and healthy donors
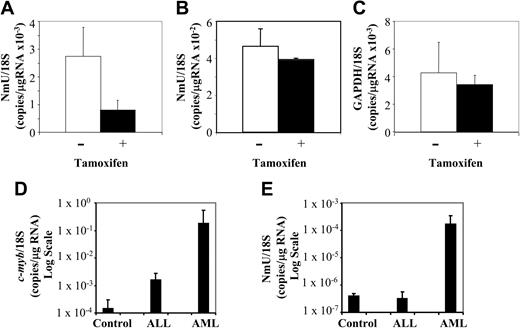
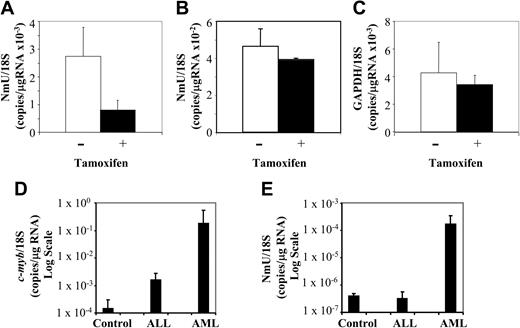
To confirm the microarray data, the expression level of candidate Myb gene targets was determined in transduced and untransduced K562 cells using quantitative real-time PCR after culturing them in the absence and presence of tamoxifen for 3 days. Relative to the untreated K562-MERT cells, NmU expression was decreased 2.8-fold in tamoxifen-treated cells (Figure 3A), a result consistent with the microarray data (Table 1). The expression of cdc7 (a previously unidentified Myb gene target) in K562-MERT cells was quantitated by real-time PCR and found to decrease 5-fold when Myb was inactivated (data not shown), a result that was also consistent with the microarray data (Table 1). As a control, NmU expression in K562 cells and GAPDH expression in K562-MERT cells were measured by real-time PCR in the absence and presence of tamoxifen. No significant change in the number of NmU copies in K562 cells was observed between the untreated and tamoxifen-treated cells (Figure 3B), indicating that tamoxifen alone does not induce NmU gene expression. As observed in the microarray experiment, there was no change in the number of GAPDH copies in untreated and tamoxifen-treated K562-MERT cells (Figure 3C).
NmU expression is decreased in tamoxifen-treated K562-MERT cells and is elevated in primary AML cells. Quantitative real-time PCR was used to quantitate the expression of NmU in K562-MERT (A) and K562 (B) cells and quantitate GAPDH expression in K562-MERT cells (C) that were untreated (□) and treated with tamoxifen (▪) for 72 hours. The levels of c-myb (D) and NmU (E) expressed in controls (n = 6) and patients with ALL (n = 7) and AML (n = 7) were also determined by quantitative real-time PCR. Total RNA was extracted from each sample, reverse transcribed, and amplified using gene specific primers and TaqMan probes as detailed in “Materials and methods.” Real-time PCR was performed in triplicate for each cell line and subject, and the expression of each gene was normalized to 18S RNA. The results are presented as the mean ratio of the number of NmU (A-B,E), GAPDH (C), and c-myb (D) copies to the number of 18S copies/μg RNA. Error bars indicate standard deviation (n = 3).
NmU expression is decreased in tamoxifen-treated K562-MERT cells and is elevated in primary AML cells. Quantitative real-time PCR was used to quantitate the expression of NmU in K562-MERT (A) and K562 (B) cells and quantitate GAPDH expression in K562-MERT cells (C) that were untreated (□) and treated with tamoxifen (▪) for 72 hours. The levels of c-myb (D) and NmU (E) expressed in controls (n = 6) and patients with ALL (n = 7) and AML (n = 7) were also determined by quantitative real-time PCR. Total RNA was extracted from each sample, reverse transcribed, and amplified using gene specific primers and TaqMan probes as detailed in “Materials and methods.” Real-time PCR was performed in triplicate for each cell line and subject, and the expression of each gene was normalized to 18S RNA. The results are presented as the mean ratio of the number of NmU (A-B,E), GAPDH (C), and c-myb (D) copies to the number of 18S copies/μg RNA. Error bars indicate standard deviation (n = 3).
We then examined primary cells from healthy donors and patients with either ALL or AML for the expression of c-myb and NmU by quantitative real-time PCR. The mean expression of human c-myb normalized to 18S RNA in controls and in patients with ALL or AML was 1.48 × 10⁻⁴ copies/μg RNA, 1.57 × 10⁻³ copies/μg RNA, and 1.76 × 10⁻¹ copies/μg RNA, respectively (Figure 3D). When compared to healthy donors, this represents a 10.6-fold increase in c-myb expression in ALL cells, and a remarkable 1190-fold increase in AML patients. NmU expression in the leukemia specimens appeared to parallel c-myb expression. When normalized to 18S RNA, NmU expression in healthy donors and in patients with ALL was found to be 3.97 × 10⁻⁷ and 3.10 × 10⁻⁷ copies/μg RNA, respectively, a difference that was not statistically different. In contrast, NmU was found to be present at 1.64 × 10⁻⁴ copies/μg RNA in AML patients, a 413-fold increase in comparison to healthy donors or ALL patients (Figure 3E). One explanation for these results may be a “dose phenomenon,” such that induction of NmU expression requires very high levels of c-myb expression. Alternatively, we cannot exclude that other, myeloid tissue-specific factors, may also play a role in the Myb regulation of NmU expression.
Proliferation of NmU-treated K562-MERT and primary AML cells
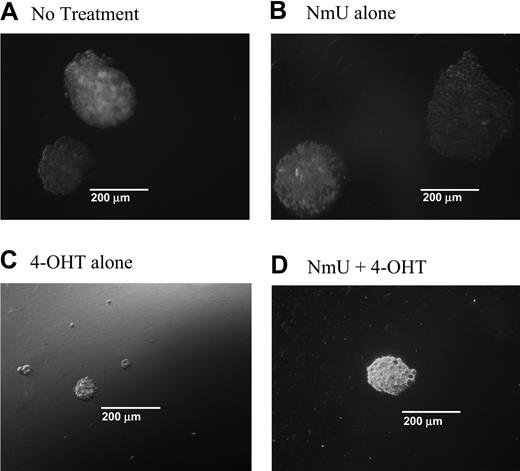
When NmU is expressed in cells, it is processed into a 25–amino acid peptide that is secreted from the cell41 and binds to NMU1R.46 Based on our observations, we reasoned that one function of NmU in hematopoietic cells might be to promote proliferation. To test this hypothesis, we first examined the colony-forming ability of K562-MERT cells in methylcellulose cultures in the absence and presence of NmU or tamoxifen (or both) and then determined the ability of NmU to stimulate the growth of primary AML cells. In the first set of experiments, K562-MERT cells were cultured in methylcellulose in the absence or presence of NmU (Figure 4A-B). We observed relatively no change in the number of K562-MERT colonies between untreated and NmU-treated cultures (Table 2). However, we did observe an increase in the total area of each K562-MERT colony in the NmU-treated methylcellulose cultures compared to untreated cells (Figure 4A-B). The mean area of the K562-MERT colonies in untreated cultures (Figure 4A) or cultures treated with only NmU (Figure 4B) was 0.358 × 105 μm2 and 1.3 × 105 μm2, respectively. To further demonstrate that the larger size of the K562-MERT colonies in the NmU-treated cultures compared to untreated cultures was due to a greater number of cells in the colonies, we solubilized the methylcellulose cultures and counted the individual cells. Untreated K562-MERT cells yielded 1.70 ± 0.223 × 10⁵ cells/mL, whereas K562-MERT cells cultured with only NmU yielded 5.21 ± 0.303 × 10⁵ cells/mL, which is a 3.0-fold increase in cell number between untreated and NmU-treated K562-MERT cells (P < .0004; Table 2). A similar increase in colony area and cell number was observed with K562 cells that were cultured only with NmU compared to untreated cells (data not shown).
NmU stimulates proliferation in K562-MERT cells. K562-MERT cells were cultured in methylcellulose with GM-CSF and IL-3 (A). In addition, some of the cultures received either 35 mM NmU (B), or 1 mM 4-OHT (C), or both 35 mM NmU and 1 mM 4-OHT (D). Colonies consisting of 20 or more cells were manually counted on day 14 using an Olympus IX 70 microscope at 100 × magnification using a 10 ×/0.3 objective and 10 × ocular and a CoolSnap HQ camera (Photometrics, Tucson, AZ). Representative colonies from 8 independent experiments are shown for each treatment at the same magnification.
NmU stimulates proliferation in K562-MERT cells. K562-MERT cells were cultured in methylcellulose with GM-CSF and IL-3 (A). In addition, some of the cultures received either 35 mM NmU (B), or 1 mM 4-OHT (C), or both 35 mM NmU and 1 mM 4-OHT (D). Colonies consisting of 20 or more cells were manually counted on day 14 using an Olympus IX 70 microscope at 100 × magnification using a 10 ×/0.3 objective and 10 × ocular and a CoolSnap HQ camera (Photometrics, Tucson, AZ). Representative colonies from 8 independent experiments are shown for each treatment at the same magnification.
In the second set of experiments, we cultured K562-MERT cells in methylcellulose with tamoxifen to inhibit endogenous Myb activity and therefore inhibit NmU expression (Figure 4C-D). To overcome the Myb-mediated blockade of NmU expression, we supplemented one of the tamoxifen methylcellulose cultures with NmU (Figure 4D). Tamoxifen-treated K562-MERT cells yield colonies that were smaller in size than those observed in the absence of tamoxifen (Figure 4A) or in the presence of NmU (Figure 4B-D). The mean colony area of the K562-MERT colonies in methylcellulose cultured with tamoxifen was determined to be 0.159 × 105 μm2 and the cell number was calculated to be 0.443 ± 0.138 × 10⁵ (Table 2). Culturing K562-MERT cells with both NmU and tamoxifen resulted in a 3.9-fold increase in the mean colony area and a 2.4-fold increase in cell number (P < .02) compared to K562-MERT cells cultured with tamoxifen alone. The mean colony area of K562-MERT colonies cultured with NmU and tamoxifen was 0.625 × 105 μm2 and the cell number was 1.06 ± 0.597 × 10⁵ cells/mL (Table 2). K562 cells cultured in methylcellulose with tamoxifen revealed no difference in the colony area or cell number compared to untreated K562 cells (data not shown).
In the third set of experiments, primary cells from 4 patients with AML were cultured in the absence or presence of NmU. In 3 of 4 clinical samples tested, the addition of NmU to patient cell cultures resulted in a variable but statistically significant increase in cell proliferation compared to cells cultured in the absence of NmU (Table 3). These data are consistent with the hypothesis that NmU promotes the growth of human myeloid leukemia cells.
Silencing NmU gene expression inhibits proliferation of human myeloid leukemia cells
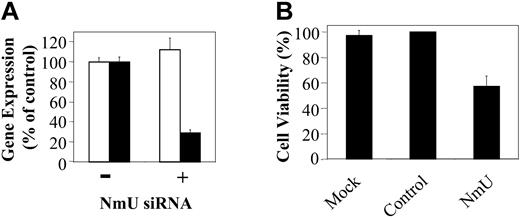
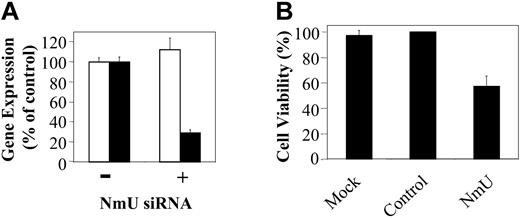
To provide additional support for the hypothesis that NmU functions as an autocrine growth factor in myeloid leukemias we sought to silence NmU expression in K562 cells using siRNA. NmU and control siRNA were synthesized and delivered to cells by nucleofection as detailed in “Materials and methods.” At 24 hours after nucleofection of NmU-targeted siRNA, NmU expression in K562 cells was inhibited about 70%, as measured by quantitative real-time PCR, when compared to mock nucleofected cells (Figure 5A). The expression of 18S RNA was unchanged when measured at the same time point suggesting specificity of the “knock down.” When compared to mock or control siRNA-treated cells, viability of K562 cells nucleofected with NmU siRNA decreased about 40% (P < .006; Figure 5B). Taken together, these results are consistent with the hypothesis that NmU supports leukemic cell proliferation.
Silencing of NmU gene expression inhibits proliferation of human myeloid leukemia cells. (A) Total RNA from K562 cells nucleofected in the absence (–) and presence (+) of siRNA was isolated 24 hours after nucleofection, reverse transcribed, and amplified in triplicate using 18S RNA (□) or NmU (▪) primers and their corresponding TaqMan probes as described in “Materials and methods.” (B) Percent cell viability of K562 cells that were mock nucleofected, or nucleofected with control siRNA (Dharmacon), or NmU siRNA was determined by trypan blue exclusion 24 hours after nucleofection. Error bars indicate standard deviation.
Silencing of NmU gene expression inhibits proliferation of human myeloid leukemia cells. (A) Total RNA from K562 cells nucleofected in the absence (–) and presence (+) of siRNA was isolated 24 hours after nucleofection, reverse transcribed, and amplified in triplicate using 18S RNA (□) or NmU (▪) primers and their corresponding TaqMan probes as described in “Materials and methods.” (B) Percent cell viability of K562 cells that were mock nucleofected, or nucleofected with control siRNA (Dharmacon), or NmU siRNA was determined by trypan blue exclusion 24 hours after nucleofection. Error bars indicate standard deviation.
Expression of NMU1R in myeloid and lymphoid cells
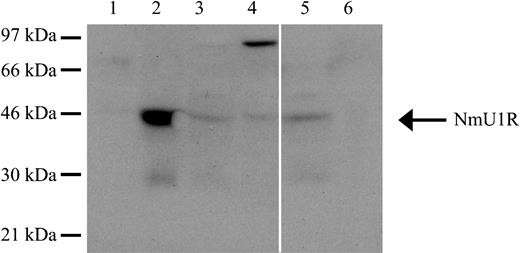
To be certain that the effects of NmU observed on leukemic cell growth were in fact due to engagement of NMU1R, we sought to demonstrate its presence in cells in which a biologic effect was, or was not, observed.46 To determine the presence of NMU1R in cell lysates of K562, K562-MERT, and patients with AML or ALL, we performed Western blot analyses. Both K562 and K562-MERT cells express NMU1R (44-kDa; Figure 6 lanes 3 and 4). In addition, K562-MERT cells appear to express a dimer form of the receptor (Figure 6 lane 4). Analyses of cell lysates from patients with AML and ALL revealed the presence of the NMU1R only in the AML sample (Figure 6 lanes 5 and 6). Taken together, these results suggest that NMU1R expression is specific to myeloid leukemia cells.
The NmU receptor is expressed in human myeloid cells. The expression of the NMU1R was determined by Western blot analysis. Total protein (50 μg) from HL-60 cells (lane 1), peripheral blood mononuclear cells from a healthy donor (lane 2), K562 cells (lane 3), K562-MERT cells (lane 4), pheresis from a representative AML patient (lane 5), and peripheral blood from a representative ALL patient (lane 6) were fractionated by 10% SDS-PAGE, transferred to a PVDF membrane, and probed with anti-NMU1R. Along the left edge is the position of the protein standards and the arrow points to NMU1R. The solid white line between lanes 4 and 5 denotes the removal of irrelevant sample lanes from the same blot. The blot shown is representative of 3 individual determinations.
The NmU receptor is expressed in human myeloid cells. The expression of the NMU1R was determined by Western blot analysis. Total protein (50 μg) from HL-60 cells (lane 1), peripheral blood mononuclear cells from a healthy donor (lane 2), K562 cells (lane 3), K562-MERT cells (lane 4), pheresis from a representative AML patient (lane 5), and peripheral blood from a representative ALL patient (lane 6) were fractionated by 10% SDS-PAGE, transferred to a PVDF membrane, and probed with anti-NMU1R. Along the left edge is the position of the protein standards and the arrow points to NMU1R. The solid white line between lanes 4 and 5 denotes the removal of irrelevant sample lanes from the same blot. The blot shown is representative of 3 individual determinations.
Intracellular Ca++ flux of NmU-treated K562 cells
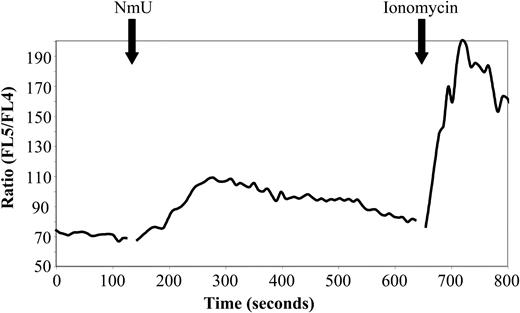
Biologically active NmU has been reported to bind specifically to NMU1R transiently expressed in CHO, HEK-293, and COS-7 cells and cause an increase in intracellular Ca++ levels.42,47,48 We therefore determined the ability of NmU to induce intracellular Ca++ flux in K562 cells. A maximum Ca++ flux of Indo-1–labeled K562 cells was observed at 167 ± 15 seconds after adding 300 μM NmU (Figure 7), demonstrating that K562 cells express functional NMU1R. Sequential addition of first NmU and then thrombin, a known stimulator of intracellular Ca++ flux in K562 cells,49 resulted in an intracellular Ca++ flux following the addition of NmU but not with thrombin (data not shown), suggesting that NmU and thrombin induce Ca++ flux in hematopoietic cells through the same pathway.
Biologically active NmU induces intracellular Ca++flux in K562 cells. The time course of the intracellular Ca++ flux response to the NmU peptide was performed as described in “Materials and methods.” The solid black arrows indicate the addition of NmU or ionomycin to Indo-1–labeled K562 cells. The results are representative of 5 independent experiments.
Biologically active NmU induces intracellular Ca++flux in K562 cells. The time course of the intracellular Ca++ flux response to the NmU peptide was performed as described in “Materials and methods.” The solid black arrows indicate the addition of NmU or ionomycin to Indo-1–labeled K562 cells. The results are representative of 5 independent experiments.
Discussion
c-Myb is a nuclear transcription factor required for hematopoiesis and has been postulated to play a role in leukemogenesis. However, the mechanism responsible for transforming hematopoietic cells remains unclear. We have previously reported that leukemic cells are more sensitive to antisense c-myb oligodeoxynucleotides than normal hematopoietic cells,35 suggesting that Myb-regulated genes might play a key role in maintaining the leukemic state. Similar results have been obtained using a monoclonal antibody to c-Myb.50 To better understand the role of Myb in leukemogenesis, we sought to identify Myb-regulated genes in human myeloid leukemia cells that were engineered to express a dominant-negative Myb protein, MERT. Using a microarray strategy, we identified a potentially novel Myb gene target, NmU, by virtue of the degree of change in its expression. Validation of this result was obtained by quantitative real-time PCR studies, which revealed a dramatic increase in the level of NmU expressed in primary blood cells from patients with AML (Figure 3E).
Biologically active NmU is a 25-amino acid peptide that is expressed in such tissues as intestine, brain, and bone marrow.42 It has a myriad of activities including the ability to stimulate smooth muscle contraction,51 local blood flow and ion transport in the intestine,52-54 adrenocortical function,55 and blood pressure.41 NmU is also involved in the central control of appetite.56 Our findings suggesting that NmU is a Myb-regulated gene in myeloid leukemia cells prompted us to investigate the biologic significance of this expression.
Because c-myb has significant effects on cell proliferation, we first examined the effect of NmU on cell growth. We found that the addition of NmU to K562 cells expressing MERT stimulated the growth of cell clusters that contained about 3-fold more cells than those cultured in the absence of NmU (Figure 4; Table 2). Unfortunately, we were unsuccessful in culturing leukemic colony-forming units. However, when NmU was added to suspension cultures of primary AML cells, cell proliferation was increased compared to growth of cells in the absence of NmU, in 3 of 4 patient samples evaluated (Table 3). Further, when endogenous NmU expression was inhibited in myeloid leukemia cells by NmU siRNA, there was a statistically significant (P < .006) approximate 2-fold decrease in cell viability 24 hours after treatment compared to untreated cells (Figure 5). Taken together, these data support the hypothesis that NmU stimulates myeloid leukemia cell proliferation and suggest that NmU, and its cognate receptor, NMU1R, may be added to the list of autocrine growth loops that have been defined in leukemia cells, including the single-chain polypeptide type-1 insulin-like growth factor (IGF-1) and its receptor.57
The precise mechanism whereby NmU stimulates cell growth is not entirely clear but is likely accomplished by rescuing cells from the block in cell cycle progression caused by Myb inactivation. This might ultimately be affected through events triggered by the intracellular Ca++ flux we measured when cells were exposed to NmU. We note that when CHO, HEK-293, and COS-7 cells transiently expressing NMU1R are treated with NmU, an increase in intracellular Ca++ flux is observed, as well as an increase in total inositol phosphate levels,42,47,48 indicating the NmU induces intracellular events via G protein-coupled receptor signaling. Signal transduction through G protein-coupled receptors has been reported to activate a number of intracellular pathways such as the RAS/MAPK pathway that leads to proliferation and the activation of phosphoinositol-3 kinase58 that leads to cell migration.59
Finally, the chain of events that link Myb and NmU expression remains to be elucidated. We have noted that there are 3 potential Myb-binding sites upstream of the putative transcriptional start site of human NmU suggesting that Myb could directly regulate NmU gene expression but this is not proven, and other intermediate steps are certainly possible. Studies to define the NmU promoter and investigate the direct or indirect interaction of Myb with this promoter are currently underway. In addition, whereas a certain threshold of Myb expression might be required for induction of NmU, other factors, likely tissue specific, could certainly play a role. For example, c-Myb is another Myb-regulated gene whose expression is complex. Murine myeloid leukemia cells manifest a decrease in c-myc expression when they express a dominant-negative Myb, along with a cell cycle arrest and an increase in apoptosis.10 However, in a murine erythroleukemia cell line, a dominant-negative Myb blocked differentiation, but had no effect on proliferation or c-myc expression.38 In T cells, a dominant-negative Myb augmented apoptosis but had no effect on c-myc expression.20
In summary then, using K562 cells transduced with an inducible dominant-negative Myb, we have been able to identify a previously unknown Myb-regulated autocrine growth loop of potential physiologic significance in myeloid leukemia cells. The loop consists of a small peptide, NmU, and its cognate receptor NMU1R. Experiments were conducted that suggest that this loop is functional in myeloid leukemia cells but a number of questions concerning the mechanism of NmU regulation and its mechanism of action in hematopoietic cells remain to be determined. Answering these questions will help elucidate the function of NmU in hematopoiesis and will help determine the ultimate value of NmU as a therapeutic target in acute leukemia.
Prepublished online as Blood First Edition Paper, June 8, 2004; DOI 10.1182/blood-2003-10-3577.
Supported by National Institutes of Health grant CA75330 (J.K.C.) and the Doris Duke Charitable Foundation (A.M.G.). A.M.G. is a Doris Duke Distinguished Clinical Scientist.
The publication costs of this article were defrayed in part by page charge payment. Therefore, and solely to indicate this fact, this article is hereby marked “advertisement” in accordance with 18 U.S.C. section 1734.
The authors would like to thank Dr Warren Pear for generously providing the MIGR1 vector. We also thank Dr Tami Bach for assistance with the Ca++ flux experiments. We especially thank Dr Linda Wolff and Dr Martin Carroll for helpful advice and discussion during this study.

