Abstract
In a human melanoma model of tumor antigen (TA)–based immunization, we tested the functional status of TA-specific CD8+ cytotoxic T lymphocytes. A “quiescent” phenotype lacking direct ex vivo cytotoxic and proliferative potential was identified that was further characterized by comparing its transcriptional profile to that of TA-specific T cells sensitized in vitro by exposure to the same TA and the T-cell growth factor interleukin 2 (IL-2). Quiescent circulating tumor-specific CD8+ T cells were deficient in expression of genes associated with T-cell activation, proliferation, and effector function. This quiescent status may explain the observed lack of correlation between the presence of circulating immunization-induced lymphocytes and tumor regression. In addition, the activation of TA-specific T cells by in vitro antigen recall and IL-2 suggests that a complete effector phenotype might be reinstated in vivo to fulfill the potential of anticancer vaccine protocols.
Introduction
The coexistence in patients with cancer of tumor and tumor-specific circulating CD8+ T cells remains unexplained,1,2 particularly in the context of tumor antigen (TA)–specific immunization that consistently induces TA-specific immune responses rarely associated with tumor regression.3-6 This discrepancy could be due to a progressive escape of tumor cells from T-cell recognition as a result of immune editing.7 However, we and others postulated that in humans the primary reason for the lack of tumor immune responsiveness is ineffectual T-cell function, whereas tumor escape mechanisms likely play a role only in adaptation to those rare cases of successful immune rejection.1,2
Some investigators attributed a status of “unresponsiveness” to circulating TA-specific T cells.8 Others, however, reported that at least a subset of circulating TA-specific T cells can exert tumor-specific cytolytic activity ex vivo.9 In addition, total T-cell anergy does not apply to immunization-induced T cells because they express markers of T-cell activation10 and respond to relevant antigen stimulation with interferon γ (IFN-γ) secretion.11-13 Cytokine production, however, may not comprehensively portray the globality of cytotoxic T-cell functions14 and other parameters could more comprehensively characterize T cells.10,15-21 For instance, Speiser et al22 noted that immunization-induced circulating T cells lack effector features displayed by virus-specific T cells. In addition, in a previous study we were impressed by the low levels of perforin constitutively expressed.18
The poor correlation observed in melanoma between frequency of circulating TA-specific T cells and clinical effectiveness is not shared by other diseases. During acute viral infection, expansion of pathogen-specific CD8+ T cells is paralleled by resolution of the infectious process.23 During chronic viral infections, the CD8+ T-cell phenotype may vary greatly according to the pathogen,21 but, at least in some circumstances, the frequency of pathogen-specific T cells parallels disease clearance. In immunocompromised conditions, reduction in antigen-specific T cells is associated with revival of infection and insurgence of virally driven neoplastic disorders controlled by reversal of immune suppression or adoptive transfer of virus-specific CD8+ T cells.24,.25 Persistence of human T-lymphotropic virus type 1 (HTLV-1) infection drives a continuous expansion of HTLV-1–specific CD8+ T cells that can induce HTLV-1–associated myelopathy (HAM).26 In this disease, the number of circulating HTLV-1–specific CD8+ T cells predicts the severity of HAM, suggesting that the virally driven immune response is directly responsible for the autoimmune effects.27 Interestingly, the HTLV-1–specific CD8+ T cells from patients with HAM display a classic effector T-cell phenotype and can spontaneously proliferate28 and be cytotoxic ex vivo.29
In this study, functional and genetic profiling of immunization-induced CD8+ T cells identified a quiescent effector phenotype with lack of proliferative and cytotoxic activity ex vivo that corresponded to strongly reduced expression of genes associated with T-cell activation, proliferation, and effector function.
Materials and methods
Patients expressing HLA-A*0201 with melanoma received repeated subcutaneous injections of 209-2M peptide in incomplete Freund adjuvant in a protocol approved by the Institutional Review Board (National Cancer Institute, Bethesda, MD). This peptide includes an anchor residue modification from the wild-type glycoprotein (gp) gp100/PMel17 epitope gp100:209-217 resulting in increased binding affinity to HLA-A*0201 and enhanced immunogenicity in vitro30 and in vivo.31 Peripheral blood mononuclear cells (PBMCs) were obtained 3 weeks after immunization. Three patients expressing HLA-A*0201 infected with HTLV-1, suffering active HAM and with high Tax-specific T-cell precursor frequencies, were also studied. The HLA class I phenotype of patients was determined by sequence-specific primer-polymerase chain reaction (PCR). PBMCs from 6 of 35 patients with melanoma were selected on the basis of T-cell precursor frequency likely to yield sufficient material for genomic analysis. Although fluorescence-activated cell sorting (FACS) of tetrameric HLA/epitope complexes (tHLA+) cells yielded higher purity, RNA extraction was inefficient compared to magnetic beads-based enrichment that, through a rapid separation process, minimizes mRNA degradation or metabolism. Contaminant mRNA from tHLA– T cells dilutes the concentration of genes specifically expressed by tHLA+ cells and can partially decrease the sensitivity but cannot affect the specificity of the results. After enrichment, antisense RNA (aRNA) was prepared,32 tested for quantity and quality, and, when adequate, hybridized to cDNA microarrays. With this strategy we could study 3 tHLA+ and tHLA– samples from patients with melanoma and 3 from patients with HAM, and most samples that had undergone in vitro sensitization (IVS).
Peptides
The gp100:209-217 (210M) (IMDQVPFSV, 209-2M) and the HTLV Tax:11-19 (LLFGYPVYV) peptides were commercially synthesized by Princeton Biomolecules (Columbus, OH). The peptides were purified by gel filtration to more than 95% purity and their identity was confirmed by mass spectral analysis.
Cells and culture conditions
PBMCs were obtained by leukapheresis, isolated by Ficoll gradient separation, and frozen. Analysis of PBMC or IVS cultures was performed after overnight resting of thawed PBMCs in complete medium (CM) consisting of Iscove medium (Biofluids, Rockville, MD) supplemented with 10 mM HEPES (N-2-hydroxyethylpiperazine-N′-2-ethanesulfonic acid) buffer, 100 U/mL penicillin-streptomycin (Biofluids), 10 μg/mL ciprofloxacin (Bayer, West Haven, CT), 0.03% l-glutamine (Biofluids), 0.5 mg/mL amphotericin B (Biofluids), and 10% heat-inactivated human AB serum (Gemini Bioproducts, Calabasas, CA). IVS consisted of stimulation with 1 μM 209-2M followed by a 10-day period in medium containing interleukin 2 (IL-2; 300 IU/mL).
T-cell staining
Phycoerythrin (PE)–conjugated tetrameric HLA-A*0201 complexes (tHLA) were purchased from Beckman Coulter (San Diego, CA). The following monoclonal antibodies (mAbs) were used: PE-conjugated anti-CD27 mAb (PharMingen, San Diego, CA), fluorescein isothiocyanate (FITC)–conjugated anti-CD45RA (Caltag Laboratories, Burlingame, CA), peridinin chlorophyll protein (PerCP) anti-CD8 mAb (Becton Dickinson, Palo Alto, CA), FITC anti-CD11a mAb (PharMingen), FITC anti-CD2 mAb (PharMingen), and kit for the perforin and granzyme A intracellular staining (PharMingen). Cells were stained and analyzed by FACS.33 Gating was performed according to lymphocyte size and tetramer staining. T-cell precursor frequency (Tc-pf) was calculated as percentage of tHLA staining CD8+ T cells/100 CD8+ T cells.
AutoMACS separation
All procedures were performed at room temperature to prevent RNA metabolism/degradation. CD8+ T cells were isolated by negative separation (Miltenyi Biotec, Bergisch Gladbach, Germany) stained with tHLA-PE, incubated with the anti-PE antibody-coated magnetic beads, and isolated with an AutoMACS (Miltenyi Biotec). Eluted tHLA– CD8+ T cells were collected separately and processed for RNA extraction. T-cell subsets used as control (CD8+ subsets, CD4+, natural killer [NK] cells) were prepared using the appropriate negative selection kits (Miltenyi Biotec). We previously showed that handling of T cells at or below room temperature leaves unaltered their functional profile.11,34,35 The purity of the enrichment of the tetramer-positive CD8+ T cells is shown in Figure 3B. Tetramer-negative CD8+ T-cell populations after separation were highly pure with more than 95% purity in all cases (data not shown). Therefore, genes identified as overexpressed in tetramer-positive T cells compared with tetramer-negative T cells could only be specifically expressed by the former and not by contaminating tetramer-negative T cells in the preparation.
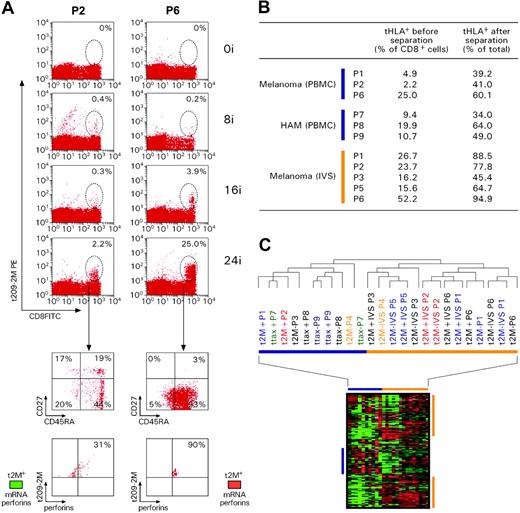
Transcriptional differences between circulating and IVS CD8+ T cells. (A) Kinetics of response to repeated subcutaneous immunizations with 209-2M. PBMCs obtained before treatment and 3 weeks after 8, 16, and 24 immunizations were simultaneously thawed and tested. Staining was performed with FITC-conjugated anti-CD8 mAb and PE-labeled tHLA/209-2M. In each experiment 200 000 events were analyzed per sample. The first column shows patient 2 (P2) as representative of most patients; the second column portrays the unusual case of patient 6 (P6). T-cell precursor frequency is presented as percent of CD8+ T cells in each histogram. The lower panels show the expression of CD45RA and CD27 or tHLA/209-2M and perforin in the 24i samples from the 2 patients. In addition, the level of perforin mRNA expression is shown in color code (green less than and red more than the average expression of perforin mRNA in pooled PBMCs). (B) Enrichment of 209-2M– or Tax-specific CD8+ T cells from PBMCs or IVS. In all experiments, the purity of tHLA– CD8+ T cells was above 95%. (C) Eisen hierarchical clustering of all samples applied to a data set of 7580 genes allowed by high-stringency filtering (Cy5/Cy3 ratios with at least a 3-fold change, signal intensity > 500 unless the other channel > 3000 in at least 80% of the sample tested). Samples from individual patients are color coded. 2M indicates 209-2M–specific T cells from patients with melanoma; tax, HTLV-1 Tax-specific T cells from patients with HAM; +, tHLA positive; –, tHLA negative. Horizontal bars underline clusters enriched with circulating (blue) and IVS (orange) CD8+ T cells. Blue and orange vertical bars underline functional signatures specific for the 2 respective clusters.
Transcriptional differences between circulating and IVS CD8+ T cells. (A) Kinetics of response to repeated subcutaneous immunizations with 209-2M. PBMCs obtained before treatment and 3 weeks after 8, 16, and 24 immunizations were simultaneously thawed and tested. Staining was performed with FITC-conjugated anti-CD8 mAb and PE-labeled tHLA/209-2M. In each experiment 200 000 events were analyzed per sample. The first column shows patient 2 (P2) as representative of most patients; the second column portrays the unusual case of patient 6 (P6). T-cell precursor frequency is presented as percent of CD8+ T cells in each histogram. The lower panels show the expression of CD45RA and CD27 or tHLA/209-2M and perforin in the 24i samples from the 2 patients. In addition, the level of perforin mRNA expression is shown in color code (green less than and red more than the average expression of perforin mRNA in pooled PBMCs). (B) Enrichment of 209-2M– or Tax-specific CD8+ T cells from PBMCs or IVS. In all experiments, the purity of tHLA– CD8+ T cells was above 95%. (C) Eisen hierarchical clustering of all samples applied to a data set of 7580 genes allowed by high-stringency filtering (Cy5/Cy3 ratios with at least a 3-fold change, signal intensity > 500 unless the other channel > 3000 in at least 80% of the sample tested). Samples from individual patients are color coded. 2M indicates 209-2M–specific T cells from patients with melanoma; tax, HTLV-1 Tax-specific T cells from patients with HAM; +, tHLA positive; –, tHLA negative. Horizontal bars underline clusters enriched with circulating (blue) and IVS (orange) CD8+ T cells. Blue and orange vertical bars underline functional signatures specific for the 2 respective clusters.
T-cell receptor incorporation assay
HmyA2GFP cells were pulsed with 10 μM of each peptide (respectively, gp100 209-2M, tax, or gag) and incubated for 60 minutes at 37° C in a CO2 incubator.
After washing the HmyA2GFP cells twice they were mixed with a cytotoxic T lymphocyte (CTL) or ex vivo PMBC in a round-bottom 96-well culture plate, then centrifuged at 228.48g (1000 rpm) for a few seconds to provide immediate contact of the cells, and incubated for 45 minutes at 37° C. Cells were then stained with tetracycline (TC)–labeled mAb to CD8 (Caltag Laboratories) and PE-conjugated peptide-loaded HLA-A*0201 tetramer. The acquisition of HLA-green fluorescent protein (GFP) by T cells was assessed by flow cytometry.
CFSE proliferation assay
The fluorescent dye 5-(and-6)-carboxyfluorescein diacetate, succinimidyl ester (CFSE; Molecular Probes, Eugene, OR) was used to track cell division. Frozen aliquots of CFSE were thawed and diluted to 1.25 μM in phosphate-buffered saline (PBS). After thawing, 15 to 30 million cryopreserved PBMCs were washed twice in PBS and resuspended in 1 mL PBS. Cells were labeled with CFSE by adding 1 mL of the diluted stock (final working concentration of 0.625 μM) and mixed periodically at room temperature for 7 minutes. Labeling was quenched by adding an equal volume of cold, heat-inactivated human AB (hAB; Gemini Bio-Products, Woodland, CA) serum to each tube for 1 minute. CFSE-labeled cells were washed twice in culture medium and seeded in deep 96-well culture plates (Nunc, Roskilde, Denmark) at 106 cells/well with medium alone, peptide 209-2M alone, IL-2 (300 IU/mL) alone, or in combination IL-2 plus 209-2M, for a final volume of 100 μL. The CD8+ T cells were tested after 7 days of culture.
Cytotoxicity assay
The CTL assay was preformed using Europium (Aldrich Chemical, Milwaukee, WI). Effector cells were incubated with target cells at indicated effector-to-target ratios. Target cells consisted of HLA-A*0201–transfected human B-cell line pulsed with Tax peptide or melanoma 209-2M peptide at a peptide concentration of 500 nM. The percent specific lysis was calculated as (experimental release – spontaneous release)/(maximum release – spontaneous release) × 100. Assays were performed in triplicate.
Transcriptional analysis
Total RNA was transcribed in vitro into aRNA and reverse-transcribed into fluorescence-labeled cDNA for hybridization to a custom made 17 000-gene cDNA-based array.32,36 The amplification methods have been extensively validated before.32,37 RNA from pooled PBMCs from 6 healthy donors was used as reference in all experiments. The 32 × 24 × 23 (17 000 spot) human cDNA microarray was prepared in the Immunogenetics Section of the Department of Transfusion Medicine, Clinical Center, NIH (Bethesda, MD). Clones used for the printing of 17k cDNA array included a combination from a RG_HsKG_031901 7k clone set and 10 000 clones from the RG_Hs_seq_ver_070700 40k clone set (Research Genetics, Huntsville, AL). The cDNA clones include 12 072 uniquely named genes and 875 duplicates of named genes and the remainder consisted of expression sequence tags. Reproducibility of the data set was assessed by a matrix of repeated experiments where aRNA from a standard melanoma cell line was alternatively cohybridized with reference aRNA using a reciprocal labeling strategy as previously described.32 A level of concordance of gene expression 95% or more was met in all experiments. Analysis of array data was based on the Cluster and Treeview programs from the Stanford Genome Analysis Group Software (Stanford, CA). The significance of sample allocation in distinct clusters was confirmed by χ2 analysis (P < .001). In the figures the data are displayed according to the central method of normalization.38 Differential gene expression between circulating CD8 T cells versus IVS samples was analyzed by 2-tailed, unpaired t test without correction for number of samples due to the explorative nature of this study. Paired t test was used to compare genes differentially expressed between tHLA+ and tHLA– CD8+ T cells from the same patient. Significance cut-off points were arbitrarily selected based on realistic expectation given the number of samples.
Results
Proliferative potential of immunization-induced CD8+ T lymphocytes
Repeated vaccination with the HLA-A*0201-associated epitope gp100:209-217 (210M; referred as 209-2M hereafter)39 resulted in an in vivo increase in frequency of vaccine-specific CD8+ T cells.
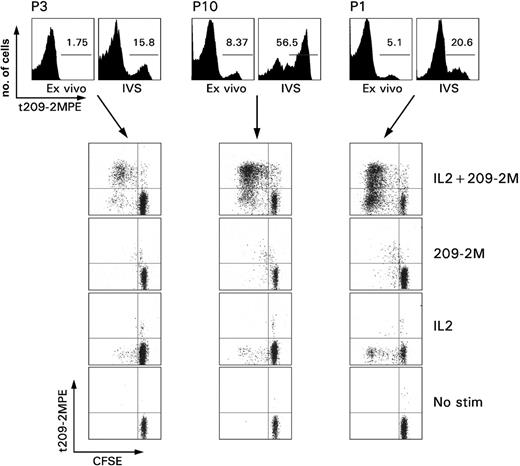
Immunization-induced T cells did not demonstrate direct proliferative capacity ex vivo (Figure 1). This observation is in contrast with the spontaneous ability of Tax-specific T cells to proliferate ex vivo in patients with HAM.28 Reinduction of proliferative potential in immunization-induced CD8+ T cells required exposure to the immunogen (antigen recall) because it could be selectively induced by stimulation with 209-2M in vitro but not with IL-2. IL-2 acted as an antiapoptotic factor by allowing survival in vitro of the TA-specific T cells that could not survive in culture medium alone. Brisk proliferation required both antigen recall and IL-2. Interestingly, a subset of tHLA– CD8+ T cells from patient 1 displayed a partially activated phenotype because they proliferated with IL-2 in the absence of specific antigenic stimulus. This observation could be best explained by hypothesizing that at least a portion of this patient's CD8+ T cells had been exposed to antigenic stimulation just before we obtained the blood sample. This stimulus was not the vaccine 209-2M because the proliferation occurred in tHLA– cells.
Proliferative ability of immunization induced CD8+ T cells. PBMCs from 3 patients with melanoma underwent in vitro sensitization (IVS) with 1 μM 209-2M followed by a 7-day culture in IL-2 (300 IU/mL). The top panel shows the proportional expansion of tHLA+ T cells during IVS. The numbers in the histograms, as gated by the horizontal bars, represent the Tc-pf as percent of tHLA+ over CD8+CD3+ T cells. The rows depict the proliferative capacity of the same samples under usual IVS conditions (IL-2 + 209-2M), or when only antigen recall (209-2M), IL-2, or neither (no stimulation) was applied. Proliferation is presented as decreases in CFSE fluorescence proportional to number of cell divisions.
Proliferative ability of immunization induced CD8+ T cells. PBMCs from 3 patients with melanoma underwent in vitro sensitization (IVS) with 1 μM 209-2M followed by a 7-day culture in IL-2 (300 IU/mL). The top panel shows the proportional expansion of tHLA+ T cells during IVS. The numbers in the histograms, as gated by the horizontal bars, represent the Tc-pf as percent of tHLA+ over CD8+CD3+ T cells. The rows depict the proliferative capacity of the same samples under usual IVS conditions (IL-2 + 209-2M), or when only antigen recall (209-2M), IL-2, or neither (no stimulation) was applied. Proliferation is presented as decreases in CFSE fluorescence proportional to number of cell divisions.
Cytotoxic function of immunization-induced CD8+ T lymphocytes
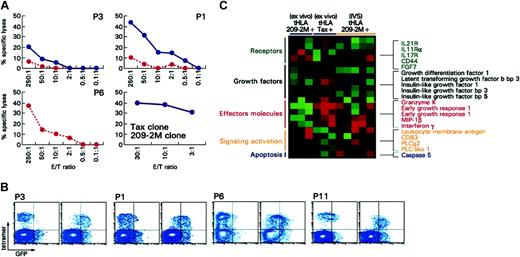
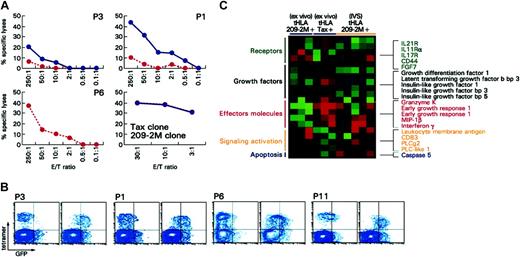
Circulating immunization-induced T cells could not exert direct ex vivo cytotoxic function in conditions in which Tax-specific T cells have demonstrated cytotoxic properties29 (Figure 2A). This is in agreement with lack of perforin expression by immunization-induced CD8+ T cells ex vivo that we have previously documented.18 An exception was represented by patient 6; this patient was the only one among 35 patients originally studied whose tHLA+ CD8+ T cell demonstrated intracellular expression of perforin (Figure 3A). Perforin expression correlated with antigen-specific cytotoxicity ex vivo (Figure 2A). In addition, patient 6 represents an interesting case because TA-specific Tc-pf in response to immunization was dramatically higher compared with those observed in all other patients tested in this study as well all previous analyses performed in our laboratory12,18 (Figure 3A). Although the reason for the unusual behavior of this patient is unknown, this example underlines the variability of T-cell phenotypes that can occur in immunized patients. In addition, this case exemplifies the significance of perforin expression in circulating CD8+ T cells as a marker of a broader level of T-cell activation characterized by the differential expression of an array of genes associated with effector function as discussed (“Global transcriptional profiling of the quiescent phenotype of immunization-induced CD8+ T lymphocytes”; Figure 4). IVS could reinstate the cytotoxic properties in immunization-induced CD8+ T cells, likely through activation of genes associated with cytotoxic function as shown (“Global transcriptional profiling of the quiescent phenotype of immunization-induced CD8+ T lymphocytes”).
Cytotoxic potential of immunization-induced T cells ex vivo and after IVS. (A) Cytotoxic activity ex vivo (red dashed line) and after IVS (blue solid line) for 3 patients including patient 6 (P6) who demonstrated perforin expression ex vivo (Figure 3A). Cytotoxicity is portrayed at different effector-to-target ratios and as specific killing (relevant versus irrelevant lysis of target cells). In no case was irrelevant killing above 5%. In the bottom panels, cytotoxicity by a 209-2M specific (red dashed line) and a Tax-specific (blue line) clone is shown for comparison. (B) Uptake of GFP/HLA-peptide complexes is shown for 3 patients with melanoma (P3, P1, P6) and one HAM patient (P11); for each patient the left scatter plot shows the uptake when an irrelevant peptide (gag peptide) is used for stimulation. On the right the uptake is shown when 209-2M or Tax, respectively, is used for pulsing of GFP/HLA complex-transduced HmyA2GFP cells. (C) Differential expression of genes associated with T-cell activation between antigen-specific CD8+ T cells from 3 patients with melanoma (209-2M-specific) ex vivo or after IVS and patients with HAM (Tax-specific). Shown genes are those that were significantly differentially expressed (unpaired, two-tailed Student t test; P2 < .05) between the immunization-induced (209-2M–specific) CD8+ T cells ex vivo in 3 patients with melanoma and the Tax-specific CD8+ T cells in 3 patients infected with HTLV-1. Only immune-relevant genes are shown.
Cytotoxic potential of immunization-induced T cells ex vivo and after IVS. (A) Cytotoxic activity ex vivo (red dashed line) and after IVS (blue solid line) for 3 patients including patient 6 (P6) who demonstrated perforin expression ex vivo (Figure 3A). Cytotoxicity is portrayed at different effector-to-target ratios and as specific killing (relevant versus irrelevant lysis of target cells). In no case was irrelevant killing above 5%. In the bottom panels, cytotoxicity by a 209-2M specific (red dashed line) and a Tax-specific (blue line) clone is shown for comparison. (B) Uptake of GFP/HLA-peptide complexes is shown for 3 patients with melanoma (P3, P1, P6) and one HAM patient (P11); for each patient the left scatter plot shows the uptake when an irrelevant peptide (gag peptide) is used for stimulation. On the right the uptake is shown when 209-2M or Tax, respectively, is used for pulsing of GFP/HLA complex-transduced HmyA2GFP cells. (C) Differential expression of genes associated with T-cell activation between antigen-specific CD8+ T cells from 3 patients with melanoma (209-2M-specific) ex vivo or after IVS and patients with HAM (Tax-specific). Shown genes are those that were significantly differentially expressed (unpaired, two-tailed Student t test; P2 < .05) between the immunization-induced (209-2M–specific) CD8+ T cells ex vivo in 3 patients with melanoma and the Tax-specific CD8+ T cells in 3 patients infected with HTLV-1. Only immune-relevant genes are shown.
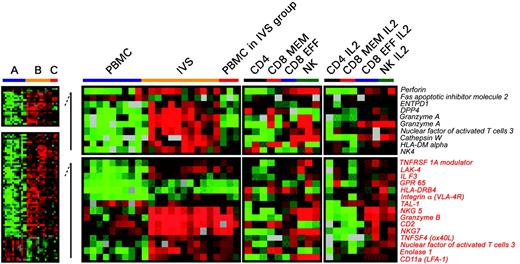
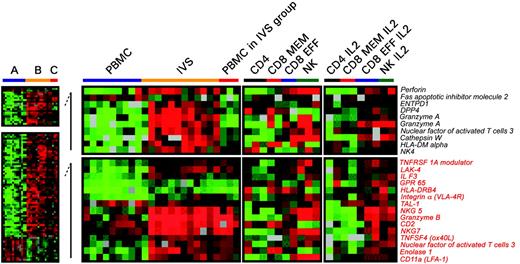
Differences in expression of genes associated with T-cell activation between circulating and IVS CD8+ T cells. Significant differences in individual gene expression (unpaired, two-tailed Student t test; P2 < .001) between circulating (A) and IVS-induced (B) CD8+ T cells. Statistical analysis was performed comparing 10 circulating lymphocyte samples with 11 IVS samples. Because 3 samples from circulating CD8+ T cells clustered with IVS-induced T cells (Figure 3C), a third group (C) was analyzed separately. Genes that were differentially expressed between group A and B (total of 761) were subdivided into 2 groups: one included genes specifically expressed in group B (unpaired, two-tailed Student t test; P2 < .05 between A and C) and one included genes commonly expressed between groups B and C (unpaired, two-tailed Student t test; P2 < .05). Genes associated with T-cell activation or functions are shown. As a comparison, on the right panels, the transcriptional profile of purified circulating cell subsets including CD4+, CD8+ memory, CD8+ effector T cells, and NK cells is shown ex vivo or after in vitro IL-2 conditioning.
Differences in expression of genes associated with T-cell activation between circulating and IVS CD8+ T cells. Significant differences in individual gene expression (unpaired, two-tailed Student t test; P2 < .001) between circulating (A) and IVS-induced (B) CD8+ T cells. Statistical analysis was performed comparing 10 circulating lymphocyte samples with 11 IVS samples. Because 3 samples from circulating CD8+ T cells clustered with IVS-induced T cells (Figure 3C), a third group (C) was analyzed separately. Genes that were differentially expressed between group A and B (total of 761) were subdivided into 2 groups: one included genes specifically expressed in group B (unpaired, two-tailed Student t test; P2 < .05 between A and C) and one included genes commonly expressed between groups B and C (unpaired, two-tailed Student t test; P2 < .05). Genes associated with T-cell activation or functions are shown. As a comparison, on the right panels, the transcriptional profile of purified circulating cell subsets including CD4+, CD8+ memory, CD8+ effector T cells, and NK cells is shown ex vivo or after in vitro IL-2 conditioning.
Despite their inability to perform cytotoxic function ex vivo, immunization-induced CD8+ T cells could readily and specifically acquire peptide-HLA-GFP complexes (Figure 2B) as previously observed in patients with HAM.29 These complexes are taken up from target cells by CD8+ T cells when their T-cell receptors (TCRs) interact with the appropriate peptide-HLA complex and, therefore, are a direct demonstration of the ability of T cells to recognize and interact with their targets. Thus, the acquisition of peptide-HLA-GFP complexes by immunization-induced T cells suggests that inadequate TCR engagement with the relevant HLA/epitope complex was not responsible for lack of cytotoxicity. Most likely, inability to perform cytotoxic function was due to factors independent of TCR/target interactions related to the ability of CD8+ T cells to effect their cytotoxic function.
Differential gene expression between immunization-induced and Tax-specific CD8+ T cells
Conceptually, immunization-induced circulating T cells differ from Tax-specific T cells obtained in patients with HAM because the former result from intermittent antigen exposure at the time of each vaccination followed by a 3-week rest interval before harvest from the patients, whereas the latter result from chronic stimulation induced by the constant presence of the pathogen.26 Thus, whereas the former uniformly approach a synchronized phenotype sampled from the patients during the proposed contraction phase of the immune response,40 the latter represent a more heterogeneous population of CD8+ T cells at different stages of differentiation. Comparisons were performed between the 2 disease models after enrichment of the respective tHLA staining, CD8+ T cells (Figure 3B). Although global transcript analysis demonstrated that the transcriptional profile of the 2 groups of cells was closer to each other than that of fully activated T cells after IVS (Figure 3C), supervised class comparison suggested that there were clear differences in gene expression pattern because Tax-specific T cells proportionally express higher levels of molecules associated with effector function (eg, IFN-γ, macrophage inflammatory protein 1β [MIP-1β], granzyme K;Figure 2C). In addition, several interleukin receptors (eg, IL-11R and IL-21R) associated with T-cell activation were up-regulated. Finally, insulin-like growth factor–related transcripts were consistently up-regulated in Tax-specific T cells, reflecting the active proliferative capacity of these cells in vivo that might be responsible for their spontaneous in vitro proliferation.28 Interestingly, most of the effector molecules were also up-regulated in immunization-induced T cells after IVS compared with their ex vivo profile, whereas other genes with different functions (cytokine receptors, growth factors, signaling, apoptosis) remained differentially expressed between Tax-specific CD8+ T cells and immunization-induced CD8+ T cells after IVS. This finding suggests that in vitro activation of immunization-induced CD8+ T cells follows different pathways than those regulating Tax-specific CD8+ T cells in vivo.
Global transcriptional profiling of the quiescent phenotype of immunization-induced CD8+ T lymphocytes
To comprehensively characterize the quiescent CD8+ T-cell phenotype that follows immunization with the HLA-A*0201-associated epitope 209-2M,39 we compared the transcriptional profile of circulating immunization-induced T cells with that of their progeny expanded by 10 days of IVS with 209-2M in the presence of IL-2. In addition, their transcriptional profile was also compared with that of HTLV-1 Tax-specific circulating CD8+ T cells from patients with active HAM. Specific CD8+ T cells were marked with tHLA and magnetically enriched from PBMCs or after 10 days of IVS to prepare aRNA32,36 for hybridization to a custom-made 17 000 cDNA clone immune-chip.
We first queried the complete data set for similarities among experiments. This analysis was important to define how the transcriptional profile differed among distinct experimental conditions. This was achieved by performing unsupervised hierarchical clustering that allows samples to cluster according to overall similarities of their gene expression independently from their experimental classification. Unsupervised clustering demonstrated that the transcriptional profile of circulating CD8+ T cells dramatically diverged from that of IVS-induced T cells independently of antigen-specificity (tHLA– versus tHLA+) or disease model (melanoma versus HAM; Figure 3C) suggesting that in general IVS had an overwhelming effect on the transcriptional profile of CD8+ T cells that obliterated possible differences among circulating T-cell subsets. Exceptions were represented by tHLA– T cells from patient 1 and tHLA+ and tHLA– T cells from patient 6, all of which clustered in the IVS group. This is not surprising because tHLA– T cells of patient 1 included a functionally activated subset (Figure 1) and patient 6 had shown an unusual behavior suggestive of in vivo activation (Figure 3A). Two signatures of genes up-regulated in IVS-enriched T cells and 1 signature of genes up-regulated in circulating T cells (Figure 3C) provide a global picture of the extensive differences existing between circulating and IVS-induced T cells that cannot be comprehensively illustrated by individual markers.
To test whether immunization-induced and Tax-specific T cells (Figure 4 group A) approach a complete effector phenotype ex vivo, we identified which genes were differentially expressed (unpaired, two-tailed Student t test; P2 < .001) in comparison with fully activated IVS-induced T cells (Figure 4 group B). The 3 ex vivo samples that clustered with IVS were analyzed separately (Figure 4 group C); 163 genes were specifically up-regulated following IVS.
In the circulating T cells, several genes associated with T-cell chemotaxis (CCR2, CCR5, and CXCR3) and adhesion (CD18, CD44, and galectin 3) critical for migration toward sites of inflammation were down-regulated (data not shown). Those genes have been previously associated with the effector phase of the immune response.40 Additional genes associated with T-cell activation or effector function were also down-regulated in circulating T cells relative to IVS (perforin, granzyme A, cathepsin W, NK4; Figure 4, top panel). In addition, among genes concomitantly up-regulated in IVS-induced and circulating T cells of group C (Figure 4, bottom panel) several had effector (granzyme B, NKG5, NKG7, CD2, and LAK-4) or migratory function (CD11a and integrin α). For instance, NK4 and NKG5 (NK-lysin) are selectively expressed by mitogen-activated NK and CD8+ T cells and have potent anticancer activity.41,42 NKG7 is a granule membrane protein that regulates effector function by migrating to the plasma membrane of NK cells following target cell recognition.43 CD2 promotes cytotoxicity through interaction with CD48. Finally, several other cytotoxic markers predominantly expressed by NK cells such as the cysteine protease cathepsin W44 and the adhesion molecule CD11a45 were induced by IVS. With the exception of NK4, most of the genes induced by IVS were also constitutively expressed in pooled circulating CD8+ effector T cells and in NK cells but not in CD8+ memory and CD4+ T cells. The level of expression of these genes was further increased in IL-2–conditioned CD8+ effector and NK cells but did not change in CD4+ and CD8+ memory T cells. These data suggest that IVS can induce either by antigen recall or by IL-2 exposure a transcriptional portrait close to the classical effector T and NK cell phenotype.
To test whether the differences in effector gene expression noted by transcriptional analysis could be detected at the protein level, we randomly selected 4 of the genes discussed (granzyme A, perforin, CD11a, and CD2) and compared the level of their expression in circulating and IVS-sensitized tHLA-staining, immunization-induced CD8+ T cells (Table 1).
As previously shown,18 perforin was significantly up-regulated by IVS as was the case for the other 3 markers studied. These data underline that the differences noted at gene expression level are informative about the functional status of the studied T cells both as assessed by protein analysis as well as by functional studies (Figure 2).
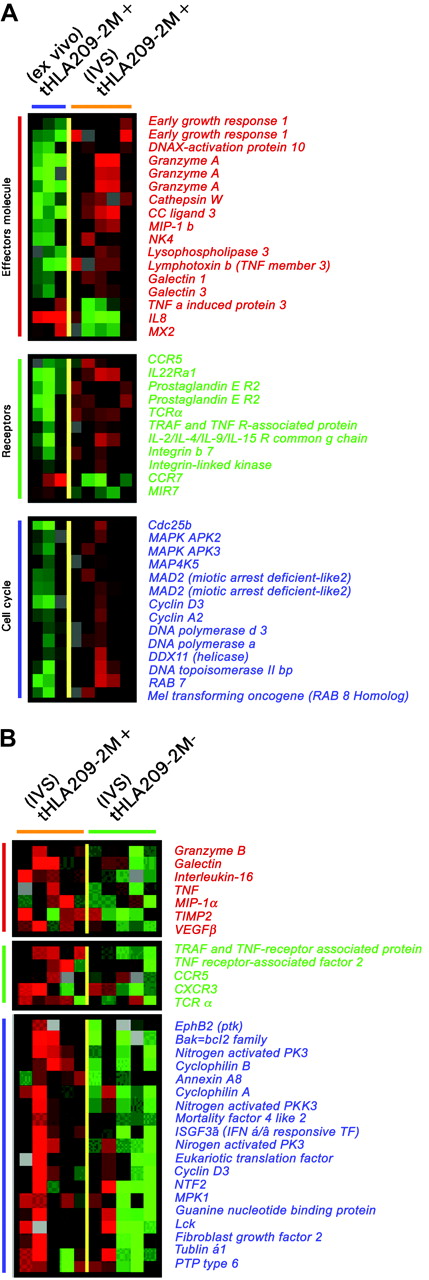
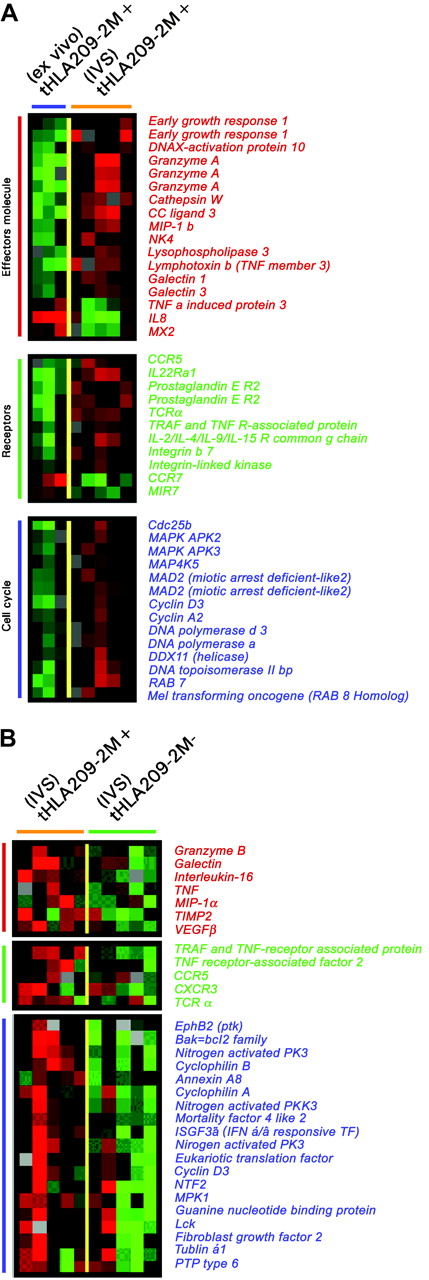
A similar conclusion could be drawn by directly comparing immunization-induced T cells to their IVS-induced progeny (Figure 5A). Effector molecules were proportionally up-regulated after IVS. Several surface molecules such as CCR5, the prostaglandin E receptor, integrin-β7, and TCRα were specifically induced by IVS. Conversely, CCR7 was strongly down-regulated, underlining a progressive differentiation toward a terminal effector phenotype during IVS. In addition, several cell cycle-related genes were strongly up-regulated by IVS. The differential expression between immunization-induced T cells ex vivo or after IVS could have been due to nonantigen-specific IL-2 exposure or to bystander stimulation from antigen-stimulated tHLA T cells present in the same culture that might have secreted immune modulatory molecules.46 To dissect the respective contribution of antigen recall and IL-2 in the re-enactment of effector function, the genetic profile of IVS-induced tHLA+ and tHLA– cells was compared. Comparison of the transcriptional profile of 209-2M–specific CD8+ T cells exposed to 209-2M during IVS to that of other CD8+ T cells from the same culture demonstrated that antigen recall induced a proportionally stronger activation of cell cycle and effector functions. This suggests that maximal CD8+ T-cell activation requires the combined exposure to antigen recall and costimulation as, in this case, through IL-2 (Figure 5B). Several cytokines and respective receptors were overexpressed in response to antigen recall including tumor necrosis factor α (TNF-α) and IL-16. The parallel induction of IL-16 and its coreceptor CCR5 suggests an autocrine control of the migration of newly activated CD8+ T cells during inflammation because these molecules control T-cell trafficking in inflamed tissues.47 Of interest was the up-regulation of HLA class II antigens, galectin 1, TCRα, MIP-1α, and vascular endothelial growth factor (VEGF) that have been previously associated with immune responsiveness to systemic IL-2 administration following immunization with 209-2M35 and with acute renal allograft rejection.48 These findings suggest that full activation of T cells as exemplified by in vitro antigen recall in the presence of IL-2 may be required for the execution of effector functions by CD8+ T cells in vivo.
Differences in expression of genes associated with T-cell activation between circulating and IVS immunization-induced T cells and between immunization-induced and concomitant CD8+ T cells induced by IVS. (A) Unpaired, two-tailed Student t test (P2 < .05) was applied to select genes differentially expressed between circulating immunization-induced T cells in 3 patients and 5 IVS-induced immunization-specific samples. (B) Genes differentially expressed between 5 209-2M tHLA+ and tHLA– subsets of CD8+ T cells from the same IVS cultures. Color coding is identical for both panels and represents, respectively, genes associated with effector function (red bars), relevant receptors (green bars), and genes associated with cell cycle regulation (blue bars).
Differences in expression of genes associated with T-cell activation between circulating and IVS immunization-induced T cells and between immunization-induced and concomitant CD8+ T cells induced by IVS. (A) Unpaired, two-tailed Student t test (P2 < .05) was applied to select genes differentially expressed between circulating immunization-induced T cells in 3 patients and 5 IVS-induced immunization-specific samples. (B) Genes differentially expressed between 5 209-2M tHLA+ and tHLA– subsets of CD8+ T cells from the same IVS cultures. Color coding is identical for both panels and represents, respectively, genes associated with effector function (red bars), relevant receptors (green bars), and genes associated with cell cycle regulation (blue bars).
Discussion
Large patient series suggest that metastatic melanoma is predisposed to regression following systemic administration of IL-2.49 The identification of TA recognized by T cells has fostered interest in adding active immunization to the treatment of this disease after immunization with 209-2M was reported by Rosenberg et al39 to induce response rates dramatically higher than expected with IL-2 alone.49 In that study, patients with metastatic melanoma who received immunization alone uniformly developed circulating CD8+ T cells that could recognize HLA-matched melanoma cell lines, but none of them experienced tumor regression. Patients who received immunization combined with IL-2 demonstrated a relatively high response rate, suggesting that this cytokine may be required for clinical effectiveness.2
Various factors could be responsible for the lack of clinical effectiveness of TA-specific T cells including lack of localization at tumor site, selective adaptation of tumor cells to escape immune recognition,7,50 or exposure of CD8+ T cells to immune suppressor molecules secreted within the tumor microenvironment.1,2 Thus, the observation of circulating epitope-specific CD8+ T cells following immunization may document the immunogenic potential of a vaccine, but it is uninformative about the capacity of the resulting T cells to exert effector functions in the target tissue.
Various models of memory and effector CD8+ T-cell development do not comprehensively describe the phenotype observed following immunization.15-17,20,40,51,52 A linear model of differentiation proposed by van Baarle et al20 suggests that on the first exposure to a foreign antigen naive T cells become memory cells capable of proliferating and secreting cytokines with faster kinetics on antigen recall. Then, memory T cells gradually evolve into “effectors” characterized by high expression of the activation marker CD45 (CD45RAhigh) and perforin, capable of producing IFN-γ and lacking expression of lymph node homing receptors such as CCR7 or CD27. This model does not fit our observations because immunization-induced CD8+ T cells displayed an intermediate memory/effector phenotype lacking the expression of CD27 and CCR7, expressing CD45RAhigh and IFN-γ but with little expression of perforin.18 IVS induced perforin and CD27 expression together with an array of genes associated with T-cell activation and effector function while decreasing the frequency of CD45RAhigh cells.18 Consistent with these observations, global transcript analysis could not firmly align circulating CD8+ T cells with a memory or an effector phenotype but rather suggested that immunization-induced T cells are, relative to their IVS-induced progeny, scarce in expression of molecules associated with effector function.40 These findings are also in line with recent reports suggesting that a significant proportion of immunization-induced T cells lack cytotoxic function ex vivo, particularly those with a relatively low recognition efficacy of target cells expressing physiologically adequate levels of cognate epitope.53 The quiescent effector phenotype may not preclude reacquisition of full effector functions when appropriate conditions may occur in vivo and may represent a transient status that can be reversed as exemplified by IVS.18,19 It has been suggested that potentially functional but quiescent circulating CD8+ T cells may be distinguished from the ineffective HIV-specific T cells that occur in patients with progressive infection as the latter fail to proliferate and produce perforin following IVS.19 This model suggests that IVS is a reasonable predictor of the ability of circulating T cells to recover effector function given favorable stimulatory conditions. In contrast with the HIV model, immunization-induced T cells in patients with melanoma display a fully functional potential as they proliferate in response to IVS, accumulate perforin, and display a broad array of effector molecules.
Longitudinal studies in mice suggest a continuous spectrum of CD8+ T-cell development from naive → effector → memory of which classical effector and memory phenotypes represent the extremes.40 The peak effector activity occurs 7 days after antigen exposure and is characterized by CD8+ T cells capable of producing IFN-γ, highly cytotoxic in direct ex vivo assays and expressing high levels of granzyme B. A gradual contraction phase ensues that, 40 days after antigen exposure, leads to memory T cells that do not posses cytotoxic activity ex vivo and lack granzyme B. This model applies well to the transient nature of the immune response associated with the relatively infrequent immunization schedules adopted in clinical trials. It is likely that the CD8+ T cells induced by immunization represent a synchronized population of effector cells undergoing the contraction phase because CD8+ T cells were collected 3 weeks after immunization. This hypothesis presumes that immunization-induced T cells do not circulate to the tumor site or, if they do, they do not encounter adequate costimulation to be kept functionally active as during the continuous stimulation occurring during the persistent antigenemia in chronic viral infections. The quiescent phenotype described here fosters the mounting evidence that effector functions cannot be rigidly ascribed to a particular subset of CD8+ T cells. Rather, as noted in the context of Epstein-Barr54 and other viral infections,21 memory and effector T cells may represent extremes of an interchangeable pool of cells more properly defined according to their status of activation.
Independent of their semantic categorization, immunization-induced T cells do not display a phenotype consistent with the successful performance of effector functions. It is, therefore, not surprising that several studies failed to identify a direct correlation between the number of circulating immunization-induced CD8+ T cells and tumor regression. Zinkernagel55 observed that repeated stimulation of memory CD8+ T cells is necessary for the protection of experimental animals from viral challenge or in the context of HIV infection.56 Perhaps the long intervals between immunizations adopted by cancer vaccine trials should be reconsidered.3-6 In addition, the physiology of T cells may demand the addition of an exogenous stimulation for their activation.2 IL-2 compared with other cytokine-receptor γ-chain family cytokines promotes effector function rather than proliferation (IL-15) or survival (IL-7) of cytotoxic T cells.46,57 Thus, in the absence of systemic IL-2, immunization-induced T cells may retain a quiescent phenotype that cannot be activated by a relatively indolent tumor microenvironment.35 We observed in this study that several genes associated with immune responsiveness during IL-2 therapy and acute kidney rejection (NK4, NKG 5, HLA-DRβ, TCRα, galectin, MIP, and VEGF) were expressed only after following IVS,35,48,58 pointing at them as markers of extreme T-cell activation necessary for the fulfillment of cytotoxic T-cell function. Although the number of patients tested was relatively limited and some variability was observed among the patients receiving immunization, consistent differences were noted between circulating lymphocytes and their progeny activated by IVS to suggest that these findings may be generalized to other patients and other antigens. Obviously, other immunization models should be tested particularly after the adoption of long immunization schedules likely to induce Tc-pf compatible with a successful extraction of TA-specific T cells.
In summary, little is known on what constitutes an “optimal” cytotoxic T-cell response to a vaccine. Immunization can reproducibly induce TA-specific CD8+ T cells responsive to antigen recall but resting in a quiescent status incapable of tumor destruction. Obviously, the limited number of patients that could be analyzed in this study does not allow definitive conclusions and a broader sample should be analyzed in the future. In vitro stimulation with antigen and IL-2 reconstitutes a full effector phenotype but it remains to be elucidated whether a similar mechanism is responsible for the incremental clinical benefits provided by systemic IL-2 administration in vivo. Our previous analysis of transcriptional changes occurring during IL-2 administration35 and the viral model described by Blattman et al59 suggest that the timing of IL-2 administration may be critical and should be further analyzed in future clinical studies.
Prepublished online as Blood First Edition Paper, June 8, 2004; DOI 10.1182/blood-2004-02-0525.
The publication costs of this article were defrayed in part by page charge payment. Therefore, and solely to indicate this fact, this article is hereby marked “advertisement” in accordance with 18 U.S.C. section 1734.
The authors would like to acknowledge Ms Cassandra Royce for assistance in the performance of the proliferation assays.

