Abstract
The Ca2+-activated K+ channels of human red blood cells (RBCs) (Gardos channels, hIK1, hSK4) can mediate rapid cell dehydration, of particular relevance to the pathophysiology of sickle cell disease. Previous investigations gave widely discrepant estimates of the number of Gardos channels per RBC, from as few as 1 to 3 to as many as 300, with large cell-to-cell differences, suggesting that RBCs could differ extensively in their susceptibility to dehydration by elevated Ca2+. Here we investigated the distribution of dehydration rates induced by maximal and uniform Ca2+ loads in normal (AA) and sickle (SS) RBCs by measuring the time-dependent changes in osmotic fragility and RBC volume distributions. We found a remarkable conservation of osmotic lysis and volume distribution profiles during Ca2+-induced dehydration, indicating overall uniformity of dehydration rates among AA and SS RBCs. In light of these results, alternative interpretations were suggested for the previously proposed low estimates and heterogeneity of channel numbers per cell. The results support the view that stochastic Ca2+ permeabilization rather than Gardos-channel variation is the main determinant selecting which SS cells dehydrate through Gardos channels in each sickling episode. (Blood. 2005;105:361-367)
Introduction
Human red blood cells (RBCs) have a Ca2+-sensitive K+ channel (the Gardos channel, hIK1 or hSK41-4 ) capable of increasing the mean K+ flux through the plasma membrane by 3 orders of magnitude.1,5 Gardos-channel activation in RBCs suspended in plasma, or in low-K+ plasmalike media, causes RBC dehydration by the loss of an alkaline, slightly hypertonic effluent composed of KCl and KOH.6,7 The physiological role of the Gardos channels in RBCs remains uncertain, but their participation in the pathogenesis of conditions with elevated RBC calcium, such as sickle cell anemia, is considered important because of the powerful and quasi-irreversible dehydrating effects of even minimal Gardos-channel activation.7-9
We addressed here whether Gardos-channel-mediated dehydration of RBCs, uniformly loaded with supramaximal Ca2+, proceeds at similar or different rates in the RBC population. This is particularly important for sickle (SS) RBCs, to help establish whether cell-to-cell differences in the number or functional state of the Gardos channels in each cell contribute to the selective vulnerability of individual RBCs to Ca2+-induced dehydration after sickling-induced Ca2+ permeabilization.10
The literature of the past 2 decades provides widely disparate estimates of the mean number of Gardos channels per normal RBC. The first estimates, obtained by comparing Na pump with Gardos-channel-mediated K(86Rb) losses from K(86Rb)-loaded inside-out RBC membrane vesicles (IOVs),11 ranged from 100 to 200 channels per cell. Similar estimates, also made using IOVs, were provided by Alvarez and Garcia-Sancho.12 Measurements of (125I)-charybdotoxin binding, in parallel with K+ flux inhibition, provided a mean value of approximately 120 channels per cell,13 in good agreement with the estimates from IOVs. On the other hand, a comparison between Gardos-channel-mediated K+ fluxes in RBCs and unitary currents measured in membrane patches14,15 led to much smaller estimates and to suggestions of marked heterogeneities. Grygorczyk et al16 estimated that approximately 75% of RBCs had between 1 and 5 channels per cell, whereas the rest had approximately 11 to 55 channels per cell. With a similar approach, Wolff et al17 estimated a uniform mean of 1 to 3 channels per cell.
If the very low estimates applied to all or to a substantial fraction of the RBCs in any given sample, even minimal variations around the mean should lead to large cell-to-cell variations in Gardos-mediated K+ fluxes and to substantial heterogeneities in response to Gardos-channel activation, such as RBC dehydration. It was therefore important to investigate how Gardos-channel-mediated dehydration is distributed among AA and SS RBCs when they are uniformly loaded with maximally activating [Ca2+]i.
Using Ca2+ ionophores enables the induction of a rapid and uniform RBC Ca2+ load, triggering instant and maximal Gardos-channel activation in all the cells. In these conditions, the rate of RBC dehydration is normally limited by electrodiffusional Cl- permeability.18,19 Replacement of Cl- by a more permeable anion, such as thiocyanate (SCN-), accelerates the rate of dehydration, which then becomes rate limited by the K+ permeability through the Gardos channel.20-22 RBC variations in Gardos-channel-mediated dehydration rate can be clearly detected and characterized by graded osmotic lysis and by flow cytometry.23-25
We measured the distribution of Gardos-channel-mediated dehydration rates in Ca2+-loaded AA RBCs and in 2 density-separated fractions of SS RBCs by following the progressive changes in the profiles of their osmotic lysis curves and of their volume (V) distributions obtained by flow cytometry during Gardos-channel-mediated dehydration. The results showed a remarkable degree of conservation of the migrating profiles, indicating a high degree of uniformity in the rate of dehydration of AA and SS RBCs exposed to maximally activating Ca2+ loads.
Patients, materials, and methods
Experimental design
Gardos-channel activity is usually measured as the Ca2+-induced, or inhibitor-sensitive, component of net or tracer K+ or Rb+ fluxes. These measurements report only mean values in the RBC population and cannot be used to investigate cell-to-cell variations in Gardos-channel activity. To detect such differences, it is necessary to measure the change in some cell property directly attributable to the level of Gardos-channel activation in each cell. For valid comparisons between cells, it is also necessary to ensure maximal Gardos-channel activation in all the RBCs of a sample. This requires maximal and uniform Ca2+ loads, and this is attainable by proper combinations of hematocrit (Hct), medium Ca2+ concentrations, and Ca2+-ionophore (A23187) concentrations in the cell suspension.26,27 Of the various RBC alterations induced by Gardos-channel activation (hyperpolarization, cell acidification, changes in cell solute content and volume) volume, and volume-associated variables such as hemoglobin, concentration and osmotic fragility offer optimal, practical ways to estimate cell-to-cell variation in Gardos-channel activity. Instant determinations of volume-related distributions during rapid sampling can be made with flow cytometry and with recently developed osmotic fragility methods.23,28,29 The magnitude and direction of Gardos-induced volume changes can be controlled by modifying the extracellular K+ concentration: dehydration would occur in low-K+ media, and hyperhydration would occur in media with external K+ concentration in excess of 90 mM (the external K+ concentration at which K+-permeabilized normal RBCs retain their initial volume30,31 ). Because dehydration offers a wider dynamic range of RBC volume variation than hyperhydration, it was preferred for the experiments reported here.
It was essential to determine the optimal experimental conditions in which the rate of dehydration would be a reliable, comparative measure of RBC Gardos-channel activity. Isotonic dehydration by net K-salt loss is a complex process, affected by the relative permeabilities of K+ and the co-anion, by the exponential increase in osmotic coefficient of hemoglobin, by the gradual dissipation of the driving K+ gradient, and by associated cell acidification.6,7 Using the Lew-Bookchin red cell model,6 which encodes all the processes relevant to the Gardos-channel-induced dehydration response, we sought the experimental conditions in which the initial rates of RBC dehydration would optimally reflect cell-to-cell differences in their Gardos-channel activities. The analysis indicated that it was essential to overcome the rate-limiting effect of the anion permeability. When Gardos channels are fully activated, net K+ fluxes and associated volume changes become rate limited by the relatively low electrodiffusional permeability of chloride and bicarbonate anions.18,19,32,33 When net salt movements across the cell membrane are limited by the anion permeability, the dehydration rate depends primarily on cell-to-cell variations in anion permeability, and even large cell-to-cell variations in Gardos-channel activity could remain concealed. The rate-limiting effects of the anion were minimized by partial replacement of Cl- by SCN-. The effect of SCN- in making anion permeability nonlimiting was found to be maximal at low SCN- concentrations (approximately 8-10 mM).20 Therefore, in the present experiments, we replaced only 10 mM Cl- by 10 mM SCN-, thereby avoiding the secondary effects of higher SCN- concentrations.34
Solutions
The names and compositions of the solutions were as follows (in mM): W: 147 NaCl, 3 KCl, 10 HEPES (N-2-hydroxyethylenepiperazine-N′-2-ethanesulfonic acid)-Na, pH 7.5, at 37°C, and 0.15 MgCl2; A: 140 NaCl, 10 NaSCN, 10 HEPES-Na, pH 7.5, at 37°C, and 0.15 MgCl2; B: 140 KCl, 10 NaSCN, 10 HEPES-Na, pH 7.5, at 37°C, and 0.15 MgCl2. Solutions A and B were combined to generate solutions 3K, 15K, and 80K containing 3, 15, or 80 mM K+, respectively. RBCs were suspended in solution 3K to follow dehydration in the osmotic lysis experiments, and they were suspended in solution 15K to follow dehydration in the experiments in which the V distributions were measured using the Advia 120 Hematology System (Bayer Diagnostics, Tarrytown, NY) (see “Measurement of RBC volume distribution by flow cytometry”). Solution 80K was used during the density separation procedure for SS cell fractions. Unless specified otherwise, the final concentrations of added solutes were (in mM): 0.1 EGTA (ethylene glycol-bis[aminoethylether]-tetraacetic acid), 0.050 CaCl2, 5 inosine, 1 sodium orthovanadate, 0.01 ionophore A23187 (from 2 mM stock in ethanol) (in the cell suspension). All additions were done from stock solutions with concentrations at least 100-fold higher than those in the final solutions or cell suspensions.
Measurement of osmotic lysis
As RBCs dehydrate, they become increasingly resistant to osmotic lysis so that their osmotic hemolysis curves migrate progressively toward lower tonicities. Cell-to-cell differences in dehydration rate, reflecting the population variation in Gardos-channel activity, will change the profile of the migrating lysis curves. The following protocol was used to measure the population distribution of dehydration rates with the profile migration method.22,23,28,35,36 Pairs of correspondingly labeled 96-well plates were used; one plate had U-shaped wells for spinning down the unlysed cells, and the other had flat-bottom wells for optical density measurements. Each column of the U-bottom plate contained 250 μL per well of each of 12 solutions with different osmolarities, ranging from 1.0 to 0.01 relative tonicity (RT) units (lysis media). These were prepared by mixing appropriate volumes of 2 solutions, one containing 149 mM NaCl and 2 mM HEPES-Na (pH 7.5 at 20°C) and the other containing only 2 mM HEPES-Na (pH 7.5 at 20°C). When higher resolution was required, as with the experiments on the light, reticulocyte-rich SS cell fraction (Figure 5), the full relative tonicity span was divided into 20 intermediate tonicities using 2 pairs of plates for the complete range. Fifteen seconds before each sampling time, 0.5 mL cell suspension was transferred to a plastic incubation tray (Accutran disposable incubation tray; Schleicher & Schuell, Dassel, Germany) at room temperature. At the exact sampling time, a 12-channel pipette (Finnpipette) was used to deliver 10-μL samples of the suspension in the incubation tray to the assigned row of 12 wells on a U-bottom, 96-well plate containing 250 μL lysis media, and the solutions in the wells were rapidly mixed by repeated vigorous squirts with the multichannel dispenser. Each timed sample generated a full hemolysis curve. To estimate the fraction of hemolysis in each well, the plate was centrifuged for 5 minutes at 1900 rpm, 150 μL samples of the supernatants were transferred with a 12-channel dispenser to the correspondingly labeled row on the flat-bottom plate, and the concentrations of hemoglobin were measured on a plate reader (Multiskan Bichromatic type 348; Labsystems, Helsinki, Finland) by its absorption at 414 μm, the Soret band, where its extinction coefficient is maximal. The hemolysis curves are shown in standard format, plotting the percentage hemolysis as a function of RT. Conserved profiles (ie, parallel shapes of the migrating hemolysis curves) indicate uniformity of dehydration rates, whereas changing profiles reflect heterogeneities of dehydration rates among the RBCs.
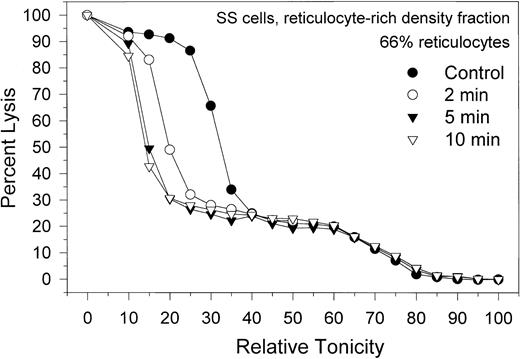
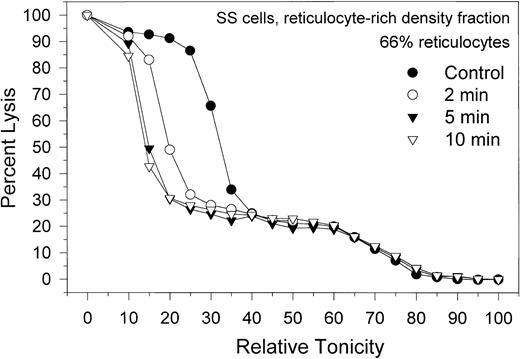
Migration patterns of the hemolysis curves of SS RBCs from the light, reticulocyte-rich fraction during Ca2+-induced dehydration. Patterns shown are representative of 4 experiments with blood from 3 donors. Control (•) curve shows the distribution of osmotic fragilities in this RBC fraction before Ca2+ permeabilization. Time intervals for the other 3 curves are the sampling times after A23187 addition. Note the marked heterogeneity of osmotic fragilities and dehydration responses characteristic of this SS cell fraction.
Migration patterns of the hemolysis curves of SS RBCs from the light, reticulocyte-rich fraction during Ca2+-induced dehydration. Patterns shown are representative of 4 experiments with blood from 3 donors. Control (•) curve shows the distribution of osmotic fragilities in this RBC fraction before Ca2+ permeabilization. Time intervals for the other 3 curves are the sampling times after A23187 addition. Note the marked heterogeneity of osmotic fragilities and dehydration responses characteristic of this SS cell fraction.
Measurement of RBC volume distribution by flow cytometry
Individual RBC V values were measured with a flow cytometer-based hematology analyzer, the Advia 120 Hematology System (Bayer Diagnostics), in the open-aspiration mode. RBCs were isovolumetrically sphered24 with 0.035 mM sodium dodecyl sulfate and lightly fixed with 0.11% glutaraldehyde. Mie scatter theory was used to determine V for each cell by analysis of low-angle laser light scattering, as previously described.25 The Advia flow cytometer analyzed at least 12 000 RBCs from each sample, measured the V of each RBC, and computed the mean of the volume distribution, MCV, in femtoliters, and the standard deviation of the MCV (SD of MCV). It also estimated the MCHC of each sample from the hemoglobin concentration (measured colorimetrically as cyanmet-Hb) and the Hct calculated from the RBC count and the MCV.
Measurement of red cell ATP content
Adenosine triphosphate (ATP) content was measured by luciferin-luciferase light emission, as described by Brown37 and modified by Dagher and Lew.38 Briefly, 20 to 50 μL RBC suspensions at 5% to 10% Hct were delivered into 200 μL of ice-cold 0.1N HCl and spun at 12 000 rpm for 1 minute to precipitate denatured protein, and the clear supernatant was sampled into combination buffer37 for ATP measurement by liquid scintillation counting against calibrated standards.
Preparation of cells
Venous blood anticoagulated with Na-EDTA (ethylenediaminetetraacetic acid) was obtained after informed consent from healthy donors (AA) or from SS patients. Approval for these studies was obtained from the Institutional Review Boards of the Physiological Laboratory, University of Cambridge, United Kingdom, and from the Albert Einstein College of Medicine, New York, NY. AA blood was centrifuged, and the RBCs were washed twice in large volumes of solution W with added EGTA and thrice more with solution W alone, with the buffy coat removed after each wash. After the last wash, the RBCs were suspended at 10% Hct in solution 3K or 15K supplemented with CaCl2 and inosine, as indicated. SS blood was density fractionated, as described.9,36,39 Briefly, the RBCs were washed in 80K with EGTA, and the washed, packed RBCs were suspended at approximately 50% Hct in the same buffer and layered onto a discontinuous gradient of arabinogalactan in solution 80K. The reticulocyte-rich fraction with density less than 1.091 (F1) and the discocyte fraction (D1) with densities between 1.091 and 1.106 (which excluded the dense SS cell fractions) were harvested and washed thrice in solution 3K (for osmotic lysis measurements) or 15K (for Advia flow cytometry measurements). The RBCs were finally suspended at approximately 10% Hct, and the suspensions were supplemented with calcium and inosine at the final concentrations indicated above.
Experimental protocol
AA and SS RBC suspensions were incubated at 37°C under magnetic stirring. After approximately 10 minutes, to allow for temperature equilibration, the ionophore A23187 was added (t = 0) to give a final concentration of 10 μM in the suspension. At an Hct of 10% and with 50 μM initial external Ca2+ concentration, this high ionophore concentration generates a rapid and uniform Ca2+ load in the cell population, causing an almost instantaneous maximal activation of Gardos channels in all cells.40,41 Samples for hemolysis curves or flow cytometry were taken as frequently as possible for the first 3 to 5 minutes after ionophore addition, usually at 30- to 40-second intervals, as indicated in Table 1 and Figures 1, 2, 4, and 5. For osmotic lysis curves, 0.5-mL samples were processed as described above. For flow cytometry, aliquots of the cell suspensions in supplemented 15K media were aspirated into the flow cytometer at the indicated times.
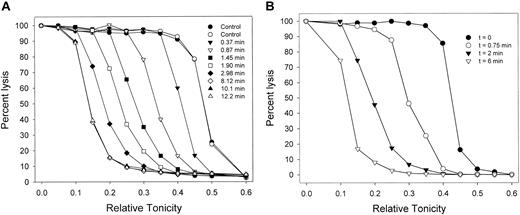
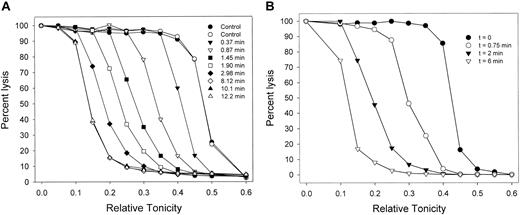
Migration patterns of the hemolysis curves of AA RBCs during Gardos-channel-mediated dehydration. (A) Patterns observed in 7 of 9 experiments with RBCs from 6 donors. Control curves (circles, in duplicate) show the distribution of osmotic fragilities in the RBC sample before Ca2+ permeabilization. For each curve, the sampling time is the interval after ionophore A23187 addition (set as t = 0), precisely when the 10-μL samples contained in the tips of a 12 × multipipette were discharged into the different hypotonic solutions. (B) Patterns observed in 2 of the 9 experiments in this series. Results in panels A and B were obtained with RBCs from blood drawn from the same donor on different dates.
Migration patterns of the hemolysis curves of AA RBCs during Gardos-channel-mediated dehydration. (A) Patterns observed in 7 of 9 experiments with RBCs from 6 donors. Control curves (circles, in duplicate) show the distribution of osmotic fragilities in the RBC sample before Ca2+ permeabilization. For each curve, the sampling time is the interval after ionophore A23187 addition (set as t = 0), precisely when the 10-μL samples contained in the tips of a 12 × multipipette were discharged into the different hypotonic solutions. (B) Patterns observed in 2 of the 9 experiments in this series. Results in panels A and B were obtained with RBCs from blood drawn from the same donor on different dates.
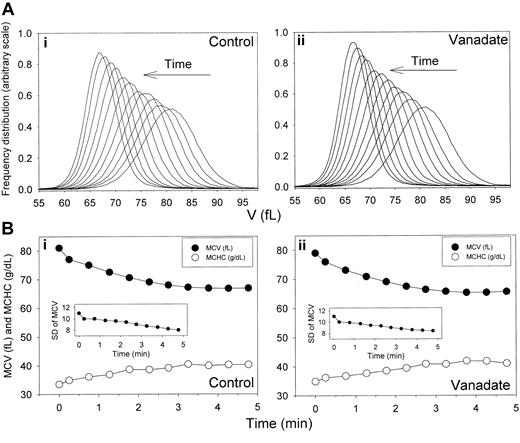
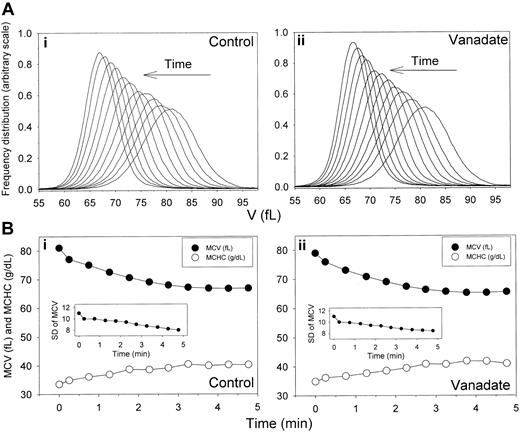
Time-dependent shifts in the volume distribution and in MCV and MCHC of AA RBCs during Ca2+-induced dehydration in the presence and absence of sodium orthovanadate. Experimental details are given in the Table 1 footnote. (A) Arrows indicate the time direction of displacement of the curves representing the RBC V distributions during Ca2+-induced dehydration in the presence (ii) and absence (i) of 1 mM sodium orthovanadate. Time intervals from the initial curve are those indicated in the first column of Table 1. The area under each of the curves was similar, as confirmed by the nearly identical number of cells counted in the Advia for each sample (± 0.6%). Therefore, the gradual increase in the height of the distribution curves toward the completion of dehydration reflects a narrowing of the volume distribution (declining SD of MCV, as shown in Table 1 and in the insets in panel B). (B) MCVs (in femtoliters; •) and MCHCs (in g/dL; ○) are plotted as a function of time after A23187 addition to illustrate the inverse MCV-MCHC changes during Gardos-channel-mediated dehydration in the presence (ii) and absence (i) of 1 mM sodium orthovanadate. Insets show changes in SDs of the V distributions with time after A23187 addition.
Time-dependent shifts in the volume distribution and in MCV and MCHC of AA RBCs during Ca2+-induced dehydration in the presence and absence of sodium orthovanadate. Experimental details are given in the Table 1 footnote. (A) Arrows indicate the time direction of displacement of the curves representing the RBC V distributions during Ca2+-induced dehydration in the presence (ii) and absence (i) of 1 mM sodium orthovanadate. Time intervals from the initial curve are those indicated in the first column of Table 1. The area under each of the curves was similar, as confirmed by the nearly identical number of cells counted in the Advia for each sample (± 0.6%). Therefore, the gradual increase in the height of the distribution curves toward the completion of dehydration reflects a narrowing of the volume distribution (declining SD of MCV, as shown in Table 1 and in the insets in panel B). (B) MCVs (in femtoliters; •) and MCHCs (in g/dL; ○) are plotted as a function of time after A23187 addition to illustrate the inverse MCV-MCHC changes during Gardos-channel-mediated dehydration in the presence (ii) and absence (i) of 1 mM sodium orthovanadate. Insets show changes in SDs of the V distributions with time after A23187 addition.
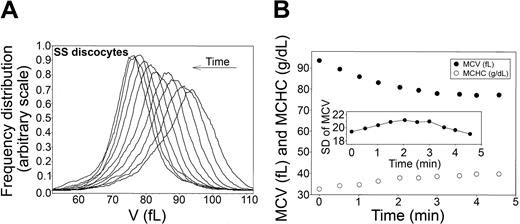
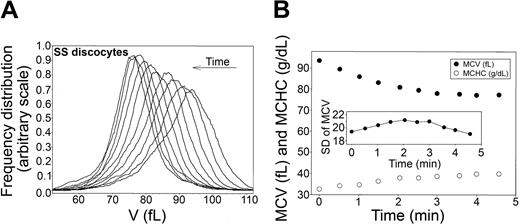
Time-dependent shifts in the volume distribution and in MCV and MCHC of SS discocytes during Ca2+-induced dehydration. (A) Volume distributions (V) during Ca2+-induced dehydration. Arrow indicates the time direction of displacement of the curves. Time intervals from the initial curve correspond to those shown for the MCV and MCHC points on the time-abscissa of the bottom panel. (B) MCVs (in femtoliters; •) and MCHCs (in g/dL; ○) are plotted as a function of time after A23187 addition to illustrate the inverse MCV-MCHC changes during Gardos-channel-mediated dehydration. (Inset) Change in SD of the volume distribution with time after A23187 addition. Notice the difference in the scale of the SD of MCV data compared with that in Figure 2B, indicating a much wider range of RBC volumes in this SS cell fraction than in the AA cells.
Time-dependent shifts in the volume distribution and in MCV and MCHC of SS discocytes during Ca2+-induced dehydration. (A) Volume distributions (V) during Ca2+-induced dehydration. Arrow indicates the time direction of displacement of the curves. Time intervals from the initial curve correspond to those shown for the MCV and MCHC points on the time-abscissa of the bottom panel. (B) MCVs (in femtoliters; •) and MCHCs (in g/dL; ○) are plotted as a function of time after A23187 addition to illustrate the inverse MCV-MCHC changes during Gardos-channel-mediated dehydration. (Inset) Change in SD of the volume distribution with time after A23187 addition. Notice the difference in the scale of the SD of MCV data compared with that in Figure 2B, indicating a much wider range of RBC volumes in this SS cell fraction than in the AA cells.
In preliminary experiments (not shown), we tested whether the Advia sampling procedure affected the volume distribution of RBCs during Gardos-mediated dehydration. We compared 2 sampling procedures on parallel RBC suspensions (Hct 10%). The first involved direct aspiration through the Advia at specified times after the addition of A23187. The second involved the addition of excess EGTA over [Ca2+]o at precisely the same times after the addition of A23187, to deactivate the Gardos channels and to arrest further dehydration before aspiration of the sample into the flow cytometer. Volume distributions of both samples were identical, indicating that the Advia results were not influenced by the state of activation of the Gardos channels at the time of sampling and that direct Advia sampling reported the instant volume distributions at the time of sampling.
Results
AA RBCs
Figure 1A shows the migration patterns of osmotic lysis curves during Gardos-channel-mediated dehydration, as observed in 7 of 9 experiments, with blood from 6 donors. As RBCs dehydrate, they require more water entry to reach their critical hemolytic volumes, so that their lysis curves migrate toward lower relative tonicities. Dehydration was usually complete within 4 to 6 minutes after the addition of ionophore. The initial dehydration rate in the media containing 10 mM SCN- was more than 20-fold faster than that previously observed in all-Cl- media.7,20 In all but 2 of the 9 experiments, lysis curve migration proceeded with little change in the original profile (Figure 1A). The patterns in Figure 1A suggest that the migration profile was largely conserved and, therefore, that Gardos-channel-mediated dehydration proceeded without any large rate differences among RBCs.
In 2 of the 9 experiments, there was a slight broadening of migration rates (Figure 1B). The experiments chosen to illustrate the patterns in Figure 1A-B were performed with RBCs from the same donor, drawn on different days. These results suggest that, within an overall unimodal normal distribution of dehydration rates, modulatory factors known to affect Gardos-channel activity may influence the spread of these rates on different days.3,42-51 This variability has not been studied systematically here and will therefore not be considered further. Overall, the results from lysis curve migration suggest that the number and functional state of the Gardos channels were not markedly heterogeneous among RBCs from single donor blood samples.
The distribution of Gardos-channel-mediated dehydration rates was investigated with higher resolution using flow cytometry. Results from 1 experiment, typical of 5 similar experiments with blood from 4 donors, are shown in Table 1 and Figure 2, which report the MCV and MCHC displacements initiated by Gardos-channel activation and the SD of MCV. Gardos-channel activation caused rapid and inverse changes in MCV and MCHC values (Table 1; Figure 2, control, lower panel), which leveled off 4 to 5 minutes after the induced Ca2+ load. Figure 2 (control, top panel) illustrates the displacement in time of the V distribution toward a final dehydrated condition. The most important and consistent observation was that the initial unimodal Gaussian distribution pattern was conserved during dehydration. In the 5 experiments of this series, there was no indication of broadening of the initial volume distribution during the dehydration process. Rather, a small but consistent reduction in SD of up to 28% in advanced dehydrated states suggested that the homeostatic condition of dehydrated cells had become more uniform (Table 1; Figure 2, control, lower panel inset). In general, the displacement of the V distributions during dehydration showed consistent conservation of the original Gaussian pattern and minimal change in SD. Thus, as previously observed with valinomycin-induced dehydration,25 the present results also show a fairly uniform response to Gardos-channel-mediated dehydration.
The Ca2+ loads required to maximally activate Gardos channels also trigger maximal ATP hydrolysis by the plasma membrane Ca2+ pump (PMCA), with consequent irreversible ATP depletion and IMP accumulation.38,52 Thus, the nucleotide metabolism of dehydrating RBCs in the control conditions of Table 1 and Figure 2 would have been highly unstable, with rapid ATP depletion during dehydration (Figure 3, control). Note that the major decrease in ATP content occurred during the first 10 minutes but that within that period it remained well above 0.5 mmol per 340 g Hb. This corresponds to a concentration of ATP in cell water in excess of 0.7 mM, sufficient, in principle, to sustain the putative regulatory effects of ATP on the Gardos channels reported for SK4 in recombinant expression systems.42,43 To investigate whether Gardos-channel-mediated dehydration was affected by the nucleotide changes, we compared the dehydration responses in the presence and absence of vanadate at concentrations that inhibit more than 99% of the PMCA activity53 with the associated decrease in ATP (Figure 3, vanadate). The results, displayed in the sections of Table 1 and Figure 2 labeled “Vanadate,” show that vanadate had no significant effects on the distribution of dehydration rates.
Effect of ionophore-induced Ca2+ loads on the ATP content of AA RBCs in the absence and presence of 1 mM sodium orthovanadate in the RBC suspension. Results shown are from 1 experiment using the same conditions as those in the flow cytometry experiments (Figure 2, [K+]o = 15 mM). Almost identical results were obtained in 2 additional experiments with Ko = 80 mM. The ATP content of the RBCs was related to the measured hemoglobin concentration in a parallel sample and is expressed per 340 g Hb, assumed equivalent of 1 L packed normal RBCs. The 1 mM vanadate inhibited more than 99% of PMCA-mediated Ca2+ transport and ATP consumption by the pump.53 Note the steep fall in ATP content in the controls immediately after Ca2+ permeabilization, the period during which dehydration rates were measured, and the contrasting conservation of ATP levels in the presence of vanadate. Despite such differences, the conditions with and without vanadate, described in Table 1 and Figure 2, showed very similar results.
Effect of ionophore-induced Ca2+ loads on the ATP content of AA RBCs in the absence and presence of 1 mM sodium orthovanadate in the RBC suspension. Results shown are from 1 experiment using the same conditions as those in the flow cytometry experiments (Figure 2, [K+]o = 15 mM). Almost identical results were obtained in 2 additional experiments with Ko = 80 mM. The ATP content of the RBCs was related to the measured hemoglobin concentration in a parallel sample and is expressed per 340 g Hb, assumed equivalent of 1 L packed normal RBCs. The 1 mM vanadate inhibited more than 99% of PMCA-mediated Ca2+ transport and ATP consumption by the pump.53 Note the steep fall in ATP content in the controls immediately after Ca2+ permeabilization, the period during which dehydration rates were measured, and the contrasting conservation of ATP levels in the presence of vanadate. Despite such differences, the conditions with and without vanadate, described in Table 1 and Figure 2, showed very similar results.
SS RBCs
The experimental protocol used for AA cells (Figure 2) was applied to SS discocytes, as shown in Figure 4 (representative of 3 experiments with blood from 3 SS donors). In all experiments, the initial volume distribution in this cell fraction was more irregular and broader than that of AA cells, as reflected in the larger standard deviation (compare scales of the SD of MCV in Figures 2 and 4, bottom panels). On the other hand, the MCV and MCHC changes (Figure 4, bottom panel) and the migration patterns of the volume distribution curves elicited by Gardos-channel activation (Figure 4, top panel) were similar to those observed with AA RBCs (Figure 2, top panels), with overall conservation of the original distribution and a minor but consistent narrowing of the distribution toward the dehydrated state. These results show that there are no detectable differences in Gardos-mediated dehydration capacity among SS discocytes.
The effect of Gardos-channel activation on the dehydration patterns of SS cells from the reticulocyte-rich SS cell fraction (F1) is shown in Figure 5. Data are representative of 4 experiments with blood from 3 donors, with reticulocyte counts in their F1 fractions varying from 55% to 79%. The control hemolysis curve shows 2 distinct cell populations, one comprising approximately 25% of the total hemoglobin in the sample, with a broad lysis pattern around a mean relative tonicity of 70% (high osmotic fragility), and another comprising 75% of the hemoglobin, with a sharper lysis pattern around a mean relative tonicity of 30% (low osmotic fragility). The proportion of high osmotic fragility cells varied from 10% to 35% in the 4 experiments of this series. Activating the Gardos channels by adding A23187 elicited dehydration only in the subpopulation of low osmotic fragility cells, indicating that the high osmotic fragility cells are resistant to dehydration by K+ permeabilization. Microscopic observation of the high and low osmotic fragility RBC subpopulations after density separation of the dehydration-resistant cells25 showed that all the reticulocytes were confined to the low osmotic fragility cell fraction (Figure 5; approximately 90% reticulocytes). Characteristics of the high osmotic fragility cells correspond to those described for the valinomycin- or calcium-resistant RBCs,25 reflecting their resistance to dehydration by K+ permeabilization. Because of their high Na+, low K+ content, dehydration resistance was attributed to the lack of a driving gradient for dehydration. The functional condition of their Gardos channels was not investigated here and remains unknown. On the other hand, Gardos-channel-mediated dehydration of the low osmotic fragility cells, mostly reticulocytes, was rapid and included overall conservation of the lysis curve profile during dehydration (Figure 5), suggesting a degree of uniformity in Gardos-channel function of SS reticulocytes similar to that in SS discocytes and AA cells.
Discussion
We have investigated the dehydration responses elicited by maximally activated Gardos channels in populations of normal human RBCs and of SS RBCs. In all instances, we observed only minor transient reductions in the slope of migrating lysis curves and overall conservation of the original volume distributions during dehydration, indicating a high degree of uniformity in Gardos-channel-elicited dehydration rates in AA and SS RBCs. The uniformity of the dehydration response is conserved even when the dehydration rate varies between samples from the same donor on different days (Figure 1), suggesting that the underlying regulatory processes influence all RBCs in a similar way.
In SS reticulocytes and discocytes, the results suggest that cell-to-cell variation in the number or functional state of the Gardos channels cannot be a significant factor in the selection of which SS RBCs become hyperdense and irreversibly sickled. The uniformity of dehydration rates induced in SS reticulocytes by maximal Gardos-channel activation (Figure 5) or by valinomycin36 contrast with the marked heterogeneity induced by deoxygenation in the presence of Ca2+, attributed to sickling-induced Ca2+ permeabilization.36 Thus, stochastic Ca2+ permeabilization10 rather than Gardos-channel variation remains the main determinant in the selection of the SS cells that dehydrate through Gardos channels in each sickling episode.
The surprising narrowing of the original volume distributions of AA RBCs as the cells approached maximal dehydration (Figure 2), documented more precisely by the late reduction in their standard deviations (Table 1; Figure 2, insets), cannot be related to cell differences in Gardos-channel activity because these would have been prominent during the initial rather than the final dehydration stages. The likely explanation of this pattern is that in the dehydrated state, the K+ content of the cells becomes more uniform than in the predehydration state because all the cells equilibrate with the same external K+ concentration. Given that the constitutive volume distributions are largely determined by the total osmolyte content distribution of the cells,23,54 a more uniform K+ content of the dehydrated cells would be reflected in a reduction of their standard deviation. A similar pattern is also apparent with SS discocytes (Figure 4, top panel), but, because of the much wider dispersion of volumes around the mean in this cell fraction, the trend is not so clearly reflected in the standard deviation changes (Figure 4, inset).
The uniformity of dehydration rates documented here is difficult to reconcile with the very low estimates of channel number per RBC because minimal variations in channel number would have generated much larger distortions than those observed in the migrating profiles of lysis curves and volume distributions. In reviewing the experiments that led to the low estimates, we noted that a major assumption was that the combination of hematocrit, external Ca2+, and ionophore (A23187) concentrations used was sufficient to induce maximal Gardos-channel activation in all the cells. This assumption, however, may not be valid. Wolff et al17 used a high concentration of the ionophore A23187 but suspended the RBCs in media with very low free Ca2+ concentrations, buffered with EGTA or citrate. Recent results22 showed that the Vmax of the PMCA varies greatly among normal RBCs. At the low external Ca2+ levels used by Wolff et al,17 ionophore-mediated Ca2+ influx would have been well within the range of variation of PMCA Vmax, thus generating pump-leak steady states with different [Ca2+]i levels among the RBCs, below and above Gardos-channel activation. This brief analysis points out the difficulty of establishing uniform intracellular free Ca2+ concentrations when RBCs are permeabilized to Ca2+ in conditions in which the induced Ca2+ influx falls within the range of variation of PMCA Vmax. It also explains how Gardos-channel-mediated fluxes may be underestimated and how the appearance of heterogeneity may be generated by differences in [Ca2+]i levels rather than in the number of Gardos channels per cell.
A second important factor is the unusual temperature dependence of the open state probability (Po) of Gardos channels recorded by Grygorczyk55 and by Hoffman et al4 in excised membrane patches of human RBCs, almost 100-fold lower at 35°C than at 30°C. To analyze the influence of Po on the estimates of channel number per cell, let us consider a typical mean initial net K+ efflux (ϕ) of ϕ approximately 1 mol/(l cell·h) at 37°C, in the conditions of our experiments ([K+]o = 3 to 15 mM), at maximal Gardos-channel activation. Let us also assume approximate values of 20 pS for the single-channel conductance,14 1013 for the number of RBCs per liter of packed normal RBCs (n), and approximately 0.05 V for the electric driving force in the 10 mM SCN- media (Em - EK, where Em is the membrane potential, and EK is the K+ equilibrium potential). We define IK = gPoNn(Em - EK), where IK is the K+ current (IK = zFϕ approximately 105 coulombs/(l cell · h)), g is the single-channel conductance (20 pS, equivalent to 7.2 × 10⁻⁸ coulombs/(volt · h)), and N is the mean number of Gardos channels per cell. Solving for the PoN product, we obtain PoN approximately 3. Thus, the estimate of N based on fluxes depends critically on the value attributed to Po and could vary from 30 to 300 if the open state probability at 37°C is between 0.1 and 0.01.55
We consider next what can be inferred about the distribution of Gardos channels among RBCs from the observed uniformity of dehydration rates documented here. At nonlimiting anion permeability, the dehydration rate of each RBC is determined by its K+ permeability multiplied by the strength of the driving gradient for dehydration. The K+ permeability reflects the summed product of the number of Gardos channels, single-channel conductance, and open state probability of the channels in each cell, as analyzed above. Single-channel conductances and open state probabilities are intrinsic kinetic properties of the channels, reflecting their structure and their dynamic response, which are influenced by similar modulating factors operating within each cell. Therefore, differences in RBC K+ permeability must result primarily from differences in the number of Gardos channels per cell. The driving force for dehydration is determined by the outward electrochemical gradient of K+, which may have an age-related distribution in the RBC population. It was previously shown that, statistically, RBCs with larger volumes tend to have larger membrane areas.23 Thus, for a large RBC to dehydrate at the same rate as a small RBC through Gardos channels, the channels must have similar surface densities rather than the same absolute numbers in the 2 cells. Although similarity in the number of Gardos channels per unit membrane area among RBCs offers the simplest explanation of the present results, caveats related to variations in driving force among RBCs have to be taken into consideration. Normal RBCs become denser on aging (for a review, see Clark56 ), reducing their volume and the size of their K+ pools, with progressive dilution of their intracellular K+ concentration.6,7 With SS RBCs, progressive K+ loss accompanies the generation of denser discocytes during their relatively slow-track dehydration.9,57 In addition, progress to senescence may occur with further dissipation of their normal K+ and Na+ gradients.25 All these processes would be expected to alter the driving force for Gardos-channel-mediated dehydration in the affected RBCs, contributing to individual cell differences in dehydration rates. This brief analysis highlights some of the difficulties of establishing the precise type of Gardos-channel distribution from the observed uniformity of dehydration rates.
Prepublished online as Blood First Edition Paper, August 31, 2004; DOI 10.1182/blood-2004-01-0125.
Supported by grants from the Wellcome Trust (United Kingdom) and the National Institutes of Health (HL28018, HL58512, and RR12248).
The publication costs of this article were defrayed in part by page charge payment. Therefore, and solely to indicate this fact, this article is hereby marked “advertisement” in accordance with 18 U.S.C. section 1734.
We thank J. F. Hoffman for many helpful discussions.

![Figure 3. Effect of ionophore-induced Ca2+ loads on the ATP content of AA RBCs in the absence and presence of 1 mM sodium orthovanadate in the RBC suspension. Results shown are from 1 experiment using the same conditions as those in the flow cytometry experiments (Figure 2, [K+]o = 15 mM). Almost identical results were obtained in 2 additional experiments with Ko = 80 mM. The ATP content of the RBCs was related to the measured hemoglobin concentration in a parallel sample and is expressed per 340 g Hb, assumed equivalent of 1 L packed normal RBCs. The 1 mM vanadate inhibited more than 99% of PMCA-mediated Ca2+ transport and ATP consumption by the pump.53 Note the steep fall in ATP content in the controls immediately after Ca2+ permeabilization, the period during which dehydration rates were measured, and the contrasting conservation of ATP levels in the presence of vanadate. Despite such differences, the conditions with and without vanadate, described in Table 1 and Figure 2, showed very similar results.](https://ash.silverchair-cdn.com/ash/content_public/journal/blood/105/1/10.1182_blood-2004-01-0125/6/m_zh80010571580003.jpeg?Expires=1766319795&Signature=bUH8KmEnm28nwqbxgVQl-jS88jQ6FbLCZ5gldz4IiLxQ-f8kecjhYrcIAisuCIoHQyWyqyTFoumQ0hSThQ~A8ebIKUwTxkNc43ufMDvltx-RqR24v4qJEbnPMlnIZlYfVUzN5elEusW-2rHhYlQtjG8rVJvWJ18-z75CiZwxuJL9fR35BszzEzbczPnhWYgZWn7-SIyM4gh83KHHUBZL2WlocuNvnbeGOppmEzZBeoOztgmQavKWl2K4kVhWZSLoA4NJspucZu-QoLqofLUYS84MJCKTI3ILYCsCyCppJDh9dCnI19I0DQxL~cgzoHxYWb38HCxu4PFhUuKAs4rIBQ__&Key-Pair-Id=APKAIE5G5CRDK6RD3PGA)

![Figure 3. Effect of ionophore-induced Ca2+ loads on the ATP content of AA RBCs in the absence and presence of 1 mM sodium orthovanadate in the RBC suspension. Results shown are from 1 experiment using the same conditions as those in the flow cytometry experiments (Figure 2, [K+]o = 15 mM). Almost identical results were obtained in 2 additional experiments with Ko = 80 mM. The ATP content of the RBCs was related to the measured hemoglobin concentration in a parallel sample and is expressed per 340 g Hb, assumed equivalent of 1 L packed normal RBCs. The 1 mM vanadate inhibited more than 99% of PMCA-mediated Ca2+ transport and ATP consumption by the pump.53 Note the steep fall in ATP content in the controls immediately after Ca2+ permeabilization, the period during which dehydration rates were measured, and the contrasting conservation of ATP levels in the presence of vanadate. Despite such differences, the conditions with and without vanadate, described in Table 1 and Figure 2, showed very similar results.](https://ash.silverchair-cdn.com/ash/content_public/journal/blood/105/1/10.1182_blood-2004-01-0125/6/m_zh80010571580003.jpeg?Expires=1766319796&Signature=AsLcmT7mlv0ZrqNdiS5afMA5vKL8G3Q1lwXO8Yej-3X-2oRwCbVEoFjDl84sQkNan2-BoP50-rWqo2rIlht5oyMo2UYdqr7NQ8lbZ1T1S2xay2TceFqlqyGBaqlbGEwEJM0GIm~bNWi4hOWWcb4nLgD04IoAY1wCFLddo7HOgARcXd14DchWd9OQ3zyB1hGAbDZG3oLu2Qn-6If5Z368SIVSGTz2TG6O9Wc0h6pYI9EvsuaKHXxuW4PNf6tp3Qy6oMYF~Ns3ChRG078ikotLb4EwPrrWzNfJ4gkczU8rkD2bjIBFeRNohNtFfKcaTbr2uI1ScGa2RCbmJfAxQcX0jA__&Key-Pair-Id=APKAIE5G5CRDK6RD3PGA)