Abstract
The main targets for the immunosuppressive calcineurin inhibitors, cyclosporin A (CsA) and tacrolimus, have been considered to be activated T cells, but not antigen-presenting cells. Here we demonstrate that CsA and tacrolimus, but not rapamycin, inhibit major histocompatibility complex (MHC)–restricted antigen presentation in dendritic cells (DCs). Microencapsulated ovalbumin (OVA) was efficiently captured, processed, and presented on both class I MHC molecules (cross-presentation) as well as on class II MHC molecules. Addition of CsA and tacrolimus, but not rapamycin, to cultures of DCs inhibited both the class I processing pathway and the class II processing pathway of exogenous OVA. In addition, CsA and tacrolimus, but not rapamycin, also inhibited the classic class I processing pathway of endogenous OVA. CsA and tacrolimus did not inhibit presentation of exogenously added OVA peptide, SIINFEKL, phagocytic activity of DCs, or the total level of expression of class I MHC (H-2Kb) molecules. CsA and tacrolimus, however, inhibited profoundly the expression of SIINFEKL-H-2Kb complexes in OVA-phagocytized DCs. These results demonstrate clearly that CsA and tacrolimus inhibit intracellular processing events of antigens, and further suggest that the immunosuppressive activity of CsA and tacrolimus is at least in part due to inhibition of antigen processing pathways.
Introduction
Dendritic cells (DCs) play a key role in the initiation of primary immune responses.1 DCs can acquire and process antigens in the periphery, and migrate to secondary lymphoid tissues where they prime primary T-cell responses. Two distinct pathways have been known for the presentation of antigenic peptides on major histocompatibility complex (MHC) molecules.2 Exogenous antigens internalized by phagocytosis or endocytosis are normally processed and loaded on class II MHC molecules in a post-Golgi compartment. In contrast, endogenous antigens are partially digested by proteosome, transferred into endoplasmic reticulum (ER) by a transporter associated with antigen presentation (TAP), and then loaded on class I MHC molecules. It is also known that DCs can uptake antigens from cells undergoing apoptosis or necrosis for presentation to class I MHC–restricted cytotoxic T lymphocytes (CTLs). This form of antigen presentation has been termed “cross-presentation.” Cross-presentation has been demonstrated to occur for many viral antigens and also for tumor antigens.3,4 Cross-presentation may be a mechanism by which naive T cells can be primed to antigens that are present in nonprofessional antigen-presenting cells (APCs). In the absence of such a mechanism, viral or tumor antigens expressed in nonprofessional APCs could escape immunosurveillance because CTL responses can only be induced efficiently for the antigens presented via class I MHC molecules on professional APCs.5-7
Thus far, the main cellular targets for CsA and tacrolimus have been considered to be activated T cells, but not APCs.8 Even though chemically unrelated, CsA and tacrolimus bind to and inhibit the same protein, calcineurin, in a calcium-dependent signaling pathway after formation of a complex with cyclophilin A and FK-506 binding proteins (FKBPs), respectively, resulting in inhibition of the transcription of interleukin 2 (IL-2) and other lymphokines.9,10 Rapamycin has structural similarity with tacrolimus and even forms a complex with the same FKBPs that form a complex with tacrolimus.11 However, the FKBP-rapamycin complex interacts with a protein distinct from calcineurin, termed the mammalian target of rapamycin, mTOR.12 Rapamycin suppresses T-cell activation at a different level, mainly through inhibition of cell-cycle progression via suppression of p70 S6 kinase activation induced by growth-promoting lymphokines.8
Because T-cell responses can only be initiated on recognition of peptide-MHC complexes presented by professional APCs, inhibitors of antigen processing pathways would suppress many cellular immune reactions mediated by T cells or T-cell products. In the present study, we demonstrate that immunosuppressive calcineurin inhibitors, CsA and tacrolimus, inhibit MHC-restricted antigen presentation pathways in DCs. Rapamycin, which suppresses T-cell responses via different mechanisms, did not inhibit antigen presentation pathways. In agreement with general acceptance that tacrolimus is much more active than CsA in suppressing immune responses, tacrolimus was approximately 80- to 100-fold more active than CsA in inhibiting antigen presentation pathways. Our findings provide new insight not only for the mechanism of action of the immunosuppressive calcineurin inhibitors, but also for the design of DC-based immunoregulation strategies.
Materials and methods
Cell lines
A DC cell line, DC2.4, was obtained from Dana-Farber Cancer Institute (Boston, MA).13 A T-cell hybridoma, B3Z86/90.14 (B3Z), was kindly provided by Dr Nilabh Shastri (University of California, Berkeley).14 A B-cell hybridoma, 25-D1.16 clone 21, was kindly provided by Dr Jonathan W. Yewdell (National Institutes of Health, Bethesda, MD).15
Generation of DCs from bone marrow cells
DCs were generated as described previously.16 Briefly, total bone marrow (BM) cells obtained from femurs of Balb/c or C57BL/6 mice were cultured in a 6-well plate (5 × 10⁶/well) in a culture medium supplemented with 400 U/mL recombinant murine granulocyte macrophage–colony-stimulating factor (rmGM-CSF; PeproTech) and 200 U/mL rmIL-4 (PeproTech). At day 2 and day 4 from the initiation of the culture, nonadherent cells were discarded by replacing the culture medium with fresh medium containing the cytokines after gentle shaking. DCs were harvested by gentle pipetting at day 6.
Preparation of microencapsulated ovalbumin
Ovalbumin (OVA)–containing microspheres were prepared by a solvent-evaporation method.17 Briefly, OVA was dissolved in 3% polyvinyl alcohol (4 mg/mL), and poly(L-lactic acid) (PLA) was dissolved in a mixture of acetone and ethanol (9:1; 5%). These 2 solutions, 150 mL OVA solution and 30 mL PLA solution, were mixed slowly and emulsified by a continuous stirring overnight at room temperature. The hardened microspheres were collected by centrifugation at 10 000g (12 000 rpm), washed twice with phosphate-buffered saline (PBS), and then stored at -70°C. The concentration of OVA was determined by micro-bicinchoninic acid assay kit (Pierce, Rockford, IL) according to the manufacturer's instructions after lysing the microspheres in a lysis buffer containing 0.1% sodium dodecyl sulfate (SDS) and 0.1 N sodium hydroxide (NaOH).
Cross-presentation assay
DCs were treated with mitomycin C (20 μg/mL) for 20 minutes, washed 3 times with a complete medium, and then added to a 96-well microtiter plate (4 × 10⁴/well). The plate was incubated for 2 hours at 37°C, and then added with different amounts of OVA microspheres and immunosuppressive agents. After a 2-hour incubation at 37°C, unphagocytized OVA microspheres and immunosuppressive drugs were removed by suction. The plate was then washed twice with 300 μL/well of prewarmed Dulbecco modified Eagle medium (DMEM), and B3Z cells were added (1 × 10⁵/well). After incubating for 4 hours at 37°C, the plate was centrifuged at 400g (1800 rpm), and the culture supernatant was discarded by suction. Then, 50 μL/well lysis buffer (0.1% Triton X-100, 250 mM Tris, pH 8.0) was added to the plate, the plate was frozen at -70°C and thawed at room temperature, and then added sequentially to the plate were 50 μL/well PBS containing 0.5% bovine serum albumin and 100 μL/well substrate solution (1 mg/mL chlorophenolred β-d-galactopyranoside) dissolved in β-galactosidase buffer (60 mM sodium dibasic phosphate buffer, pH 8, 1 mM magnesium sulfate, 10 mM KCl, 50 mM β-mercaptoethanol). The plate was incubated at 37°C for 12 to 18 hours until color development reached a proper level, and the intensity of color development was measured at 580 nm using a microtiter plate reader.
MHC class I–restricted presentation assay of cytosolic OVA
DCs treated with mitomycin C were incubated with different concentrations of immunosuppressive drugs for 2 hours at 37°C, washed, and then loaded with soluble OVA by osmotic shock by the same methods as described earlier.18 OVA-loaded DCs were added to a 96-well microtiter plate (8 × 10⁴/well), incubated for 2 hours at 37°C, and B3Z cells (1 × 10⁵/well) were added. After incubating for 4 hours at 37°C, the level of expression of β-galactosidase was assayed as described in the cross-presentation assay.
Isolation of CD4 T cells
Single-cell suspension was prepared from the spleens of DO11.10 mice by lysing red blood cells with ACK lysis buffer (0.15 M NH4Cl, 1.0 mM KHCO3, 0.1 mM EDTA [ethylenediaminetetraacetic acid]) for 3 minutes. Cells were added to a nylon wool column, and incubated for 2 hours at 37°C to remove adherent cells. Adherent cell–depleted spleen cells were incubated with a mixture of cell-free supernatants of clones 25-9-3S (HB-38; ATCC, Rockville, MD), J11d (TIB-183; ATCC), and 3.155 (TIB-211; ATCC) on ice for 30 minutes, and then treated with 1:10 diluted Low-Tox-M rabbit complement (Cederline Laboratories, Ontario, ON, Canada) for 30 minutes at 37°C.
MHC class II–restricted presentation assay
DCs treated with mitomycin C were added to a 96-well microtiter plate (4 × 10⁴/well), incubated for 2 hours at 37°C, and then different amounts of OVA microspheres and immunosuppressive agents were added. After a 2-hour incubation at 37°C, unphagocytized OVA microspheres and immunosuppressive drugs were removed by suction. The plate was then washed twice with 300 μL/well of prewarmed DMEM, and OVA-specific CD4 T cells (1 × 10⁵/well) isolated from the spleens of DO11.10 mice were added. After a 48-hour incubation at 37°C, the plate was centrifuged at 400g (1800 rpm), and the culture supernatant was collected and assayed for IL-2 content using an IL-2 ELISA kit (BD Biosciences, San Jose, CA).
Phenotypic analysis
Cells were stained with monoclonal antibodies recognizing murine cell surface markers as described previously,16 and flow cytometric analysis was performed on a FACS Calibur (Becton Dickinson, San Jose, CA). The monoclonal antibody, anti-H2-Kb (clone AF6-88.5), and an isotype-matched control antibody were purchased from BD Biosciences. The monoclonal antibody, 25-D1.16, was purified from ascitic fluid collected from mice injected with 25-D1.16 clone 21 cells, and then digested with pepsin to obtain F(ab′)2 fragments. Fluorescein isothiocyanate (FITC)–labeled anti–mouse IgG1 antibody was purchased from BD Biosciences.
Results
DCs present exogenous OVA on both class I and class II MHC molecules
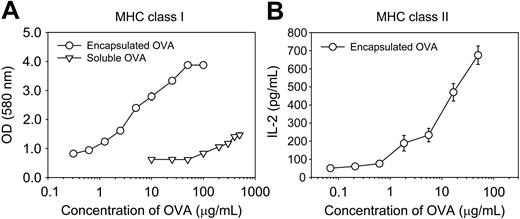
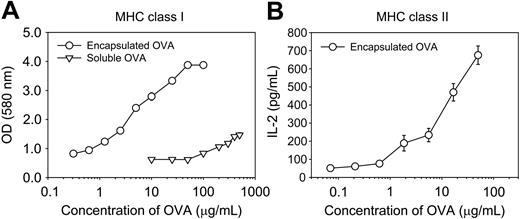
We first established methods that can compare the amount of OVA peptide–MHC complexes on DCs. As a source of exogenous antigen, we used OVA that was microencapsulated with FDA-approved biocompatible/biodegradable polymer, PLA. For cross-presentation assays, DC2.4 cells (H-2b) or normal DCs generated from BM cells of C57BL/6 mice (H-2b) were incubated with OVA microspheres, and the amount of OVA peptide–class I MHC complexes was measured by a T-cell hybridoma, B3Z, which recognizes OVA (257-264) (SIINFEKL)–H-2Kb complex and expresses β-galactosidase.14 As shown in Figure 1A, a particulate form of OVA was efficiently captured, processed, and presented on class I MHC molecules. For class II MHC–restricted presentation assays, DCs generated from BM cells of Balb/c mice (H-2d) were incubated with OVA microspheres, and the amount of OVA peptide–class II MHC complex was measured by OVA-specific CD4 T cells isolated from the spleen of DO11.10 mice (H-2d). As shown in Figure 1B, microencapsulated OVA was also efficiently captured, processed, and presented on class II MHC molecules.
CsA and tacrolimus, but not rapamycin, inhibit cross-presentation of exogenous antigen
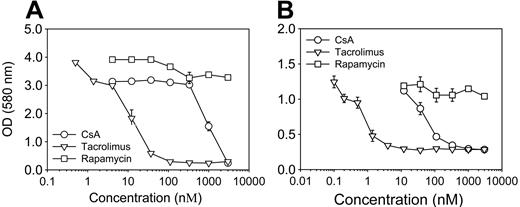
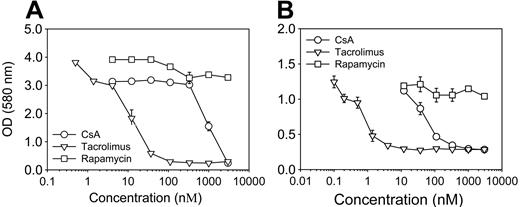
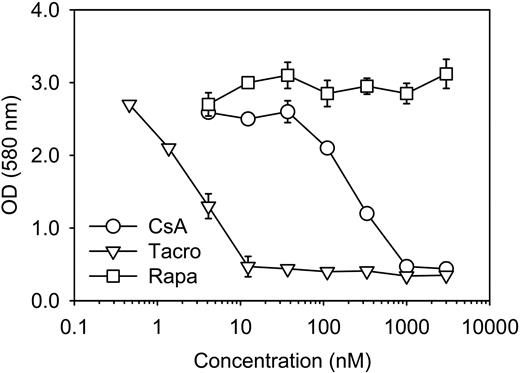
Using the methods described for Figure 1, we examined the effects of immnunosuppressive drugs on the MHC-restricted presentation of exogenous antigen. As shown in Figure 2A, CsAand tacrolimus, but not rapamycin, inhibited cross-presentation of exogenous OVA in DC2.4 cells. The 50% inhibitory concentrations (IC50s) of CsA and tacrolimus were approximately 850 nM and 11 nM, respectively. The cross-presentation inhibitory activity was also examined in normal DCs generated from BM cells of C57BL/6 mice. As shown in Figure 2B, CsA and tacrolimus, but not rapamycin, also inhibited cross-presentation in normal DCs. The IC50s of CsA and tacrolimus were approximately 65 nM and 0.8 nM, respectively. Thus, the intensity of cross-presentation inhibitory activity of CsAand tacrolimus was approximately 13 times stronger on normal DCs compared with their inhibitory activity on the virally transformed DC cell line, DC2.4.
Presentation of OVA peptides on both class I and class II MHC molecules by DCs phagocytized microencapsulated OVA. (A) Mitomycin C–treated DC2.4 cells (4 × 10⁴/well) were incubated with the indicated amount of soluble (▿) or microencapsulated OVA (○) for 2 hours, washed, and then cocultured for 4 hours with a T-cell hybridoma, B3Z cells (1 × 10⁵/well), which express β-galactosidase upon recognition of the OVA peptide, SIINFEKL, complexed with the H-2Kb molecule. The amount of β-galactosidase expressed in B3Z cells was determined by an enzymatic assay using chlorophenolred β-d-galactopyranoside as a substrate. Changes in optical density (OD) were measured at 580 nm. These results are representative of more than 10 experiments. (B) Mitomycin C–treated DCs (4 × 10⁴/well) generated from BM cells of Balb/c mice were incubated with OVA microspheres for 2 hours at 37°C, washed, and then CD4 T cells (1 × 10⁵/well) isolated from the spleens of DO11.10 mice were added. After a 48-hour incubation at 37°C, the culture supernatant was collected and assayed for IL-2 content using an IL-2 ELISA kit. These results are representative of more than 4 experiments. Each bar represents the mean ± SD of a triplicate experiment.
Presentation of OVA peptides on both class I and class II MHC molecules by DCs phagocytized microencapsulated OVA. (A) Mitomycin C–treated DC2.4 cells (4 × 10⁴/well) were incubated with the indicated amount of soluble (▿) or microencapsulated OVA (○) for 2 hours, washed, and then cocultured for 4 hours with a T-cell hybridoma, B3Z cells (1 × 10⁵/well), which express β-galactosidase upon recognition of the OVA peptide, SIINFEKL, complexed with the H-2Kb molecule. The amount of β-galactosidase expressed in B3Z cells was determined by an enzymatic assay using chlorophenolred β-d-galactopyranoside as a substrate. Changes in optical density (OD) were measured at 580 nm. These results are representative of more than 10 experiments. (B) Mitomycin C–treated DCs (4 × 10⁴/well) generated from BM cells of Balb/c mice were incubated with OVA microspheres for 2 hours at 37°C, washed, and then CD4 T cells (1 × 10⁵/well) isolated from the spleens of DO11.10 mice were added. After a 48-hour incubation at 37°C, the culture supernatant was collected and assayed for IL-2 content using an IL-2 ELISA kit. These results are representative of more than 4 experiments. Each bar represents the mean ± SD of a triplicate experiment.
CsA and tacrolimus, but not rapamycin, also inhibit class II MHC–restricted presentation of exogenous antigen
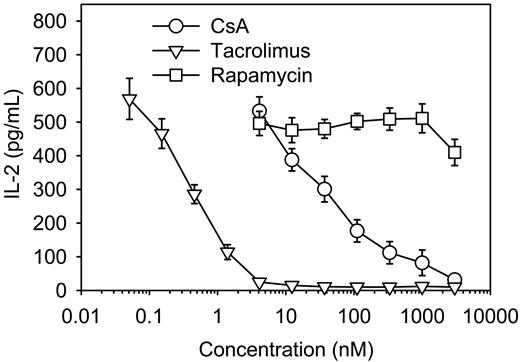
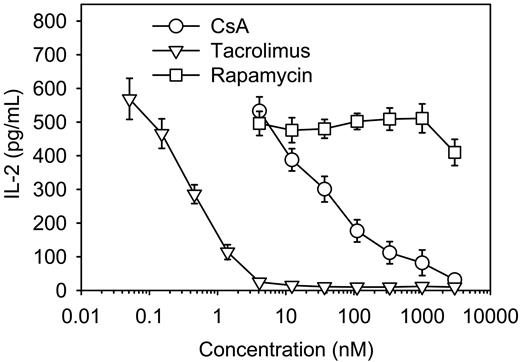
We also examined the effects of CsA, tacrolimus, and rapamycin on the class II MHC–restricted presentation of exogenous OVA in DCs generated from BM cells of Balb/c mice. As shown in Figure 3, CsA and tacrolimus, but not rapamycin, inhibited class II MHC–restricted presentation of exogenous OVA. The IC50s of CsA and tacrolimus were approximately 60 nM and 0.6 nM, respectively. Thus, it appears that CsA and tacrolimus inhibit at essentially the same concentrations both class I– and class II–restricted presentation pathways of exogenous antigen. In addition, consistent with general acceptance that tacrolimus is approximately 100-fold more active than CsA in suppressing immune responses, tacrolimus was approximately 80- to 100-fold more active than CsA in inhibiting MHC-restricted presentation of exogenous antigen.
Inhibition of class I MHC–restricted presentation of exogenous OVA by CsA and tacrolimus. Indicated amounts of CsA (○), tacrolimus (▿), or rapamycin (□) were added to cultures of DC2.4 cells (A) or BM-derived DCs (B) together with OVA microspheres (50 μg/mL). After 2 hours, unphagocytized OVA microspheres and immunosuppressive drugs were removed by washing, and then a cross-presentation assay was performed with B3Z cells as described in Figure 1A. Each data point represents the mean plus or minus the standard deviation (SD) of values obtained from 3 experiments.
Inhibition of class I MHC–restricted presentation of exogenous OVA by CsA and tacrolimus. Indicated amounts of CsA (○), tacrolimus (▿), or rapamycin (□) were added to cultures of DC2.4 cells (A) or BM-derived DCs (B) together with OVA microspheres (50 μg/mL). After 2 hours, unphagocytized OVA microspheres and immunosuppressive drugs were removed by washing, and then a cross-presentation assay was performed with B3Z cells as described in Figure 1A. Each data point represents the mean plus or minus the standard deviation (SD) of values obtained from 3 experiments.
Inhibition of class II MHC–restricted presentation of exogenous OVA by CsA and tacrolimus. Indicated amounts of CsA (○), tacrolimus (▿), or rapamycin (□) were added to cultures of DCs generated from BM cells of Balb/c mice together with OVA microspheres (50 μg/mL). After 2 hours, unphagocytized OVA microspheres and immunosuppressive drugs were removed by washing, and then a class II MHC–restricted presentation assay was performed with CD4 T cells isolated from the spleens of DO11.10 mice as described in Figure 1B. Each data point represents the mean plus or minus SD of values obtained from 3 experiments.
Inhibition of class II MHC–restricted presentation of exogenous OVA by CsA and tacrolimus. Indicated amounts of CsA (○), tacrolimus (▿), or rapamycin (□) were added to cultures of DCs generated from BM cells of Balb/c mice together with OVA microspheres (50 μg/mL). After 2 hours, unphagocytized OVA microspheres and immunosuppressive drugs were removed by washing, and then a class II MHC–restricted presentation assay was performed with CD4 T cells isolated from the spleens of DO11.10 mice as described in Figure 1B. Each data point represents the mean plus or minus SD of values obtained from 3 experiments.
CsA and tacrolimus, but not rapamycin, also inhibit classic class I MHC–restricted presentation of endogenous antigen
To examine whether endogenous antigen presentation pathway can also be inhibited by CsA and tacrolimus, the DC2.4 cells were treated with the immunosuppressive drugs for 2 hours, washed, and then soluble OVA was loaded into cytosol by osmotic shock. As shown in Figure 4, class I MHC–restricted presentation of cytosolic OVAwas also inhibited by CsA and tacrolimus, but not by rapamycin. The IC50s of CsA and tacrolimus were approximately 230 nM and 3 nM, respectively.
CsA and tacrolimus do not inhibit presentation of an exogenously added OVA peptide, SIINFEKL
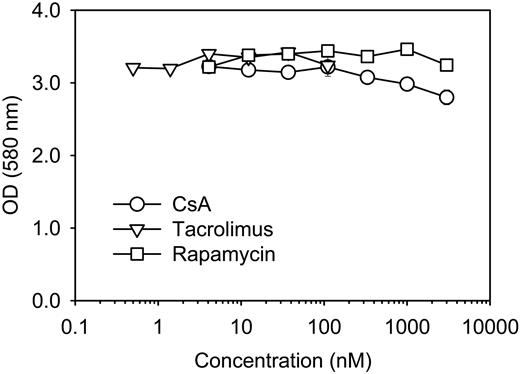
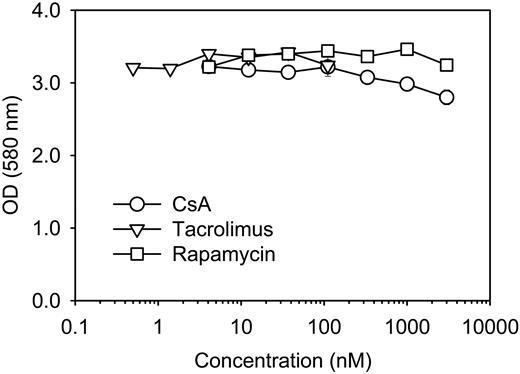
To prove that CsA and tacrolimus inhibit an intracellular event of the antigen processing pathways, DC2.4 cells were incubated with the H-2Kb–binding OVA peptide, SIINFEKL, in the presence of different concentrations of CsA or tacrolimus, washed, and then examined for their stimulatory activities on B3Z cells. As shown in Figure 5, CsA and tacrolimus did not inhibit presentation of the exogenously added synthetic peptide, SIINFEKL.
CsA and tacrolimus do not inhibit phagocytic activity of DCs
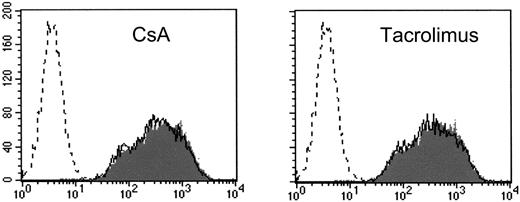
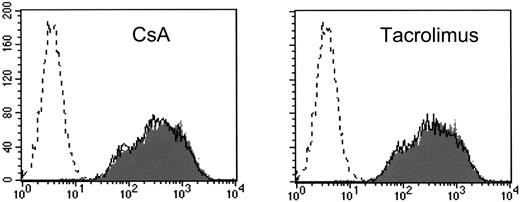
To test whether the antigen presentation inhibitory activity of CsA and tacrolimus was due to inhibition of phagocytic activity, DC2.4 cells were incubated with microspheres containing both OVA and FITC, washed, and then harvested by gentle pipetting after cooling on ice. Flow cytometric analysis of the harvested cells showed that CsA and tacrolimus did not inhibit phagocytic activity of DCs (Figure 6).
Inhibition of class I MHC–restricted presentation of endogenous OVA by CsA and tacrolimus. Indicated amounts of CsA (○), tacrolimus (▿), or rapamycin (□) were added to cultures of DC2.4 cells that were treated with mitomycin C and then loaded with soluble OVA by osmotic shock. After 2 hours, the cells were washed, and then class I MHC–restricted presentation assays were performed with B3Z cells as described in Figure 1A. Each data point represents the mean plus or minus SD of values obtained from 3 experiments.
Inhibition of class I MHC–restricted presentation of endogenous OVA by CsA and tacrolimus. Indicated amounts of CsA (○), tacrolimus (▿), or rapamycin (□) were added to cultures of DC2.4 cells that were treated with mitomycin C and then loaded with soluble OVA by osmotic shock. After 2 hours, the cells were washed, and then class I MHC–restricted presentation assays were performed with B3Z cells as described in Figure 1A. Each data point represents the mean plus or minus SD of values obtained from 3 experiments.
CsA, tacrolimus, or rapamycin do not inhibit presentation of an OVA peptide, SIINFEKL. Indicated amounts of CsA(○), tacrolimus (▿), or rapamycin (□) were added to cultures of DC2.4 cells together with the antigenic peptide of OVA, SIINFEKL. The cells were harvested, washed, and then the amount of SIINFEKL–H-2Kb complex was measured by the lacZ T-cell activation assay as described for Figure 1A. Each data point represents the mean plus or minus SD of values obtained from 3 individual experiments.
CsA, tacrolimus, or rapamycin do not inhibit presentation of an OVA peptide, SIINFEKL. Indicated amounts of CsA(○), tacrolimus (▿), or rapamycin (□) were added to cultures of DC2.4 cells together with the antigenic peptide of OVA, SIINFEKL. The cells were harvested, washed, and then the amount of SIINFEKL–H-2Kb complex was measured by the lacZ T-cell activation assay as described for Figure 1A. Each data point represents the mean plus or minus SD of values obtained from 3 individual experiments.
CsA and tacrolimus specifically inhibit the expression of SIINFEKL–H-2Kb complex
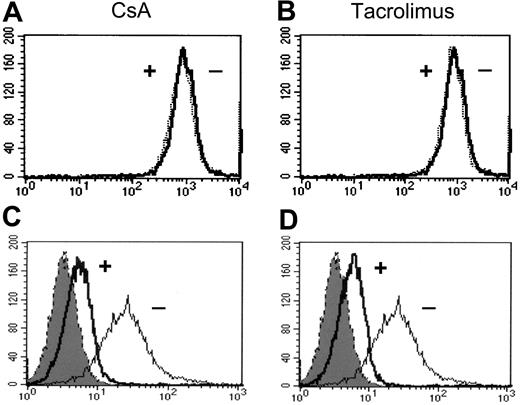
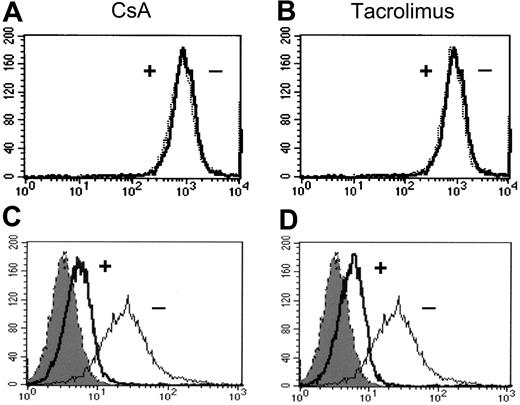
We first examined whether CsA and tacrolimus inhibited the expression of class I molecules on DCs. DC2.4 cells were incubated with CsA (3000 nM) or tacrolimus (100 nM) for 2 hours, and then the expression level of class I MHC molecules was determined by anti–H-2Kb monoclonal antibody. As shown in Figure 7A-B, the expression level of H-2Kb molecules was not decreased by CsA or tacrolimus to a discernable degree. We then examined whether CsA and tacrolimus inhibited the expression of OVA-specific class I MHC molecules. DC2.4 cells were incubated with CsA (3000 nM) or tacrolimus (100 nM) for 2 hours in the presence of OVA microspheres, washed, and then the expression level of SIINFEKL–H-2Kb complexes was determined by F(ab′)2 fragment of a SIINFEKL-H-2Kb–specific monoclonal antibody, 25-D1.16 (Figure 7C-D). We found that CsA and tacrolimus inhibited the expression of SIINFEKL–H-2Kb complexes profoundly.
Discussion
The major issue addressed in the present study was whether immunosuppressive agents such as CsA, tacrolimus, and rapamycin are able to inhibit MHC-restricted antigen processing pathways. We provided clear direct evidence for the first time as far as we know that CsA and tacrolimus, but not rapamycin, inhibit MHC-restricted antigen processing pathways in DCs. In all of the experiments described in the present study, DCs were exposed with the immunosuppressive drugs only for 2 hours in the presence of OVA microspheres. Thus, it is obvious that the inhibitory activity of CsA and tacrolimus on MHC-restricted antigen processing is initiated right after exposure to these drugs. The concentration of CsA and tacrolimus inhibiting MHC-restricted antigen processing is within clinically relevant ranges. For instance, in normal DCs, the IC50 of CsA for the inhibition of class I or class II MHC–restricted presentation was 60 nM to 65 nM, while the clinically relevant concentration of CsA is 0 nM to 1000 nM. The antigen processing inhibitory activity of CsA and tacrolimus is not due to the carryover of the immunosuppressive drugs to T-cell cultures as documented more clearly from OVA peptide pulsing experiments.
CsA and tacrolimus do not inhibit phagocytic activity of DCs. DC2.4 cells were incubated with microspheres containing both OVA and FITC in the presence or absence of CsA (3000 nM) or tacrolimus (100 nM) for 2 hours, washed, harvested, and then analyzed in a flow cytometry. Shaded histograms represent the phagocytic activity of DCs in the absence of CsA or tacrolimus, and thin line histograms represent the phagocytic activity of DCs in the presence of CsA or tacrolimus. DCs that were not incubated with FITC-labeled microspheres were shown as a dotted histogram.
CsA and tacrolimus do not inhibit phagocytic activity of DCs. DC2.4 cells were incubated with microspheres containing both OVA and FITC in the presence or absence of CsA (3000 nM) or tacrolimus (100 nM) for 2 hours, washed, harvested, and then analyzed in a flow cytometry. Shaded histograms represent the phagocytic activity of DCs in the absence of CsA or tacrolimus, and thin line histograms represent the phagocytic activity of DCs in the presence of CsA or tacrolimus. DCs that were not incubated with FITC-labeled microspheres were shown as a dotted histogram.
CsA and tacrolimus specifically inhibit the expression of SIINFEKL–H-2Kb complexes. DC2.4 cells were incubated with OVA microspheres in the presence (+) or absence (-) of CsA (3000 nM) or tacrolimus (100 nM) for 2 hours, and the expression levels of H-2Kb molecules (A,B) and SIINFEKL–H-2Kb complexes (C,D) were determined by monoclonal antibodies. In panels C and D, the shaded histograms represent DCs that were not incubated with OVA microspheres.
CsA and tacrolimus specifically inhibit the expression of SIINFEKL–H-2Kb complexes. DC2.4 cells were incubated with OVA microspheres in the presence (+) or absence (-) of CsA (3000 nM) or tacrolimus (100 nM) for 2 hours, and the expression levels of H-2Kb molecules (A,B) and SIINFEKL–H-2Kb complexes (C,D) were determined by monoclonal antibodies. In panels C and D, the shaded histograms represent DCs that were not incubated with OVA microspheres.
In the present study, class I MHC–restricted presentation of OVA peptide was measured with a T-cell hybridoma, B3Z, that expresses β-galactosidase by stimulation solely with the authentic `signal one' necessary for T-cell activation, which is the SIINFEKL–H-2Kb complex.14 Because costimulatory molecules are not essential in the induction of β-galactosidase in B3Z cells, the level of expression of β-galactosidase must be a direct reflection of the amount of SIINFEKL–H-2Kb complexes on DCs. In addition to B3Z β-galactosidase assays, class I MHC–restricted presentation of OVA peptide was also measured with a SIINFEKL-H-2Kb–specific monoclonal antibody, 25-D1.16. Class II MHC–restricted presentation of OVA peptide was measured with OVA-specific CD4 T cells. Using these methods, we demonstrated that both conventional and cross-processing for class I MHC and also processing for class II MHC are inhibited by CsA and tacrolimus.
There have been reports showing that prolonged exposure to CsA or tacrolimus suppresses several parameters of DC functions. DCs generated from monocytes with GM-CSF and IL-4 in the presence of CsA or tacrolimus were shown to be suppressed in allostimulatory capacity and production of cytokines such as tumor necrosis factor α (TNF-α) and IL-12, although DC development as judged from phenotypic markers including CD80, CD86, and class I and class II MHC molecules was not affected by these drugs.19,20 In contrast to DCs generated from monocytes, the DCs generated from BM progenitors with GM-CSF and IL-4 in the presence of CsAwere shown to be suppressed in the expression of costimulatory molecules such as CD80 and CD86, although expression of MHC molecules was not affected.21 Inhibition of costimulatory molecules such as CD80 and CD40 has also been reported for Langerhans cells (LCs) cultured with CsA or tacrolimus.22,23 As shown by these studies, the immunosuppressive activity of CsA and tacrolimus may be due partly to suppression of cytokine production and/or inhibition of expression of costimulatory molecules on DCs. Compared with these studies, one of the distinguishing features of the present study is that DCs were exposed to CsA or tacrolimus for only 2 hours in the presence of OVA microspheres. With this short duration of exposure, total level of expression of class I MHC molecules was not affected by these drugs, although expression of newly emerging OVA peptide–class I MHC complexes was reduced dramatically by these drugs.
Earlier studies have shown that rapamycin inhibits several parameters of DC function such as antigen uptake, cytokine secretion, and allogeneic T-cell stimulatory capacity.24,25 The present study, however, demonstrates no effect of rapamycin on MHC-restricted antigen presentation. This discrepancy may most probably be due to differences in the duration and timing of exposure of DCs to rapamycin. We treated DCs with rapamycin for only 2 hours, whereas others added rapamycin to DC-generating cultures for 5 to 7 days.24,25
Cross-presentation emerges as an obligatory mechanism for the generation of CTL responses to certain kinds of tumor cells and viruses.1-5,26,27 Then, prolonged inhibition of cross-presentation by CsA or tacrolimus would result in serious defects in the induction of CTL responses against tumor cells or viruses. In this regard, it is important to note that rapamycin does not inhibit cross-presentation. The fact that rapamycin does not inhibit cross-presentation might explain the apparent lack of tumorogenicity in rapamycin-treated mice as compared to calcineurin inhibitor–treated mice.28 The fact that CsA and tacrolimus, but not rapamycin, inhibit cross-presentation might also explain a recent observation, which showed that in mice bearing both tumor and allograft, CsA protected allografts from rejection with apparent promotion of tumor growth, whereas rapamycin protected allografts from rejection with apparent reduction of tumor.29
The precise mechanisms by which CsA and tacrolimus inhibit MHC-restricted antigen processing pathways remain to be determined. In this context, it is reasonable to speculate that the OVA microspheres used in the present study were phagocytized by DCs, processed, and then loaded on class II MHC molecules in a post-Golgi compartment. The intracellular processing pathway of exogenous OVA to class I MHC molecules, however, is not clear at present because at least 4 different processing pathways are known for loading of exogenous antigens on class I MHC molecules.2 Our preliminary data suggest that OVA microspheres are processed through the phagosome to the cytosol pathway as well as the endosomal pathway, because pretreatment of DCs with lactacystin, a proteosome inhibitor, inhibited class I MHC–restricted presentation of OVA microspheres. Our preliminary data also suggest that the intracellular calcium level does not play a significant role in cross-processing because addition of calcium-calmodulin inhibitor did not inhibit class I MHC–restricted presentation of OVA microspheres.
Prepublished online as Blood First Edition Paper, January 18, 2005; DOI 10.1182/blood-2004-10-3927.
Supported by in part by grant R01-2004-000-10184-0 from Korea Science and Engineering Foundation, and Molecular Medicine Research Group Program Grant M1-0106-00-0081 from the Ministry of Science and Technology, Korea.
Y.-R.L. and I.-H.Y. contributed equally to this work.
The publication costs of this article were defrayed in part by page charge payment. Therefore, and solely to indicate this fact, this article is hereby marked “advertisement” in accordance with 18 U.S.C. section 1734.
We thank Dr Scott K. Durum (National Cancer Institute, Frederick, MD) and Dr Matta Redi (Chungbuk National University, Cheongju, Korea) for critical reading and comments.

