Abstract
Resistance to l-asparaginase in leukemic cells may be caused by an elevated cellular expression of asparagine synthetase (AS). Previously, we reported that high AS expression did not correlate to l-asparaginase resistance in TEL-AML1–positive B-lineage acute lymphoblastic leukemia (ALL). In the present study we confirmed this finding in TEL-AML1–positive patients (n = 28) using microarrays. In contrast, 35 l-asparaginase–resistant TEL-AML1–negative B-lineage ALL patients had a significant 3.5-fold higher AS expression than 43 sensitive patients (P < .001). Using real-time quantitative polymerase chain reaction (RTQ-PCR), this finding was confirmed in an independent group of 39 TEL-AML1–negative B-lineage ALL patients (P = .03). High expression of AS was associated with poor prognosis (4-year probability of disease-free survival [pDFS] 58% ± 11%) compared with low expression (4-year pDFS 83% ± 7%; P = .009). We conclude that resistance to l-asparaginase and relapse risk are associated with high expression of AS in TEL-AML1–negative but not TEL-AML1–positive B-lineage ALL.
Introduction
l-asparaginase (l-Asp) is an enzyme widely used in chemotherapeutic protocols for treatment of children with acute lymphoblastic leukemia (ALL). In vitro and in vivo resistance to l-Asp correlates with a relatively poor prognosis in ALL.1,2 l-Asp depletes asparagine and glutamine in blood cells.3 Impaired capacity to synthesize sufficient amounts of asparagine due to reduced asparagine synthetase (AS) levels is thought to explain the l-Asp sensitivity of ALL cells to l-Asp treatment.4,5 l-Asp resistance is suggested to be caused by an elevated cellular level of AS.6
TEL-AML1–positive ALL patients are more sensitive to l-Asp compared with TEL-AML1–negative patients.7,8 However, we found a 5-fold higher expression of AS in the TEL-AML1–positive ALL patients compared with TEL-AML1–negative ALL patients,7 recently confirmed by Krejci et al.9 Therefore, within TEL-AML1–positive ALL, resistance to l-Asp is not associated with AS expression levels. Due to limited sample size in our previous study, it was unclear if this conclusion could be generalized for all other B-lineage ALL patients. Therefore, we investigated the relationship between AS expression and l-Asp resistance in 2 independent and larger groups of TEL-AML1–negative ALL patients.
Study design
Patient samples
Bone marrow and/or peripheral blood samples from 117 untreated children with TEL-AML1–negative and 28 untreated children with TEL-AML1–positive B-lineage ALL at initial diagnosis were collected at the Erasmus MC–Sophia Children's Hospital, by the Dutch Childhood Oncology Group, and by the German Cooperative Acute Lymphoblastic Leukemia (COALL) Study Group. Samples were collected after informed consent was obtained from patients or their parents or guardians, according to the Declaration of Helsinki. The informed consent was approved by the Medical Ethics Committee, Erasmus MC. In addition, samples from 17 TEL-AML1–negative ALL patients used in our previous study were included.7 Within 24 hours after sampling, mononuclear cells were isolated and total cellular RNA was extracted from a minimum of 5 × 10⁶ leukemic cells (≥ 90% leukemic cells) using Trizol reagent (Life Technologies, Gaithersburg, MD), as described before.7
Microarray analysis
RNA processing and hybridization to the U133A GeneChip oligonucleotide microarray (Affymetrix, Santa Clara, CA) was performed according to manufacturer's protocol. Data analysis was performed as described before.10 For this study, we limited the analysis to AS data in in vitro l-Asp–sensitive and –resistant TEL-AML1–positive (23 and 5 patients, respectively) and TEL-AML1–negative patients (43 and 35 patients, respectively).
Real-time quantitative polymerase chain reaction (RTQ-PCR)
The mRNA expression level of AS and an endogenous housekeeping gene encoding for GAPDH (glyceraldehyde-3-phosphate dehydrogenase) as a reference were quantified using real-time PCR analysis (Taqman chemistry) with efficiencies of at least 95%, as described before.7 The relative expression level of AS to GAPDH is calculated using the comparative cycle time method.7
In vitro l-Asp cytotoxicity assay
In vitro l-Asp (Paronal, Christiaens B.V., Breda, The Netherlands) cytotoxicity was determined using the MTT (3-(4,5-dimethylthiazol-2-yl)-2,5-diphenyl tetrazolium bromide) assay as described previously.7 Cutoff criteria for sensitive (LC50 < 0.033 IU/mL), intermediate sensitive, and resistant (LC50 > 0.912 IU/mL) toward l-Asp were as previously described.11 These 3 groups were associated with prognosis of ALL patients.11
Statistics
Differences in mRNA expression between groups of patients were analyzed using the Mann-Whitney U test. The correlation between AS expression and l-Asp resistance was calculated using the Spearman rank correlation test. Probability of disease-free survival (pDFS) was calculated from the date of diagnosis to the date of nonresponse, relapse, or last contact using the Kaplan-Meier method and compared by log-rank test. Multivariate analysis was performed with the Cox proportional hazard regression model.
Results and discussion
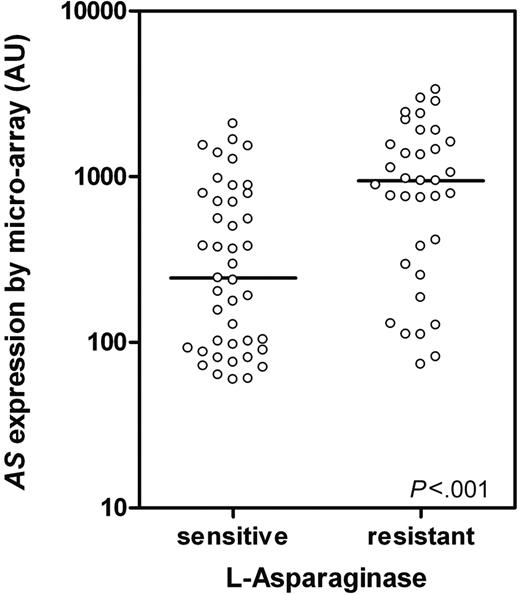
AS expression was analyzed with microarray technology in 78 TEL-AML1–negative and 28 TEL-AML1–positive ALL patients. No difference in AS expression between l-Asp–resistant (n = 5; median, 828 arbitrary units [AUs]; P25-P75: 164-1871) and l-Asp–sensitive (n = 23; median, 516 AUs; P25-P75: 141-689; P = 0.3) patients was found within TEL-AML1–positive ALL patients, which is in concordance with earlier findings from our lab and others.7,9 However, in TEL-AML1–negative ALL patients a significant 3.5-fold difference in AS expression was shown between l-Asp–resistant (n = 35; median, 946 AUs; P25-P75: 293-1617) and –sensitive (n = 43; median, 244 AUs; P25-P75: 92-787) patients (P < .001; Figure 1).
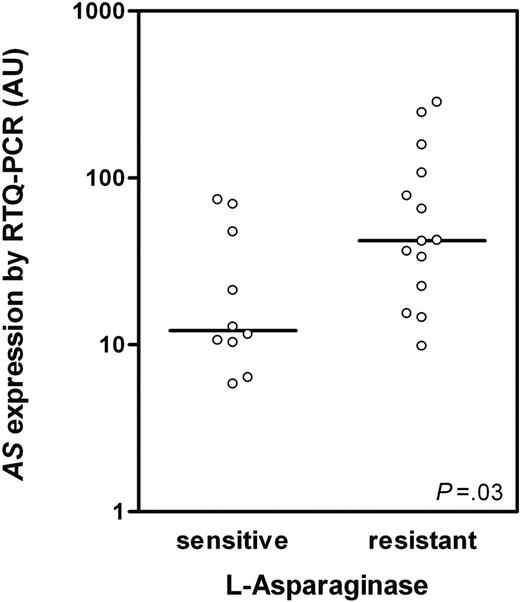
The original TEL-AML1–negative ALL patient group (n = 17) from our previous study7 was enlarged to a total of 39 patients (different patients than used for microarray analysis) and AS expression was analyzed by RTQ-PCR. A significant positive correlation was found between AS expression and l-Asp resistance (Rs = 0.39; P = .017). Patients were divided in 3 subgroups based on in vitro cellular toxicity to l-Asp (ie, 10 sensitive, 15 intermediate sensitive, and 14 resistant patients to l-Asp). A significant 3.5-fold higher AS expression was shown in l-Asp–resistant compared with l-Asp–sensitive TEL-AML1–negative ALL patients (P = .03; Figure 2), which is in concordance with our microarray data (Figure 1).
AS expression in TEL-AML1–negative ALL determined by microarray.AS expression in TEL-AML1–negative ALL patients sensitive (n = 43) and resistant to l-Asp (n = 35; P < .001) as determined by microarray analysis. ○ represents individual patients; bars represent the median values. AU indicates arbitrary units defined as scaled fluorescence measured on microarray.
AS expression in TEL-AML1–negative ALL determined by microarray.AS expression in TEL-AML1–negative ALL patients sensitive (n = 43) and resistant to l-Asp (n = 35; P < .001) as determined by microarray analysis. ○ represents individual patients; bars represent the median values. AU indicates arbitrary units defined as scaled fluorescence measured on microarray.
AS expression in TEL-AML1–negative ALL determined by RTQ-PCR.AS expression in TEL-AML1–negative ALL patients sensitive (n = 10) and resistant to l-Asp (n = 14; P = .03) as determined by RTQ-PCR. AS mRNA expression is indicated in arbitrary units (AUs) and defined as the mRNA expression of AS relative to GAPDH × 100. ○ represents individual patients; bars represent the median values.
AS expression in TEL-AML1–negative ALL determined by RTQ-PCR.AS expression in TEL-AML1–negative ALL patients sensitive (n = 10) and resistant to l-Asp (n = 14; P = .03) as determined by RTQ-PCR. AS mRNA expression is indicated in arbitrary units (AUs) and defined as the mRNA expression of AS relative to GAPDH × 100. ○ represents individual patients; bars represent the median values.
The mRNA expression level of AS does not necessarily correlate with protein level and enzyme activity of AS. However, Hutson et al12 showed in human leukemia cell lines that complete amino acid deprivation resulted in a simultaneous increase in AS mRNA, protein, and enzymatic activity, suggesting that mRNA corresponds to protein and activity levels.
Based largely on in vitro observations in (non) human leukemia cell lines, it has been hypothesized that elevated AS activity is a cause of l-Asp resistance in human leukemia cells lines.6,12-17 Only a few studies have reported this relation between AS expression and l-Asp sensitivity in patient materials.18,19 We and others showed previously that AS expression is not related to l-Asp sensitivity in TEL-AML1–positive ALL.7,9 We now confirmed this with a second method (ie, microarray analysis). In contrast, we show in 2 independent groups of patients studied by 2 different techniques (microarray and RTQ-PCR) that elevated AS expression is related to l-Asp resistance in TEL-AML1–negative ALL patients. This is in line with the in vitro observations in human and nonhuman leukemia cell lines.6,12-17
The 78 TEL-AML1–negative patients analyzed by microarray had a median follow-up of 4.4 years (range, 0.6-9.1 years) for patients at risk. The clinical characteristics of l-Asp–resistant and –sensitive patients were respectively as follows: white blood cell (WBC) count of median 25.6 × 10⁹/L (P25-P75: 7.7-52.0) and 26.8 × 10⁹/L (P25-P75: 8.8-73.2) (P = .8); age of median 8.0 (P25-P75: 4.5-11.5) and 4.0 years (P25-P75: 2.0-7.3) (P < .001). High AS expression (above median value) was associated with a poor prognosis (4-year pDFS 58% ± 11%) compared with low AS expression (4-year pDFS 83% ± 7%; P = .009). Furthermore, the AS expression in patients who relapsed (946 AUs, P25-P75: 305-2153) was 2.5-fold higher compared with patients who had not yet relapsed (379 AUs, P25-P75: 101-932; P = .01). Multivariate analysis including WBC count and age revealed that high AS expression is independently related to a poor prognosis (hazard ratio, 3.0; 95% confidence interval [CI], 1.1-7.9; P = .03). In contrast, we recently showed that the expression of AS in TEL-AML1–positive ALL is not related to outcome.20 Krejci et al9 even found the opposite: a relation between high AS expression and a good prognosis in TEL-AML1–positive ALL patients. These data suggest that the role of AS for l-Asp resistance and therapy is different between both genetic subtypes. Since the TEL-AML1 genotype is associated with an increased l-Asp sensitivity,7,8 the mechanism of action (and hence cause of resistance) may be different. A possibility might be the higher expression levels of the proapoptotic protein CD95 in TEL-AML1–positive ALL cells compared with TEL-AML1–negative ALL cells,21 since the CD95-mediated pathway is activated by cell shrinkage, which can be mediated by l-Asp.22 An alternative explanation might be that TEL-AML1–positive ALL cells are not able to provide sufficient amounts of the AS substrates aspartate and glutamine, due to different amino acid metabolism and/or transmembrane amino acid transporters that contribute to the function of AS.23 Further detailed studies are required to understand the observed difference between TEL-AML1–negative and –positive subtypes.
Appendix
DCOG members: Prof H. N. Caron; M. B. Bierings; Prof R. Pieters; Prof W. A. Kamps; Prof R. M. Egeler; Prof P. M. Hoogerbrugge; and G. J. L. Kaspers.
COALL members: Prof J. Otte; N. Jorch; H. J. Spaar; T. Lieber; Prof U. Göbel; G. Janßen; Prof J. F. Beck; S. Weigel; W. Streitberger; W. Nürnberger; C. von Klinggräff; K. Westerbeck; P. Thomas; S. Völpel; Prof D. Körholz; U. Bierbach; Prof P. Gutjahr; W. Müller; I. Althaus; Prof R. Roos; P. Klose; U. Graubner; I. Schmidt; H. Müller; R. Kolb; J. Wolff; O. Peters; J. Weber; and B. Dohrn.
Prepublished online as Blood First Edition Paper, February 17, 2005; DOI 10.1182/blood-2004-10-3892.
Supported by grants from the Sophia Foundation for Medical Research (SSWO grant 309) and the Pediatric Oncology Foundation (Rotterdam, The Netherlands).
The publication costs of this article were defrayed in part by page charge payment. Therefore, and solely to indicate this fact, this article is hereby marked “advertisement” in accordance with 18 U.S.C. section 1734.
We thank Myerling H. Cheok for her help in the analysis of microarray data and fruitful discussions on data interpretation. We wish to express our gratitude to the members of the Dutch Childhood Oncology Group (DCOG) and the German COALL Study Group for their support to this study by providing leukemic samples. Complete lists of the members of the DCOG and the German COALL Study group appear in the “Appendix.”


