Abstract
The Wiskott-Aldrich syndrome protein (WASp) is mutated in the severe immunodeficiency disease Wiskott-Aldrich syndrome (WAS). The function of B cells and the physiologic alterations in WAS remain unclear. We show that B cells from WAS patients exhibited decreased motility and had reduced capacity to migrate, adhere homotypically, and form long protrusions after in vitro culture. WASp-deficient murine B cells also migrated less well to chemokines. Upon antigen challenge, WASp-deficient mice mounted a reduced and delayed humoral immune response to both T-cell–dependent and –independent antigens. This was at least in part due to deficient migration and homing of B cells. In addition, the germinal center reaction was reduced in WASp-deficient mice. Thus, WASp is crucial for optimal B-cell responses and plays a pivotal role in the primary humoral immune response.
Introduction
Migratory and adhesive properties of immune cells are crucial in the battle against foreign microbes and pathogens. Dendritic cells deliver and present antigen for naive B and T cells in secondary lymphoid organs such as the spleen. Chemokine gradients are necessary for establishment of discrete B- and T-cell areas.1 In an immune response, antigen-specific B cells require help from T helper cells to become activated. B and T cells initially meet in the B/T-cell boundary area where T helper cells activate B cells through secretion of interleukins (ILs), such as IL-4, and via direct cell-to-cell contact through CD40–CD40 ligand interaction. The activated B cells thereafter undergo extensive proliferation and form germinal centers (GCs), a substructure of the follicles.
The Wiskott-Aldrich syndrome (WAS) is caused by mutations in the Wiskott-Aldrich syndrome protein (WASp).2 WAS patients display increased susceptibility to pyogenic, viral, and opportunistic infections and are predisposed to develop eczema, autoimmune, or lymphoproliferative disease.3,4 Exclusively expressed in hematopoietic cells, WASp normally exists in an inactive state caused by intramolecular protein folding that prevents its activation.5 Upon association with guanosine triphosphate (GTP)–bound Cdc42 and phosphatidylinositol-4,5-bisphosphate (PIP2), the C-terminus of WASp interacts with the Arp2/3 complex and with actin monomers, resulting in actin polymerization and consequent changes of cell shape and structure.5 Many different mutations in WASp have been characterized, leading to expression of truncated fragments or to lack of expression. A novel type of mutation (L270P) has been identified in patients suffering from severe congenital neutropenia.6 This mutation disrupts the critical autoinhibiting conformation of WASp and renders WASp constitutively active.
Early evidence for a cytoskeletal role of WASp in immune cells came from thorough analysis of patient blood lymphocytes, revealing abnormal cell surface architecture.7-9 However, a recent report suggests that fresh peripheral blood lymphocytes from WAS patients have normal numbers of microvillli.10 Results from WASp-null mice have shown significant impairment in T-cell activation and formation of the immunologic synapse.11-14 Natural killer cells, dendritic cells, macrophages, and hematopoietic stem cells have altered cytoskeletal responses.15-22 The evidence for malfunction of WASp-deficient B cells is contradictory. WAS patients respond poorly to T-cell–independent antigens, suggesting a role for B cells in disease development.3,4 One report shows impaired B-cell receptor triggering,23 whereas 3 others indicate normal activation.11,12,24 B-cell lines derived from WAS patients have reduced levels of F-actin,25 and B cells from WASp-null mice exhibit a lower cell polarization and spreading response.26
The B-cell contribution to development of WAS remains elusive. Furthermore, it is unclear how the absence of WASp in hematopoietic cells leads to immunodeficiency. In this paper, we have investigated the function of WASp-deficient B cells and their contribution to the in vivo immune response. We show that B cells from WAS patients fail to migrate and adhere properly. WASp deficiency in mice leads to reduced homing of B cells and a delayed GC response with lower production of antibodies. Our results emphasize the importance of correct B-cell migration and adhesion for an efficient humoral immune response.
Materials and methods
Patient samples
Peripheral blood was obtained from 2 healthy individuals (referred to as controls) and 2 patients with severe WAS phenotype, after informed consent was obtained. The WASP gene of patient 1 contains an intronic mutation (IVS9+2T>C) and patient 2 has a negative mutation (T284C). Both mutations lead to a WAS-null phenotype in which WASp expression is absent, as determined by Western blotting. Patient 1 has immunoglobulin A (IgA) 9.29 g/L (normal levels are 0.8-2.8 g/L) and IgM 0.58 g/L (normal levels, 0.5-1.9 g/L), and patient 2 has IgA 3.93 g/L and IgM 0.08 g/L. IgG levels and total B-cell numbers are within normal range (0.27 × 10⁹/L and 0.43 × 10⁹/L, respectively). Patient 3, who expresses WASp with an I294T substitution (referred to as WASI294T), suffers from severe neutropenia and trilineage bone marrow dysplasia, symptoms that are not typical of WAS. The I294T mutation disrupts the autoinhibited folding of WASp and renders it constitutively active (A.J.T., unpublished observation, August 2004). This study was performed according to the principles expressed in the Helsinki Declaration.
Mice
Mice were bred and maintained in the animal facility at the Department of Cell and Molecular Biology under specific pathogen-free conditions. WASp-deficient animals were kindly provided by Scott Snapper and Frederick Alt.11 WASp knock-out mice were bred with Balb/c mice to generate WASp-deficient mice and wild-type littermate controls. Mice were used at 6 to 12 weeks of age.
Analysis of homotypic aggregation
B cells from human peripheral blood mononuclear cells were isolated by positive selection using anti-CD19 conjugated magnetic beads according to the manufacturer's instructions (Dynal, Oslo, Norway). Cells were cultured at 0.5 × 10⁶ cells/mL in the presence of 30 μg/mL anti-CD40 monoclonal antibodies (mAbs; Mabtech AB, Stockholm, Sweden) and 3 ng/mL human recombinant IL-4 (Peprotech, Rocky Hill, NJ). On day 5, cells were fixed and examined under a Nikon Diaphot inverted microscope (Nikon, Goleta, CA) using a × 20 objective. Images were taken with a Nikon FX35WA camera. Cells were also prepared for electron microscopy and examined in a JEOL 100CX microscope (JEOL, Tokyo, Japan), as described previously.27
Chemotaxis and polarization
Chemotaxis assays were performed using 105 total B cells per Transwell unit, containing a 5-μm pore size membrane (Corning Costar, Vienna, Austria). Purified human peripheral blood B cells or murine splenic B cells (purified as previously described in Davey et al27 and Greicius et al28 ) were diluted in medium and loaded onto the Transwell filter. Chemokines, human CXC ligand 13 (CXCL13, 1 mg/mL), murine CXCL13 (750 μg/mL), CC ligand 19 (CCL19, 50 ng/mL), and CXCL12 (25 ng/mL) from R&D Systems (Minneapolis, MN) were added to the lower chamber. After indicated time points, the transmigrating population was collected and counted. For examination of B-cell polarization, human peripheral blood B cells were stimulated with IL-4 or anti-CD40 mAbs as described in the previous paragraph for 20 hours, thereafter fixed and counted.
Immunohistochemistry and plaque-forming cell (PFC) assay
Wild-type and WASp-deficient mice were immunized by intraperitoneal injection of sheep red blood cells (SRBCs) diluted 1:10 or 1:100 in phosphate-buffer saline. Mice were killed on different days after immunization and spleens were snap frozen in liquid nitrogen. Cryostat sections (10 μm) were fixed in ice-cold acetone and then stained in phosphate-buffer saline with 5% fetal calf serum (FCS) and 0.3% Tween. The following reagents were used for detection: biotinylated peanut agglutinin (PNA; Vector Laboratories, Burlingame, CA); phycoerythrin (PE)–labeled anti-B220 and cyanin 5 (Cy5)–labeled anti-CD3 antibodies (Caltag); fluorescein isothiocyanate (FITC)–labeled streptavidin (Dako A/S, Carpinteria, CA); PE-labeled anti-IgM and FITC-labeled IgD antibodies (BD Biosciences, San Jose, CA); MOMA-1 (a kind gift from John Kearney); and Alexa488-labeled secondary antibodies. Sections were mounted in Mowiol (Sigma-Aldrich, St Louis, MO). Images were captured using a Hamamatsu digital camera (Imaging Research, St. Catharines, ON, Canada) mounted onto a Leica DMRA2 microscope (Leica Microsystems AB, Sollentuna, Sweden) under a × 5 objective. The OpenLab software (Leica Microsystems AB) was used for image processing, whereas measurements were carried out using the ImageJ software. The B-cell, T-cell, and GC areas were measured on images of random sections and calculated as the percentage of total spleen area in a particular image. Thus, the percentage of B-cell, T-cell, and GC area was calculated in each image. A mean value of measurements from 3 images of each spleen was thereafter determined.
A modified version of the hemolytic PFC assay was used to detect single antibody secreting cells to SRBCs.29
ELISA
Mice were immunized by intraperitoneal injection of 2 μg native Dextran B512 (ICN Pharmaceuticals, Cleveland, OH). Serum levels of Dextran-specific total immunoglobulins were analyzed 6 or 9 days after immunization using enzyme-linked immunosorbent assay (ELISA), as described previously.30
Flow cytometry
Purified splenic B cells were cultured and fixed as described.26 On day 4, cells were stained intracellularly with biotin-labeled anti–mouse IgG2b or IgG1 antibodies (BD Biosciences) and FITC-labeled streptavidin. Fresh splenocytes were stained with FITC-labeled anti-CD23 (BD Biosciences) and PE-labeled anti-CD21 (a kind gift of John Kearney) antibodies. F-actin content was determined in Epstein-Barr virus (EBV)–transformed control or WASI294T B cells after paraformaldehyde fixation and Triton X-100 permeabilization. FITC-labeled phalloidin (Sigma-Aldrich) was added at 0.5 μg/mL. There were 3 different control cell lines used with similar results. The stained cells were thereafter analyzed by flow cytometry.
Transfer of cells
Spleen B cells from SRBC-immunized mice were purified on day 3 of the secondary response. The cells were fluorescently labeled with carboxyfluorescein diacetate succinimidyl ester (CFSE; Molecular Probes, Eugene, OR) and injected intravenously into wild-type recipients, which had received SRBCs 3 days previously. One day later, mice were killed and spleens prepared for immunohistochemistry. The numbers of transferred cells (CFSE labeled, in green) were counted in 3 images of each spleen.
Wild-type CD4+ T cells were adoptively transferred into wild-type or WASp-deficient recipient mice. One day after transfer, mice were immunized with SRBCs diluted 1:10. Spleens were analyzed on day 6 or 10 after SRBC immunization. To identify adoptively transferred cells in spleen, CD4+ T cells were labeled with CFSE and identified on spleen section one day after transfer.
Bone marrow reconstitution
Wild-type recipients received 900 rad total body irradiation divided in 2 doses. Bone marrow cells (5 × 10⁶) were injected intravenously into recipient mice. Mice were immunized with a 1:10 dilution of SRBCs 8 weeks after transplantation. Reconstitution efficiency was determined in a proliferation assay.31 Spleen cells were stimulated in plates with precoated anti-CD3 antibodies (BD Biosciences), concanavalin A (Con A), or phorbol myristate acetate (PMA)/ionomycin, and proliferation was measured on day 3.
Results
Human WASp-deficient B cells fail to form large homotypic aggregates and long protrusions
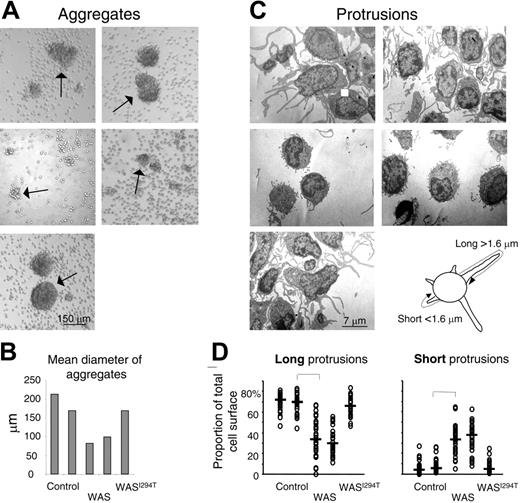
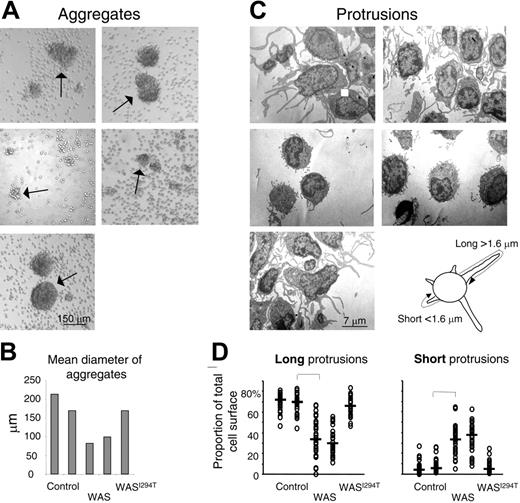
Murine WASp-deficient B cells activated with IL-4 and anti-CD40 mAbs are impaired in polarization and spreading.26 The cells also form smaller aggregates and have distorted cell surface microvilli. We wished to investigate if these deficiencies also are found in peripheral blood B cells from WAS patients. To this end, B cells from WAS patients or controls were stimulated in vitro with IL-4 and anti-CD40 mAbs for 5 days. The morphology of the cell aggregates was thereafter assessed. Control B cells formed large homotypic aggregates, whereas B cells from WAS patients formed fewer and smaller aggregates (Figure 1A-B). B cells from the patient suffering from severe neutropenia and trilineage bone marrow dysplasia, with a novel activating mutation in WASp (WASI294T), formed aggregates of similar size and morphology as those of control B cells.
Human WAS B cells fail to form large homotypic aggregates and long protrusions. Peripheral blood B cells from WAS patients, healthy controls, or the WASI294T patient were stimulated with IL-4 and anti-CD40 mAbs for 5 days. (A) The extent of B-cell aggregation was assessed on fixed cells and representative images captured using an inverted microscope. Arrows indicate aggregates. (B) Quantitative determination of mean aggregate diameter. Per group, 5 to 20 aggregates were measured. (C) Electron microscopy of activated B cells. Representative images are shown. (D) Quantitative determination of membrane protrusions. Images of 30 individual cells in each group were captured under the electron microscope. The total membrane length of long (longer than 1.6 μm) and short (shorter than 1.6 μm) protrusions was measured. The measurements were done to cover the entire length of each protrusion, as explained in the image above panel D. Each symbol represents the relative amount of membrane covering long or short protrusions in a particular cell. Brackets indicate a significant difference of P < .001 using a 2-tailed t test.
Human WAS B cells fail to form large homotypic aggregates and long protrusions. Peripheral blood B cells from WAS patients, healthy controls, or the WASI294T patient were stimulated with IL-4 and anti-CD40 mAbs for 5 days. (A) The extent of B-cell aggregation was assessed on fixed cells and representative images captured using an inverted microscope. Arrows indicate aggregates. (B) Quantitative determination of mean aggregate diameter. Per group, 5 to 20 aggregates were measured. (C) Electron microscopy of activated B cells. Representative images are shown. (D) Quantitative determination of membrane protrusions. Images of 30 individual cells in each group were captured under the electron microscope. The total membrane length of long (longer than 1.6 μm) and short (shorter than 1.6 μm) protrusions was measured. The measurements were done to cover the entire length of each protrusion, as explained in the image above panel D. Each symbol represents the relative amount of membrane covering long or short protrusions in a particular cell. Brackets indicate a significant difference of P < .001 using a 2-tailed t test.
When the morphology of aggregates was investigated by electron microscopy, we found a clear difference in the cell surface architecture. Control B cells formed many long protrusions, whereas the protrusions formed by WASp-deficient B cells were generally thinner and shorter (Figure 1C-D). The WASI294T B cells responded in a similar way to control B cells. Thus, functional WASp is necessary to form normal B-cell protrusions.
Reduced polarization and migration of human and murine WASp-deficient B cells
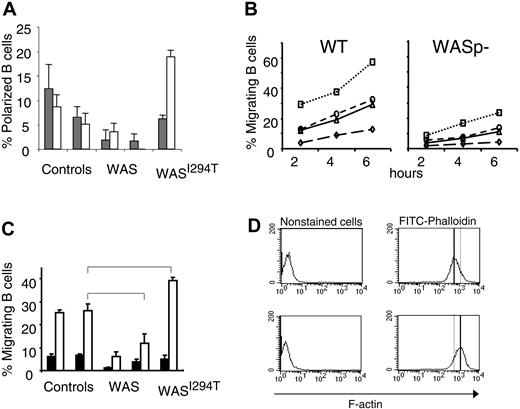
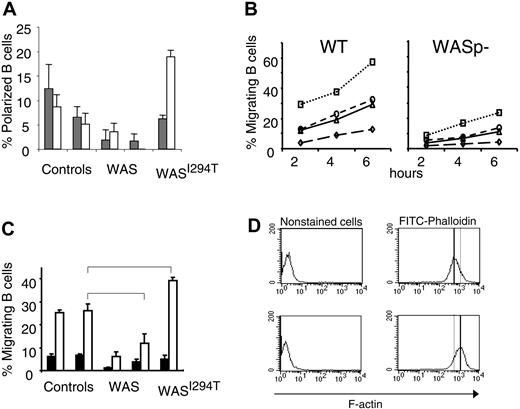
Impaired migration has been reported for many WASp-deficient immune cells, including T cells, macrophages, and dendritic cells, as well as hematopoietic stem cells.16-18,20,32 Murine B cells lacking WASp have also been shown to exhibit a reduced polarization response following IL-4 and CD40 ligation.26 We therefore investigated whether human WAS-deficient B cells showed a similar phenotype. We found that IL-4 and anti-CD40 induction of polarized WASp-deficient B cells was reduced in comparison with controls (Figure 2A). In contrast, cells expressing a constitutively active form of WASp exhibited increased polarization in response to anti-CD40 stimulation.
Reduced polarization and migration of human and murine WASp-deficient B cells. (A) B cells from WAS patients, controls, or the WASI294T patient were stimulated with IL-4 or anti-CD40 mAbs for 20 hours. Polarized cells were defined as having a tapered cell body and uropods, whereas nonpolarized cells were spherical in shape. Background values were between 15% to 20% and subtracted from the IL-4 and anti-CD40 values. Results are presented as mean values of triplicate cultures. Error bars indicate one SD. (B) Migration of murine B cells toward CXCL13, CXCL12, CCL19, or medium containing FCS (referred to as background) was determined in a Transwell assay. B cells were purified from wild-type (WT) or WASp-deficient (WASp–) spleens. B cells (100 000) were loaded on the filter in the upper chamber. Cells were allowed to migrate for 2 to 6 hours, after which the number of cells that had migrated to the lower chamber was determined. This observation is representative of at least 3 similar experiments. (C) B cells from WAS patients, controls, or the WASI294T patient were allowed to migrate toward CXCL13 or medium containing FCS (referred to as background). The migrating cell population was enumerated after 2 hours as in panel A. Results are presented as mean values of triplicate wells, error bars represent one SD, and brackets indicate a significant difference of P < .01 using a 2-tailed t test. (D) F-actin content in EBV-transformed control or WASI294T B cells. Note the increased F-actin content in WASI294T B cells. Upper images show control cells, and lower images, WAS-I294T cells.
Reduced polarization and migration of human and murine WASp-deficient B cells. (A) B cells from WAS patients, controls, or the WASI294T patient were stimulated with IL-4 or anti-CD40 mAbs for 20 hours. Polarized cells were defined as having a tapered cell body and uropods, whereas nonpolarized cells were spherical in shape. Background values were between 15% to 20% and subtracted from the IL-4 and anti-CD40 values. Results are presented as mean values of triplicate cultures. Error bars indicate one SD. (B) Migration of murine B cells toward CXCL13, CXCL12, CCL19, or medium containing FCS (referred to as background) was determined in a Transwell assay. B cells were purified from wild-type (WT) or WASp-deficient (WASp–) spleens. B cells (100 000) were loaded on the filter in the upper chamber. Cells were allowed to migrate for 2 to 6 hours, after which the number of cells that had migrated to the lower chamber was determined. This observation is representative of at least 3 similar experiments. (C) B cells from WAS patients, controls, or the WASI294T patient were allowed to migrate toward CXCL13 or medium containing FCS (referred to as background). The migrating cell population was enumerated after 2 hours as in panel A. Results are presented as mean values of triplicate wells, error bars represent one SD, and brackets indicate a significant difference of P < .01 using a 2-tailed t test. (D) F-actin content in EBV-transformed control or WASI294T B cells. Note the increased F-actin content in WASI294T B cells. Upper images show control cells, and lower images, WAS-I294T cells.
We next investigated the migration of WASp-deficient B cells in vitro. First, using murine splenic B cells, the migratory response to a series of chemokines (CXCL13, CCL19, and CXCL12) was reduced in the absence of WASp compared with control cells (Figure 2B). We tested whether the deficient migratory response was due to aberrant chemokine receptor expression. However, as judged by semiquantitative reverse transcriptase–polymerase chain reaction and immune cell staining, expression of CXC receptor 4 (CXCR4, ligand for CXCL12), CXCR5 (ligand for CXCL13), and CC receptor 7 (CCR7, ligand for CCL19) was similar in WASp-deficient and wild-type murine B cells (data not shown). We also investigated the migration of human WASp-deficient B cells to CXCL13. Approximately 25% of the control B-cell population migrated to CXCL13 (Figure 2C). However, the response of WASp-deficient B cells from 2 patients was reduced by more than half. Interestingly, compared with control B cells, a significantly increased number of B cells expressing a constitutively active form of WASp (WASI294T) migrated toward CXCL13 (40%). This was also associated with increased actin polymerization measured as F-actin content in EBV immortalized B-cell line (Figure 2D).
Together, these results reveal impaired motility and migration of both human and murine WASp-deficient B cells. Furthermore, our results suggested that constitutive activation of WASp increases the migratory/motile response of B cells.
WASp deficiency leads to abnormal spleen architecture with delayed GC reaction
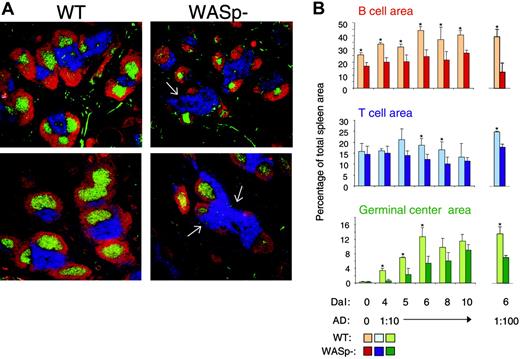
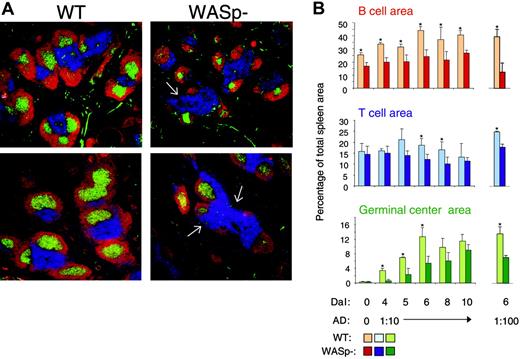
It was previously determined that T- and B-cell regions were reduced in spleens and lymph nodes from WAS patients. Also, progressive depletion of GCs was noticed.33,34 We next examined the spleen architecture in SRBC-immunized wild-type and WASp-deficient mice (Figure 3A-B). This antigen induces a potent immune response, which is partly T-cell dependent and partly independent. Compared with wild-type spleens, the B-cell areas were significantly reduced in WASp-deficient spleens at all times tested. Notably, the nonfollicular B cells (ie, those in the bridging channels surrounding the T-cell areas) were often completely absent in WASp-deficient spleens (shown by white arrows in Figure 3A). In wild-type spleens, the GC area rapidly increased upon antigen challenge and peaked on day 6. GCs also developed in WASp-deficient spleens, but they appeared with a slower kinetics than those in wild-type mice. The T-cell areas were only significantly different in size at 2 time points. A similar pattern was found after injection of a 10-fold lower, suboptimal antigen dose (Figure 3B).
WASp deficiency leads to abnormal spleen architecture with delayed GC reaction. Wild-type (WT) and WASp-deficient (WASp–) mice were immunized by intraperitoneal injection of SRBCs. Mice were killed on indicated days and cryostat sections of spleens were prepared. (A) Representative images of spleen sections are shown. Spleens were analyzed on day 5 or 10 after SRBC immunization (diluted 1:10). B- and T-cell areas were stained with PE-labeled anti-B220 (red) and Cy5-labeled anti-CD3 (blue) antibodies, respectively, and GCs were detected with biotinylated PNA, followed by streptavidin-FITC (green). (B) Quantitative determination of white pulp areas. Spleens from mice immunized with a 1:10 dilution of SRBCs (day 4 to 10) or a 1:100 dilution of SRBCs (on day 6) were analyzed. The B-cell, T-cell, and GC area was measured on images of random sections. The percentages of B-cell, T-cell, and GC areas of the total spleen area are shown. Each bar represents mean values from measurements of 3 different spleens. Error bars show one SD and asterisks indicate a significant difference of P < .05 using a 2-tailed t test. Presented results are representative of 3 similar experiments. Upper images show day 5, and lower images, day 10.
WASp deficiency leads to abnormal spleen architecture with delayed GC reaction. Wild-type (WT) and WASp-deficient (WASp–) mice were immunized by intraperitoneal injection of SRBCs. Mice were killed on indicated days and cryostat sections of spleens were prepared. (A) Representative images of spleen sections are shown. Spleens were analyzed on day 5 or 10 after SRBC immunization (diluted 1:10). B- and T-cell areas were stained with PE-labeled anti-B220 (red) and Cy5-labeled anti-CD3 (blue) antibodies, respectively, and GCs were detected with biotinylated PNA, followed by streptavidin-FITC (green). (B) Quantitative determination of white pulp areas. Spleens from mice immunized with a 1:10 dilution of SRBCs (day 4 to 10) or a 1:100 dilution of SRBCs (on day 6) were analyzed. The B-cell, T-cell, and GC area was measured on images of random sections. The percentages of B-cell, T-cell, and GC areas of the total spleen area are shown. Each bar represents mean values from measurements of 3 different spleens. Error bars show one SD and asterisks indicate a significant difference of P < .05 using a 2-tailed t test. Presented results are representative of 3 similar experiments. Upper images show day 5, and lower images, day 10.
The number of marginal zone (MZ) B cells is reduced in WASp-deficient mice
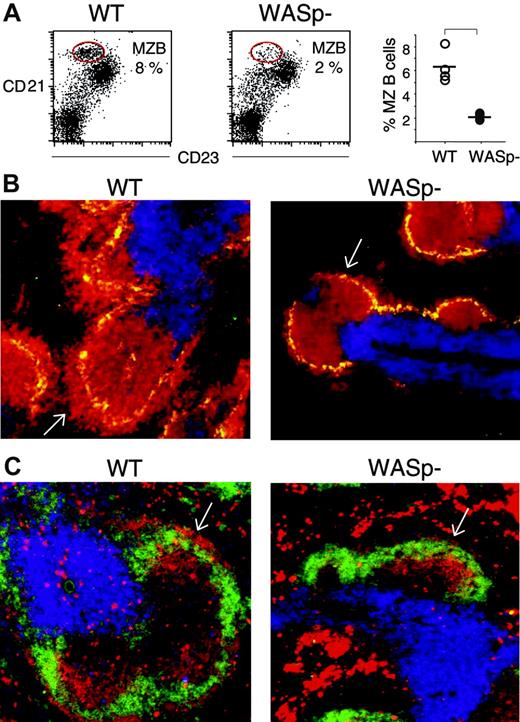
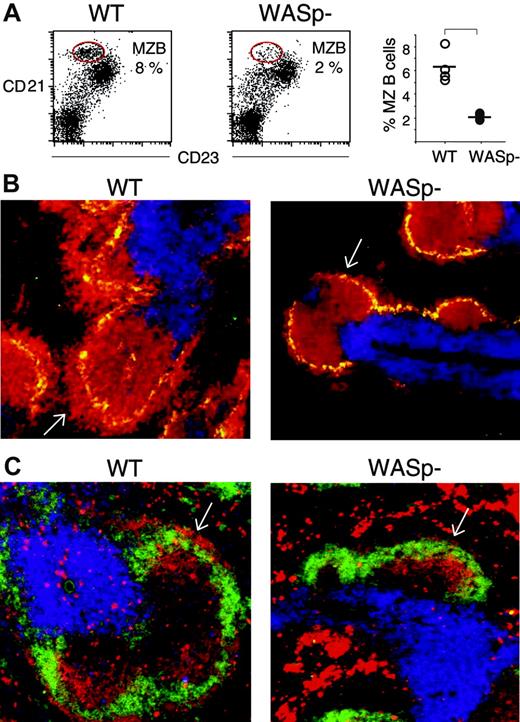
Recent evidence suggests that MZ B cells have a prominent function in the early immune response.35,36 We therefore investigated the MZ in more detail in wild-type and WASp-deficient spleens, using flow cytometry and immunohistochemistry. We found that wild-type splenic lymphocytes, from nonimmunized mice, contained a high proportion of MZ B cells (8%, encircled in Figure 4A), characterized by CD21highCD23low expression, as previously described.35 On the contrary, WASp-deficient splenic lymphocytes had markedly reduced numbers of MZ B cells (2%). The percentage of MZ B cells in 4 wild-type and 4 WASp-deficient spleens is depicted in the right-hand graph in Figure 4A. We also noticed an increased population of cells expressing intermediate levels of CD21 and low levels of CD23. We are unclear of the identity of these cells (Figure 4A). MZ B cells were further investigated in cryostat sections of spleens. MZ macrophages were detected using antibodies toward the MOMA-1 marker. A thick layer of MZ B cells (B220-positive cells) surrounded the MZ macrophages in wild-type spleen sections (white arrow in left part of Figure 4B). This layer was much reduced or absent in WASp-deficient spleens. Notably, the numbers and distribution of MOMA-1–positive MZ macrophages were similar in wild-type and WASp-deficient spleens. We also examined the MZ in immunized mice. On day 5 of the primary immune response to SRBCs, the characteristic MZ rim of IgMhighIgDlow B cells, as detected in wild-type spleens (indicated with white arrow in the left part of Figure 4C), was reduced or completely lacking in WASp-deficient spleens (white arrow in the right part of Figure 4C). However, the overall expression of IgM and IgD was not reduced in WASp-deficient B cells, as determined by flow cytometry (data not shown).
The number of marginal zone (MZ) B cells is reduced in WASp-deficient mice. The MZ B-cell population was detected as CD21highCD23low by either flow cytometry (A) or by counterstaining with the MZ macrophage-specific marker MOMA-1 (B), or as IgMhighIgDlow on spleen cryostat sections (C). (A) Spleen cells from nonimmunized wild-type (WT) and WASp-deficient (WASp–) mice were stained with PE-labeled anti-CD21 and FITC-labeled anti-CD23 antibodies, thereafter analyzed by flow cytometry using a gate for lymphocytes. The CD21highCD23low MZ B-cell populations are encircled in the left-hand graphs. Their percentage of the total lymphocyte population is indicated. The percentage of MZ B cells from 4 WT and 4 WASp– spleens is shown in the right-hand graph. The level of significance was calculated using a 2-tailed t test and the bracket indicates P < .001. Presented results are representative of 2 similar experiments. (B) Cryostat sections from nonimmunized WT and WASp– spleens were stained with PE-labeled anti-B220 (red) and Cy5-labeled anti-CD3 (blue) antibodies to detect B and T cells, respectively. MZ macrophages were detected with MOMA-1 antibodies followed by Alexa488-labeled secondary antibodies (green). The layer of B220+ B cells that surrounds the MZ macrophages is indicated with white arrows. Note the reduced thickness in the WASp– spleen section. (C) Cryostat sections of WT and WASp– spleens on day 5 in the immune response to SRBCs (diluted 1:10) were stained with PE-labeled anti-IgM (red) and FITC-labeled anti-IgD (green) antibodies to detect B cells. T-cell areas were detected using Cy5-labeled anti-CD3 (blue) antibodies. The rim of IgMhighIgDlow MZ B cells, localized at the outer border of the B-cell follicle, is indicated with white arrows. Note the reduction of IgMhighIgDlow MZ B cells in the WASp– spleen section.
The number of marginal zone (MZ) B cells is reduced in WASp-deficient mice. The MZ B-cell population was detected as CD21highCD23low by either flow cytometry (A) or by counterstaining with the MZ macrophage-specific marker MOMA-1 (B), or as IgMhighIgDlow on spleen cryostat sections (C). (A) Spleen cells from nonimmunized wild-type (WT) and WASp-deficient (WASp–) mice were stained with PE-labeled anti-CD21 and FITC-labeled anti-CD23 antibodies, thereafter analyzed by flow cytometry using a gate for lymphocytes. The CD21highCD23low MZ B-cell populations are encircled in the left-hand graphs. Their percentage of the total lymphocyte population is indicated. The percentage of MZ B cells from 4 WT and 4 WASp– spleens is shown in the right-hand graph. The level of significance was calculated using a 2-tailed t test and the bracket indicates P < .001. Presented results are representative of 2 similar experiments. (B) Cryostat sections from nonimmunized WT and WASp– spleens were stained with PE-labeled anti-B220 (red) and Cy5-labeled anti-CD3 (blue) antibodies to detect B and T cells, respectively. MZ macrophages were detected with MOMA-1 antibodies followed by Alexa488-labeled secondary antibodies (green). The layer of B220+ B cells that surrounds the MZ macrophages is indicated with white arrows. Note the reduced thickness in the WASp– spleen section. (C) Cryostat sections of WT and WASp– spleens on day 5 in the immune response to SRBCs (diluted 1:10) were stained with PE-labeled anti-IgM (red) and FITC-labeled anti-IgD (green) antibodies to detect B cells. T-cell areas were detected using Cy5-labeled anti-CD3 (blue) antibodies. The rim of IgMhighIgDlow MZ B cells, localized at the outer border of the B-cell follicle, is indicated with white arrows. Note the reduction of IgMhighIgDlow MZ B cells in the WASp– spleen section.
Production of antibodies by WASp-deficient mice is reduced and delayed
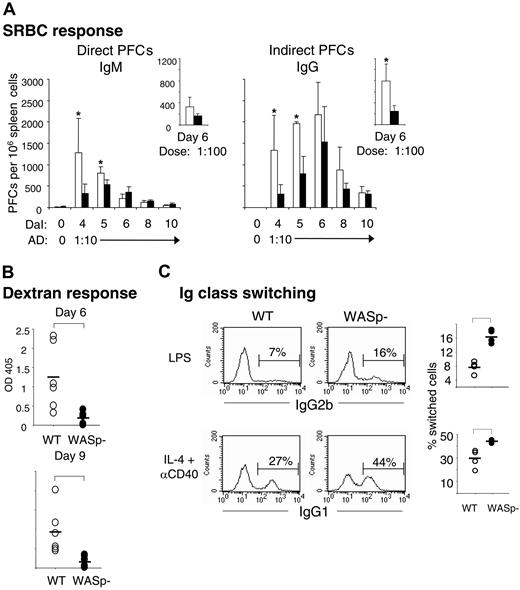
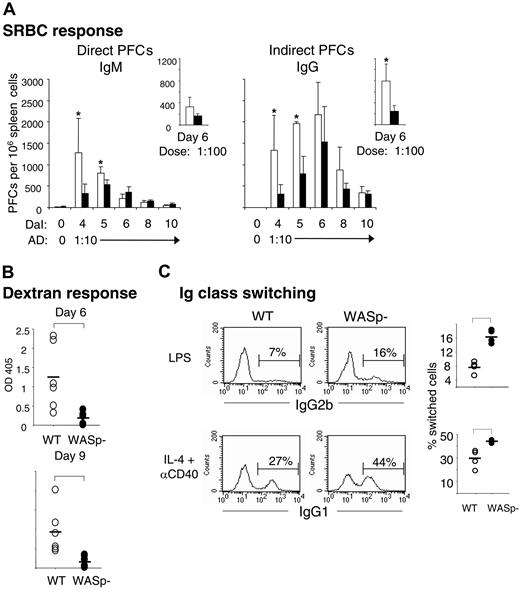
We next examined whether the reduction of B-cell and GC areas would be reflected in altered antibody-producing capacity of WASp-deficient mice. Individual antibody-secreting cells were enumerated from spleens of immunized wild-type and WASp-deficient mice, using the hemolytic plaque assay. Upon antigen challenge with SRBCs, B cells from wild-type spleens produced increased numbers of direct PFCs, corresponding to IgM-producing B cells, with a maximal response measured on day 4 (Figure 5A). Indirect PFCs, detecting IgG-producing cells, appeared with a slower kinetics and peaked on day 6 after immunization. In agreement with the delayed GC response, WASp deficiency led to significantly reduced numbers of IgM- and IgG-producing cells early in the immune response, on days 4 and 5. At later times, the response was not different from controls. When using a 10-fold lower antigen dose, the numbers of indirect PFCs from WASp-deficient spleens were significantly reduced also on day 6 (small right-hand graph in Figure 5A).
Production of antibodies by WASp-deficient mice is reduced and delayed, but class switching in vitro is enhanced. (A) Individual antibody-secreting cells were enumerated from spleens of immunized wild-type (WT) and WASp-deficient (WASp–) mice, using the hemolytic plaque assay. Mice were immunized by intraperitoneal injection of SRBCs, diluted 1:10 (results presented in large graphs) or 1:100 (small graphs). Numbers of direct PFCs detecting IgM-secreting cells and indirect PFCs detecting IgG-secreting cells are shown as a function of days after immunization (DaI). Each bar represents the mean value from at least 4 mice. Error bars show one SD and asterisks indicate a significance level of P < .05 using a 2-tailed t test. Presented results are representative of 2 similar experiments. AD indicates antigen dose. (B) Antibody response to the T-cell–independent antigen dextran. The 6 WASp– mice produced much less, if any, dextran-specific antibodies compared with 6 WT mice. Serum antibody titers were measured 6 or 9 days following intraperitoneal injection of 2 μg dextran. The dextran-specific immunoglobulins were analyzed in serum dilutions using ELISA. The level of significance was calculated using a 2-tailed t test and the bracket indicates P < .01. (C) Numbers of IgG2b- and IgG1-producing B cells. WT and WASp– B cells were cultured with LPS or IL-4 plus anti-CD40 mAbs for 4 days. IgG-producing cells were identified after intracellular staining and flow cytometry. The percentage of IgG2b- and IgG1-producing cells is indicated above the brackets in the histograms (left). The graphs to the right indicate the percentage of IgG2b- and IgG1-producing cells from 4 WT and 4 WASp– mice. Brackets indicate a significance level of P < .01 using a 2-tailed t test. The isotype-matched controls had less than 0.5% stained cells. Presented results are representative of 2 similar experiments.
Production of antibodies by WASp-deficient mice is reduced and delayed, but class switching in vitro is enhanced. (A) Individual antibody-secreting cells were enumerated from spleens of immunized wild-type (WT) and WASp-deficient (WASp–) mice, using the hemolytic plaque assay. Mice were immunized by intraperitoneal injection of SRBCs, diluted 1:10 (results presented in large graphs) or 1:100 (small graphs). Numbers of direct PFCs detecting IgM-secreting cells and indirect PFCs detecting IgG-secreting cells are shown as a function of days after immunization (DaI). Each bar represents the mean value from at least 4 mice. Error bars show one SD and asterisks indicate a significance level of P < .05 using a 2-tailed t test. Presented results are representative of 2 similar experiments. AD indicates antigen dose. (B) Antibody response to the T-cell–independent antigen dextran. The 6 WASp– mice produced much less, if any, dextran-specific antibodies compared with 6 WT mice. Serum antibody titers were measured 6 or 9 days following intraperitoneal injection of 2 μg dextran. The dextran-specific immunoglobulins were analyzed in serum dilutions using ELISA. The level of significance was calculated using a 2-tailed t test and the bracket indicates P < .01. (C) Numbers of IgG2b- and IgG1-producing B cells. WT and WASp– B cells were cultured with LPS or IL-4 plus anti-CD40 mAbs for 4 days. IgG-producing cells were identified after intracellular staining and flow cytometry. The percentage of IgG2b- and IgG1-producing cells is indicated above the brackets in the histograms (left). The graphs to the right indicate the percentage of IgG2b- and IgG1-producing cells from 4 WT and 4 WASp– mice. Brackets indicate a significance level of P < .01 using a 2-tailed t test. The isotype-matched controls had less than 0.5% stained cells. Presented results are representative of 2 similar experiments.
WAS patients often exhibit reduced responses to polysaccharide antigens.3,4 We therefore examined the response to a low dose of native dextran, a T-cell–independent antigen. We found that immunized wild-type mice produced dextran-specific serum antibodies on days 6 and 9 after immunization, as determined by ELISA (Figure 5B). Using immunohistochemistry, we detected small clusters of dextran-positive cells in the B220-positive B-cell follicles in spleen sections from wild-type mice (data not shown). On the contrary, WASp-deficient mice mounted a much reduced, if any, dextran-specific response (Figure 5B). In agreement, we did not detect any dextran-specific cells in spleen sections (data not shown).
WASp-deficient B cells go through Ig class switching in vitro
The reduced numbers of IgG-producing cells in WASp-deficient mice (Figure 5A) could be due to diminished capacity of B cells to go through class switching. To test this, we investigated class switching of cultured splenic B cells in vitro. B cells from wild-type or WASp-deficient spleens were stimulated for 4 days with lipopolysaccharide (LPS) or IL-4 plus anti-CD40 mAbs, the former induces class switching to IgG2b, the latter to IgG1. WASp-deficient B cells efficiently switched to both IgG2b and IgG1, as determined by intracellular staining and flow cytometry (Figure 5C). Interestingly, in comparison with the response of wild-type cells, a significantly higher proportion of WASp-deficient B cells had switched to IgG2b and IgG1, as indicated in the right-hand graph of Figure 5C.
Evidence for an intrinsic B-cell deficiency
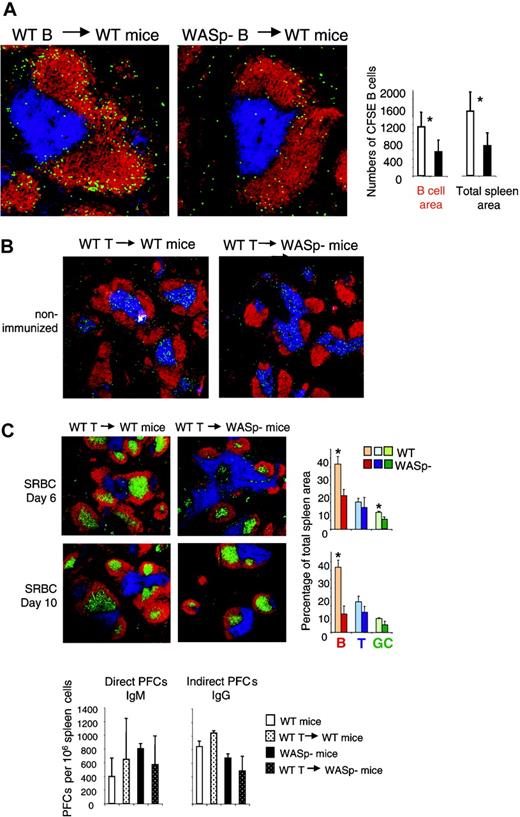
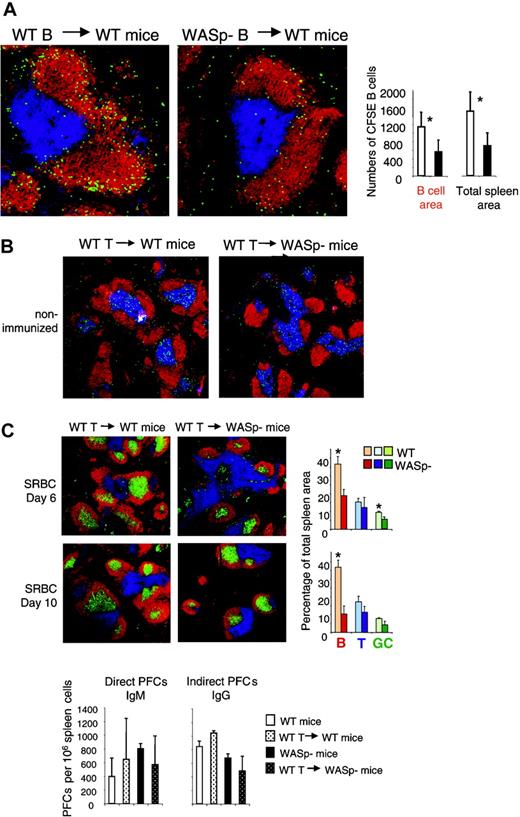
The results shown in Figures 3, 4 indicate that homing of B cells to the spleen was impaired in WASp-deficient mice. We wished to investigate whether this was due to intrinsic properties of WASp-deficient B cells. To produce a high proportion of antigen-specific B cells, wild-type and WASp-deficient mice were immunized twice with SRBCs. At 3 days after the second antigen injection, mice were killed and splenic B cells were purified. The cells were labeled with the fluorescent dye CFSE and transferred into wild-type recipients, which had received SRBCs 3 days previously. One day later, the recipients were killed and transferred B cells were identified on spleen cryostat sections as shown in Figure 6A. We found that WASp-deficient B cells homed less efficiently to the spleen, compared with wild-type B cells (Figure 6A). Among the B cells that entered the spleen, almost all localized in the B-cell follicles. This indicates that the WASp-deficient B cells had a significant migration deficiency.
Evidence for an intrinsic B-cell deficiency. (A) Transfer of B cells. Wild-type (WT) and WASp-deficient (WASp–) mice were immunized by intraperitoneal injection of SRBCs, diluted 1:10. This immunization was repeated 3 weeks later. On day 3 in the secondary response, donor B cells were purified from WT or WASp– spleens. CFSE-labeled donor cells (107) were adoptively transferred into WT recipients, which had received an SRBC injection 3 days earlier. One day later, spleens were taken out and cryostat sections prepared. Representative images of spleen sections are shown. CFSE-labeled transferred B cells are green. B- and T-cell areas are detected with PE-labeled anti-B220 (red) and Cy5-labeled CD3 (blue) antibodies, respectively. The graphs show quantitative determination of transferred B cells. The numbers of transferred B cells were counted in the B-cell areas as well as in the total spleen area. Each bar represents measurements from 4 mice. Error bars show one SD and asterisks indicate a significant difference of P < .01 using a 2-tailed t test. Presented results are representative of 2 similar experiments. (B) Transfer of T cells. WT CD4+ T cells (107) were adoptively transferred into WT or WASP– mice. The images show that transferred CFSE-labeled CD4+ T cells localize to the T-cell area of WT and WASp– spleens 24 hours after injection. (C) One day after transfer of unlabeled CD4+ T cells, mice were immunized with SRBCs diluted 1:10. Spleens were analyzed on day 6 or 10 after SRBC immunization. Representative images of spleen sections are shown. B- and T-cell areas were stained with PE-labeled anti-B220 (red) and Cy5-labeled anti-CD3 (blue) antibodies, respectively, and GCs were detected with biotinylated PNA, followed by streptavidin-FITC (green). Quantitative determination of white pulp areas is shown in the right-hand graphs. The B-cell, T-cell, and GC area was measured on images of random sections. The percentages of B-cell, T-cell, and GC areas of the total spleen area are shown. Each bar represents mean values from measurements of 3 different spleens. Error bars show one SD and asterisks indicate a significant difference of P < .05 using a 2-tailed t test. Numbers of direct PFCs detecting IgM-secreting cells and indirect PFCs detecting IgG-secreting cells are shown at day 6 after immunization. Each bar represents the mean value from 3 mice. Error bars show one SD. Presented results are representative of 2 similar experiments.
Evidence for an intrinsic B-cell deficiency. (A) Transfer of B cells. Wild-type (WT) and WASp-deficient (WASp–) mice were immunized by intraperitoneal injection of SRBCs, diluted 1:10. This immunization was repeated 3 weeks later. On day 3 in the secondary response, donor B cells were purified from WT or WASp– spleens. CFSE-labeled donor cells (107) were adoptively transferred into WT recipients, which had received an SRBC injection 3 days earlier. One day later, spleens were taken out and cryostat sections prepared. Representative images of spleen sections are shown. CFSE-labeled transferred B cells are green. B- and T-cell areas are detected with PE-labeled anti-B220 (red) and Cy5-labeled CD3 (blue) antibodies, respectively. The graphs show quantitative determination of transferred B cells. The numbers of transferred B cells were counted in the B-cell areas as well as in the total spleen area. Each bar represents measurements from 4 mice. Error bars show one SD and asterisks indicate a significant difference of P < .01 using a 2-tailed t test. Presented results are representative of 2 similar experiments. (B) Transfer of T cells. WT CD4+ T cells (107) were adoptively transferred into WT or WASP– mice. The images show that transferred CFSE-labeled CD4+ T cells localize to the T-cell area of WT and WASp– spleens 24 hours after injection. (C) One day after transfer of unlabeled CD4+ T cells, mice were immunized with SRBCs diluted 1:10. Spleens were analyzed on day 6 or 10 after SRBC immunization. Representative images of spleen sections are shown. B- and T-cell areas were stained with PE-labeled anti-B220 (red) and Cy5-labeled anti-CD3 (blue) antibodies, respectively, and GCs were detected with biotinylated PNA, followed by streptavidin-FITC (green). Quantitative determination of white pulp areas is shown in the right-hand graphs. The B-cell, T-cell, and GC area was measured on images of random sections. The percentages of B-cell, T-cell, and GC areas of the total spleen area are shown. Each bar represents mean values from measurements of 3 different spleens. Error bars show one SD and asterisks indicate a significant difference of P < .05 using a 2-tailed t test. Numbers of direct PFCs detecting IgM-secreting cells and indirect PFCs detecting IgG-secreting cells are shown at day 6 after immunization. Each bar represents the mean value from 3 mice. Error bars show one SD. Presented results are representative of 2 similar experiments.
We also investigated whether transferred WASp-deficient B cells localized to other organs than the spleen. However, we found very low numbers in the lymph nodes (too few to quantify). In addition, transferred wild-type as well as WASp-deficient B cells were virtually absent in the blood, lung, and liver (data not shown).
It is well established that WASp deficiency leads to reduced T-cell responses.8,9,11-14 Since the humoral responses to SRBC challenge are partly thymus-dependent, the reduced response in WASp-deficient mice might be due to insufficient T-cell help. To test this, we adoptively transferred H-2–matched wild-type T cells to WASp-deficient mice, one day before SRBC challenge. No effect on development of B-cell or GC areas on days 6 and 10 was observed (Figure 6C). There was also no restoration of the PFC response, even though the entry of T cells into the spleen was verified using CFSE labeling and tracing after 24 hours (Figure 6B-C).
Abolished immune response in mice reconstituted with WASp-deficient bone marrow
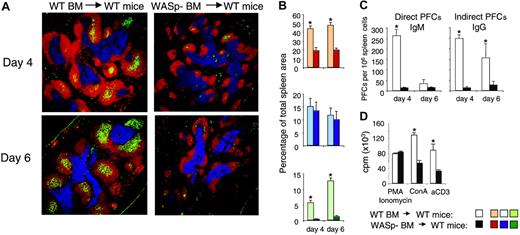
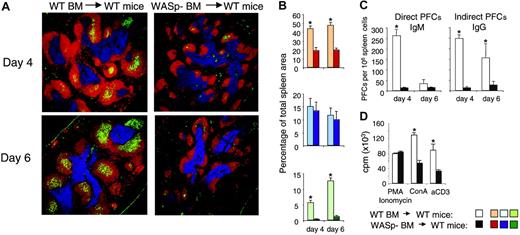
Using serial transplantations and competitive bone marrow reconstitution experiments, it was shown that bone marrow cells expressing WASp had a higher capacity to repopulate the spleen, compared with WASp-nonexpressing cells.22,31 This was not due to a lower number of hematopoietic stem cells in WASp knock-out bone marrow, but to reduced homing capacity of the WASp-negative stem cells.22 The results shown in Figure 6 imply that WASp-deficient mature B cells homed less efficiently to the spleen. We wished to test if homing of WASp-deficient B-cell precursors from bone marrow also was reduced. To elucidate this, we transferred bone marrow from wild-type or WASp-deficient mice into lethally irradiated wild-type recipients. Reconstituted mice were immunized by intraperitoneal injection of SRBCs 8 weeks after reconstitution, and the immune reaction in spleen was examined on day 4 and day 6 in the primary immune response. As expected, mice reconstituted with wild-type bone marrow mounted an immune response indistinguishable from mice that did not undergo transplantation, as determined by GC formation and numbers of antibody-producing cells (compare Figures 3 and 7). In contrast, mice receiving bone marrow from WASp-deficient mice failed to mount an immune response to SRBCs as determined by lack of GC and antibody-producing cells. Furthermore, although the T-cell areas were normal in size, B-cell areas were markedly reduced.
Abolished immune response in mice reconstituted with WASp-deficient bone marrow. Bone marrow cells from wild-type (WT) and WASp-deficient (WASp–) mice were injected intravenously into irradiated wild-type recipient mice. At 8 weeks after reconstitution, mice were immunized by intraperitoneal injection of SRBCs diluted 1:10. Spleens were analyzed on day 4 or 6 after immunization. (A) Representative images of spleen sections are shown. B-cell, T-cell, and GC areas were stained as in Figure 3. (B) Quantitative determination of white pulp areas. The B-cell, T-cell, and GC area was measured on images of random sections. The percentages of B-cell (top), T-cell (middle), and GC (bottom) areas of the total spleen area are shown. Each bar represents mean values from measurements of 4 (day 4) or 3 (day 6) different spleens. Error bars show one SD and asterisks indicate a significant difference of P < .01 using a 2-tailed t test. (C) Individual antibody-secreting cells were enumerated from spleens of immunized mice, using the hemolytic plaque assay. Numbers of direct PFCs detecting IgM-secreting cells and indirect PFCs detecting IgG-secreting cells are shown. Each bar represents the mean value from 4 (day 4) or 3 (day 6) mice. Error bars show one SD and asterisks indicate a significance level of P < .01 using a 2-tailed t test. (D) T-cell proliferation in reconstituted mice. T cells from spleens were stimulated with anti-CD3 antibodies (αCD3, 10 μg/mL) or concanavalin A (Con A, 4 μg/mL). Note the reduced proliferative response of T cells from recipients that received WASp– bone marrow. Equal levels of proliferation in response to PMA/ionomycin are used as a control for cell numbers. Each bar represents the mean value of triplicates; error bars show one SD; and asterisks indicate P < .01 using a 2-tailed t test.
Abolished immune response in mice reconstituted with WASp-deficient bone marrow. Bone marrow cells from wild-type (WT) and WASp-deficient (WASp–) mice were injected intravenously into irradiated wild-type recipient mice. At 8 weeks after reconstitution, mice were immunized by intraperitoneal injection of SRBCs diluted 1:10. Spleens were analyzed on day 4 or 6 after immunization. (A) Representative images of spleen sections are shown. B-cell, T-cell, and GC areas were stained as in Figure 3. (B) Quantitative determination of white pulp areas. The B-cell, T-cell, and GC area was measured on images of random sections. The percentages of B-cell (top), T-cell (middle), and GC (bottom) areas of the total spleen area are shown. Each bar represents mean values from measurements of 4 (day 4) or 3 (day 6) different spleens. Error bars show one SD and asterisks indicate a significant difference of P < .01 using a 2-tailed t test. (C) Individual antibody-secreting cells were enumerated from spleens of immunized mice, using the hemolytic plaque assay. Numbers of direct PFCs detecting IgM-secreting cells and indirect PFCs detecting IgG-secreting cells are shown. Each bar represents the mean value from 4 (day 4) or 3 (day 6) mice. Error bars show one SD and asterisks indicate a significance level of P < .01 using a 2-tailed t test. (D) T-cell proliferation in reconstituted mice. T cells from spleens were stimulated with anti-CD3 antibodies (αCD3, 10 μg/mL) or concanavalin A (Con A, 4 μg/mL). Note the reduced proliferative response of T cells from recipients that received WASp– bone marrow. Equal levels of proliferation in response to PMA/ionomycin are used as a control for cell numbers. Each bar represents the mean value of triplicates; error bars show one SD; and asterisks indicate P < .01 using a 2-tailed t test.
Discussion
The contribution of B cells for development of the immune deficiency in WAS has not been clearly defined. We provide evidence that B cells from patients with WAS exhibited lower motility, migratory and adhesive responses, as well as formation of morphologically abnormal protrusions. Furthermore, WASp deficiency in mice led to a compromised immune response in the spleen, as determined by B-cell recruitment, GC formation, and antibody production. The immune deficiency was particular evident in the early immune response and when a low antigen dose was administered. The response to both T-cell–dependent and –independent antigens was reduced, and for the latter, the response was almost completely abolished. The present study identifies WASp as a crucial component in the primary humoral immune response, as well as in correct migration, adhesion, and homing of B cells.
We have previously demonstrated that WASp-deficient murine B cells form smaller B-cell aggregates after stimulation with anti-CD40 or IL-4 compared with those of WASp-expressing B cells. This correlated with a reduced capacity of WASp knock-out B cells to form long membrane protrusions. Here we show that B cells from WAS patients also make smaller aggregates compared with controls, when stimulated with IL-4 and anti-CD40 mAbs. In addition, the activated WAS B cells form fewer long protrusions but increased numbers of short protrusions. We have previously shown that B cells in aggregates often contact each other via such long extensions, and we have speculated that the presence of these protrusions is necessary for formation of large dense cell aggregates.26 WASp-deficient mice also produce smaller GCs than wild-type mice. It is possible that the aggregation response in vitro mimics the GC response in vivo, where the antigen-specific B-cell clones are in contact with follicular dendritic cells and other B cells. Homotypic adhesion of B cells and the GC reaction are both dependent on T-cell signals, via the IL-4 receptor and CD40, as well as on the adhesion molecules leukocyte function antigen 1 (LFA-1) and intercellular adhesion molecule 1 (ICAM-1).28,37-39 We also found that in comparison with wild-type B cells, a higher proportion of WASp-deficient B cells switched immunoglobulin class when stimulated in vitro. This correlated with a reduced capacity of WASp-deficient B cells to form tight aggregates.26 It might imply that aggregation of B cells induces contact inhibition, affecting immunoglobulin switching or secretion.
Although earlier studies have shown that WAS lymphocytes have aberrant microvilli, a recent paper indicated that WASp is not required for their correct morphology.10 The authors investigated fresh WASp-deficient human and murine lymphocytes, whereas IL-2–stimulated cells were used in a previous study.8 Likewise, we found aberrant microvilli formation in anti-CD40 plus IL-4, but not in LPS-stimulated B cells from WASp knock-out mice.26 This indicates that WASp is an important downstream signaling molecule after IL-2, IL-4, and CD40-dependent stimulation of lymphocytes.
In agreement with earlier studies in the mouse, we found that human WAS B cells exhibited a lower polarization response to IL-4. Together with the reduced migratory response of WASp-negative murine and human B cells to chemokines, this suggests that absence of WASp leads to a general diminished motility. This is further substantiated by the normal expression of chemokine receptors in WASp-deficient B cells.
We have also clearly shown a deficient homing capacity of mature and precursor B cells in the spleen, and this is in line with previous reports.22,31 This may also explain the reduced size of B-cell areas. A similar interpretation might be used for the abnormal tissue morphology in spleens and lymph nodes from diseased patients with WAS as well as for the reduced numbers of T and B cells in the blood of young patients.33,34,40
We further found that WASp deficiency led to a striking reduction in the numbers of MZ B cells in the spleen. The most important functional feature of MZ B cells is their early participation in immune responses, as exemplified by a low threshold for activation of MZ B cells.35,36 MZ B-cell development and function relies on expression of different signaling proteins.41-43 The reduction in MZ B-cell areas in WASp knock-out mice might be due to deficient migratory or localization responses. At any rate, it is not due to absence of MOMA-1–positive macrophages, as these cells are present in the expected locations in the spleen of WASp knock-out mice. Neither is it due to inefficient adhesion of B cells,44 since WASp-deficient purified MZ B cells adhere normally to ICAM-1 and vascular cell adhesion molecule 1 (VCAM-1) under flow (A.J.T., unpublished observations, March 2003). Our finding is in line with evidence from WAS patients, since the MZ thickness was reduced as detected on spleen and lymph node sections from patients.34
Since cells also need to migrate within a lymphoid organ, in particular during an immune response, it is likely that the decreased motility contributes to the diminished humoral immune response in WASp-deficient mice. It has been demonstrated that antigen-specific T and B cells make chemokine-directed movements to the borders of the T- and B-cell areas.45,46 The reduced chemokine responses of WASp-deficient T and B cells most likely leads to inefficient contact and signaling of both cell types. It is logical that this deficiency would be most obvious early in the immune response and after suboptimal antigen stimulation, as we have demonstrated. This may explain why deficiency in antibody production was not detected in a previous study in which higher doses of antigen were administered, and time points of analysis were later.11
The finding that the humoral response in mice receiving WASp-deficient bone marrow is more severely reduced than that in WASp knock-out mice is puzzling. Possibly it means that after bone marrow transfer to irradiated hosts there is a lower level of hematopoietic stem cells than in a nonirradiated, nonreconstituted animal. In addition, time might be an important factor, so that later after reconstitution, the deficiency is less severe.
One might argue that other mechanisms than the ones suggested in the preceding paragraphs contribute to the immune deficiency in the absence of WASp. We have recently showed that WASp-deficient B cells can efficiently process and present antigen to T cells.47 WASp-deficient B cells also respond well to B-cell receptor signaling.11,12 Since WASp-deficient B cells proliferate normally to stimuli11 and show enhanced Ig class switching in vitro (Figure 5C), it is not likely that they have a proliferation or differentiation deficiency. Our preliminary results also suggest that WASp-deficient B cells undergo somatic hypermutation in response to 2-phenyl-oxazolone. We have furthermore noted that WASp-deficient mice immunized with 2-phenyl-oxazolone produced only small GCs compared with wild-type mice (L.W., E.S., and Claudia Berek, unpublished observations, December 2003). Thus, diminished GC responses are also found to a nonparticulate antigen of less potency than SRBCs. Similarly, not all of the effects we have observed in this paper can be attributed to abrogated T-cell help. The reduced B-cell areas and the diminished response to dextran in WASp knock-out mice are most likely caused by an intrinsic B-cell deficiency. Furthermore, transfer of wild-type T cells into WASp knock-out mice had no effect on the antibody and GC response, indicating that B-cell deficiency also plays a role for these effects.
In summary, our findings indicate a critical role for WASp in the cytoskeletal regulation of B cells, and in the generation of early primary humoral responses. Future work is needed to find out what other cells contribute to the decreased immune response in WASp deficiency.
Prepublished online as Blood First Edition Paper, September 21, 2004; DOI 10.1182/blood-2004-03-1003.
Supported by grants from the Fifth (European Commission) Framework Program (QLRT-1999-01090), the Swedish Research Council, the “Network for Inflammation Research” funded by the Swedish Foundation for Strategic Research, “Drottning Silvias Jubileumsfond,” “Erik och Edith Fernströms Stiftelse,” and Karolinska Institutet. A.J.T. is a Wellcome Senior Clinical Scientist Fellow.
The publication costs of this article were defrayed in part by page charge payment. Therefore, and solely to indicate this fact, this article is hereby marked “advertisement” in accordance with 18 U.S.C. section 1734.
We are grateful to the WAS patients and their families for kindly providing us with blood samples. We thank Scott Snapper and Frederick Alt for the WASp-deficient mice; John Kearney for kindly providing the anti-CD21 and MOMA-1 antibodies; Claudia Berek, Johan Thyberg, Eva Sverremark-Ekström, Gediminas Greicius, Robert Wallin, Monika Hansson, and Karin Lindroth for discussions, skilled technical help, and/or reagents.

