Abstract
Macrophages were reported to be strong producers of interferon γ (IFN-γ) after stimulation by interleukin 12 (IL-12) plus IL-18, which gave rise to a novel concept of auto-crine macrophage activation. Here, we show that peritoneal exudate and bone marrow-derived mouse macrophages generated by conventional techniques contain small quantities of CD11b+CD11c+CD31+DX5+NK1.1+ natural killer (NK) cells or CD3+CD8+TCRβ+ T cells, respectively. Intracellular cytokine staining, purification of macrophages by sorting, and the analysis of macrophages from alymphoid RAG2-/-γ-chain-/- mice revealed that the high amount of IFN-γ protein in the supernatants of unseparated IL-12/IL-18-stimulated macrophage populations originates exclusively from the contaminating lymphoid cells. Notably, IL-12/IL-18 still induced IFN-γ mRNA in highly purified macrophages from wild-type mice and in macrophages from RAG2-/-γ-chain-/- mice, whereas nuclear translocation of signal transducer and activator of transcription 4 (STAT4) and production of IFN-γ protein were no longer detectable. These results question the concept of autocrine macrophage activation by secreted IFN-γ, suggest differences in the expression of IFN-γ mRNA and protein between macrophages and lymphoid cells, and illustrate that the limited purity of most myeloid cell populations (≤ 98%) might lead to false conclusions.
Introduction
Interferon γ (IFN-γ) is a key cytokine in innate and adaptive immunity. It activates macrophages for the expression of surface major histocompatibility class II (MHC II) antigens, costimulatory molecules, and inflammatory mediators and for tumoricidal and antimicrobial activity. It regulates the proliferation and death of T lymphocytes, allows the development of a type 1 T-helper cell response, and is essential for the control of many intracellular pathogens in vivo. The functions of IFN-γ have been most convincingly demonstrated in studies that used neutralizing antibodies to IFN-γ or IFN-γ- or IFN-γ receptor-deficient mice.1-3
IFN-γ is typically produced by natural killer (NK) cells and CD4+ T cells, but also by CD8+ T cells, NKT cells, γδ T cells, and B cells.1-6 More recently, myeloid cells were reported to secrete IFN-γ.5 Interleukin 12 (IL-12) strongly induced IFN-γ in bone marrow (BM)-derived as well as splenic dendritic cells (DCs).7-11 IFN-γ mRNA or protein was also detected in mouse or human macrophages of the lung,12,13 spleen,7 bone marrow,14-16 resting peritoneum,17 or of the peritoneal exudate following a sterile inflammation.14,18,19 Lipopolysaccharide (LPS),14,18,20 type I interferon,20 IL-12,7,12,17 IL-12 plus IL-18,15,16,19,21 or IFN-γ itself,22 as well as infection with different pathogens (eg, mycobacteria, Legionella, Salmonella, and chlamydia),12,13,23,24 stimulated the expression of IFN-γ mRNA or protein or both in macrophages. The induction of IFN-γ by IL-12/IL-18 received particular attention because IL-12 and IL-18 are products of macrophages, which raised the possibility of an autocrine activation loop in macrophages during the early phase of an infection.5,15 In accordance with this hypothesis, stimulation of BM-derived macrophages (BMMΦs) with IL-12 plus IL-18 led to the induction of inducible nitric oxide (NO) synthase and to the killing of intracellular Toxoplasma gondii, both of which were dependent on the endogenously produced IFN-γ.15,16
The aim of the present study was to characterize the surface phenotype of macrophage subpopulations that express high amounts of IFN-γ protein. Using multicolor flow cytometry, high-stringency cell sorting, intracellular cytokine staining (ICS), and transgenic mice devoid of any lymphoid cells, the analysis of peritoneal-exudate macrophages (PE-MΦs) and BMMΦs revealed the unexpected presence of minute populations of NK cells carrying myeloid markers or of CD8+ T cells, respectively. These lymphoid cells fully accounted for the previously described strong production of IFN-γ protein by the macrophage populations after stimulation with IL-12 and IL-18.
Materials and methods
Mice
Female C57BL/6 and BALB/c mice were purchased from the Charles River Laboratories (Sulzfeld, Germany), and signal transducer and activator of transcription 4 (STAT4)-/- BALB/c mice were from the Jackson Laboratories (Bar Harbor, ME). Breeding pairs of H-2d RAG2/common γ-chain double-mutant mice (RAG2-/- γc-/-)25,26 backcrossed to the BALB/c background were originally generated by A. Berns, P. Krimpenfort, and J. Kirberg (The Netherlands Cancer Institute, Amsterdam) and obtained from H. Mossmann (Max Planck Institute for Immunobiology, Freiburg, Germany). All mice were housed under specific pathogen-free conditions and used at the age of 6 to 12 weeks.
Macrophage populations and cell culture
Peritoneal exudate cells. Four days after intraperitoneal injection of 2 mL 4% Brewer thioglycolate broth (Difco, Detroit, MI) peritoneal exudate cells (PECs) were harvested from the peritoneal cavities, analyzed by fluorescence-activated cell sorting (FACS), or cultured in 96-well (1 × 10⁵ cells/well, 200 μL) or 24-well tissue culture plates (1 × 10⁶ cells/well, 500 μL) at 37°C and 5% CO2/95% humidified air using either RPMI 1640 (Seromed-Biochrom, Berlin, Germany; supplemented as described19 plus 5% fetal calf serum [FCS] from BioWhittaker [Verviers, Belgium]) or Dulbecco modified Eagle medium (DMEM), catalogue no. 41966-029, from Invitrogen (Karlsruhe, Germany), supplemented with 50 μM 2-mercaptoethanol [2-ME], 1% nonessential amino acids, and 5% FCS). In vitro the cells were stimulated with recombinant murine (rm) IL-12 (1 ng/mL), rmIL-18 (10 ng/mL; all from R&D Systems, Wiesbaden, Germany), IFN-γ (20 ng/mL; kindly provided by G. Adolf, Vienna, Austria), LPS (derived from Escherichia coli O111:B4, 0.2 or 1 μg/mL; Sigma, Deisenhofen, Germany), or Chlamydia pneumoniae strain CM-1 (American Type Culture Collection [ATCC] VR-1360; kindly provided by T. Miethke, Technical University of Munich, Germany) for 24 to 72 hours. The LPS contents of the cytokine stock solutions and of the final culture media were less than 10 to 20 pg/mL as determined by a colorimetric Limulus amebocyte lysate assay (BioWhittaker, Walkersville, MD).
In vivo, IL-12 and IL-18 (0.5 μg each per mouse) were injected intraperitoneally 18 hours prior to harvesting the PECs. After 6 hours of culture without further stimulation in the presence of brefeldin A the cells were subjected to ICS analysis.
Peritoneal exudate macrophages. For generation of adherent PE-MΦs, PECs were seeded into 24-well tissue culture plates or 24-cm2 tissue culture dishes (6 × 10⁶ cells/dish). After 2 hours nonadherent cells were washed off (3 washes with warm phosphate-buffered saline [PBS]). The adherent macrophage monolayers were stimulated in fresh medium (see “Peritoneal exudate cells”). For flow cytometry of adherent PE-MΦs, the macrophages were detached by accutase (PAA Laboratories, Cölbe, Germany).
Resident peritoneal cells. Resident peritoneal cells (PCs) were harvested from naive mice by flushing their peritoneal cavities and stimulated as described (see “Peritoneal exudate cells”).
BMMΦs. BMMΦs were generated from total BM cells using exactly the same method, materials, and reagents (all provided by M. Modolell, Max Planck-Institute for Immunobiology, Freiburg, Germany) as in a previous publication that described the production of IFN-γ by BMMΦs.15 Briefly, BM cells were cultured in DMEM in hydrophobic Teflon bags in the presence of 10% FCS, 5% horse serum, and 15% L929 culture supernatant as a source of macrophage colony-stimulating factor (M-CSF). After 8 days the cells were harvested and analyzed by flow cytometry or stimulated (see “Peritoneal exudate cells”).
Macrophage cell line. RAW 264.7 cells (ATCC no. TIB-71) were obtained from the ATCC (Rockville, MD).
FACS analysis
For surface phenotyping and cell sorting the following fluorochrome (fluorescein isothiocyanate [FITC], phycoerythrin [PE], or allophycocyanin [APC])-labeled or biotinylated monoclonal antibodies (mAbs) were used (all from BD Biosciences [Heidelberg, Germany] unless otherwise indicated): anti-CD11b(M1/70), anti-F4/80(CI:A3-1) from Caltag Laboratories (Hamburg, Germany); anti-BM8 (BMA Biomedicals, Augst, Switzerland), anti-CD68 (FA-11) from Serotec (Düsseldorf, Germany); anti-CD31(ER-MP12) from BMA Biomedicals; anti-Ly6C(ER-MP20) from BMA Biomedicals; anti-Ly6G(GR1), anti-CD11c(HL3), anti-I-A/I-E(M5/114.15.2), anti-NK1.1(PK136), anti-Pan-NK-cell(DX5), anti-CD3(145-2C11), anti-CD4(CT-CD4), anti-CD8α(53-6.7), anti-TCRβ(H57-597), anti-CD19(1D3), and anti-CD45R/B220(RA3-6B2). For the detection of biotinylated antibodies, streptavidin-APC or streptavidin-peridinin chlorophyll protein (PerCP; BD Biosciences) was used. The specificity of the stainings was verified by the use of isotype control mAbs. Propidium iodide (PI) was included at 1 μg/mL in the final wash to detect dead cells. All analyses were performed on a FACS Calibur (BD Biosciences) applying Cell Quest Pro software. The FL3 channel was used to exclude PI+ dead cells.
Purification of cells
NK cells were positively selected as DX5+ cells from PECs by labeling with anti-DX5 MicroBeads and separating by AutoMACS (Miltenyi Biotec, Bergisch-Gladbach, Germany) and further purified by MoFlo sorting (Cytomation, Fort Collins, CO) after gating on CD11c+NK1.1+DX5+ cells. CD68+ or CD11b+F4/80+ macrophages of PECs or BMMΦs were purified by MoFlo sorting after staining with the corresponding mAbs. The purity of the obtained cell populations was always 99% or higher. CD4+ T cells of the spleen of naive mice were purified by positive selection after labeling with CD4 MicroBeads, using the AutoMACS separation technique (purity ≥ 93%).
Cell lysates
Monolayers of unstimulated or stimulated macrophages (IL-12/IL-18 for 24-48 hours with or without brefeldin A [10 μg/mL; Sigma] during the final 4-8 hours of stimulation) were washed 3 times with PBS and lysed in 40 mM Tris (tris(hydroxymethyl)aminomethane) buffer (pH 8) or in 20 mM Tris pH 8/150 mM NaCl/1% Triton/0.5% Nonidet P40 (NP40) buffer, containing protease inhibitors.19
ICS
Unseparated macrophage populations or purified cell populations were stimulated with IL-12 (1 ng/mL)/IL-18 (10 ng/mL) for 24 to 36 hours in 15 mL polypropylene tubes (Sarstedt, Nürnbrecht, Germany) under nonadherent conditions. After treatment with 10 μg/mL brefeldin A during the final 6 to 12 hours of stimulation, the cells were stained for surface markers, fixed with Cytofix (BD Biosciences) for 20 minutes, and incubated with APC-conjugated rat anti-mouse IFN-γ (XMG1.2; BD Biosciences) in permeabilization buffer (PBS, 0.5% saponin, 2% FCS). The specificity of the IFN-γ staining was verified by the use of an isotype control mAb and by its complete blocking after preincubation of the cells with unconjugated anti-IFN-γ mAb.
Immunocytology
Adherent macrophages (8-well LabTek Permanox Chambers, Nalge Nunc International, Wiesbaden, Germany) were stimulated with IL-12/IL-18 for 24 to 48 hours (with or without brefeldin A), washed 3 times with PBS, fixed with acetone, and sequentially stained for macrophage surface markers (eg, F4/80) and IFN-γ, using biotinylated primary antibodies (biotinylated goat anti-IFN-γ, R&D Systems [BAF 485]; biotinylated rat anti-IFN-γ, BD Biosciences [XMG1.2]) or unconjugated rat anti-IFN-γ (R&D Systems [mAb 785]) followed by biotinylated secondary reagents and streptavidin-horseradish peroxidase or streptavidin-alkaline phosphatase.27
ELISA
Culture supernatants were analyzed for their IFN-γ content by capture enzyme-linked immunosorbent assay (ELISA; capture antibody: clones 37801.11/37875.11, R&D Systems; biotinylated detection antibody: clone XMG1.2, BD Biosciences; sensitivity 20-40 pg/mL). The amount of tumor necrosis factor (TNF), IL-10, and IL-12p70 in culture supernatants was measured by an ELISA specific for TNF (R&D Systems, sensitivity 40 pg/mL), IL-10 (BD Biosciences, sensitivity 40 pg/mL), or IL-12p70 (BD Biosciences, sensitivity 100 pg/mL).
Measurement of nitrite
NO2- in supernatants was determined by the Griess assay.19
NK-cell cytotoxicity
Purified CD11c+NK1.1+DX5+cells were analyzed for their NK cell cytotoxic activity against YAC-1 tumor target cells.28
Phagocytosis assay
Macrophage monolayers in 8-well LabTek chambers were incubated with a 10- to 30-fold excess of FluoresbriteYG carboxylate microspheres (1.0 μM; Polysciences Europe, Eppelheim, Germany). After 2 hours, the cells were analyzed by fluorescence microscopy.
EMSAs
RNA preparation, RT, qualitative PCR, and real-time PCR
Total RNA was prepared with the RNeasy extraction kit (Qiagen, Hildesheim, Germany) and cDNAs were generated from 1 to 10μg RNA in the presence of random hexamer primers using the High Capacity cDNA Archive Kit (Applied Biosystems, Darmstadt, Germany) following the manufacturer's recommendations. The cDNAs were subsequently analyzed by conventional nonquantitative reverse transcription-polymerase chain reaction (RT-PCR) or by quantitative real-time RT-PCR (details are available on the Blood website; see the Supplemental Materials link at the top of the online article).
Results
Multicolor FACS analysis of thioglycolate-elicited PECs and BMMΦs
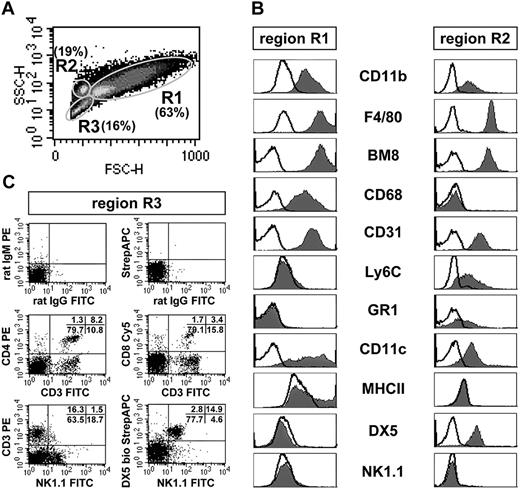
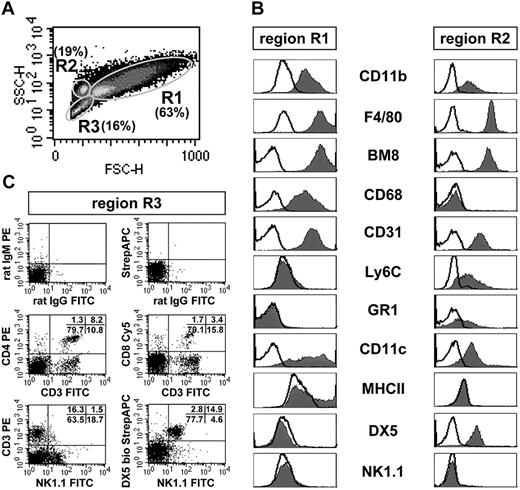
In PECs of C57BL/6 mice, 3 distinct subpopulations (R1, R2, R3) could be defined by forward/side scatter analysis (Figure 1A). The cells of region R1 were typical macrophages by size, granularity, expression of CD11b, F4/80, BM8, and CD68, and the absence of all tested lymphoid cell markers (CD3, CD4, CD8, TCRβ, CD19, B220, NK1.1, DX5; Figure 1B). The second myeloid cell population (R2) differed from the macrophage population R1 by the presence of Ly6C and GR1 and the lack of CD68 and MHC II. Unexpectedly, the cells of R2 uniformly expressed the pan-NK cell marker DX5, but not the NK cell marker NK1.1 and all other lymphoid markers tested. Cells of R3 consisted of a variety of myeloid cell types expressing different combinations of the markers CD11b, F4/80, BM8, CD31, Ly6C, GR1, CD11c, B220, and MHC II (not shown), but also contained NK cells, NKT cells, and T cells that accounted for 1.5% to 3.5% of all living PECs (Figure 1C).
FACS analysis of C57BL/6 PECs. (A) Density plot of the forward/side scatter analysis. Three subpopulations (R1, R2, R3) are distinguishable and gated. (B) Histograms of the expression of different surface markers on PECs of region R1 and R2. The black lines give the background fluorescence with the corresponding isotype control antibodies. (C) Two-parameter dot plot analysis of PECs of region R3. The percentages of CD3+CD4+ and CD3+CD8+ T cells, NK1.1+DX5+ NK cells, and CD3+NK1.1+ NKT cells are given in the plot panels. R3 also contained various myeloid cell types (staining not shown; see the first paragraph of “Multi-color FACS analysis of thioglycolate-elicited PECs and BMMΦ”). The data of Figure 1 are representative for at least 10 independent analyses.
FACS analysis of C57BL/6 PECs. (A) Density plot of the forward/side scatter analysis. Three subpopulations (R1, R2, R3) are distinguishable and gated. (B) Histograms of the expression of different surface markers on PECs of region R1 and R2. The black lines give the background fluorescence with the corresponding isotype control antibodies. (C) Two-parameter dot plot analysis of PECs of region R3. The percentages of CD3+CD4+ and CD3+CD8+ T cells, NK1.1+DX5+ NK cells, and CD3+NK1.1+ NKT cells are given in the plot panels. R3 also contained various myeloid cell types (staining not shown; see the first paragraph of “Multi-color FACS analysis of thioglycolate-elicited PECs and BMMΦ”). The data of Figure 1 are representative for at least 10 independent analyses.
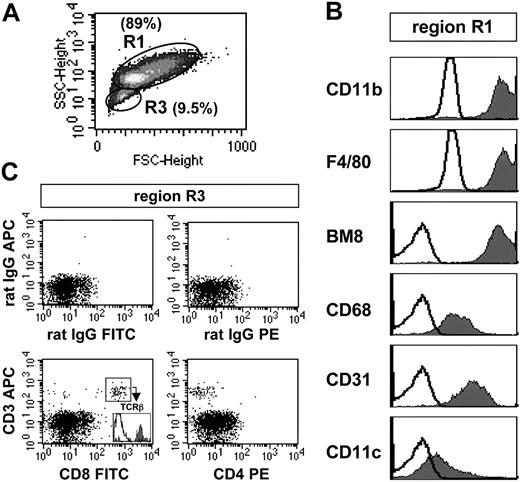
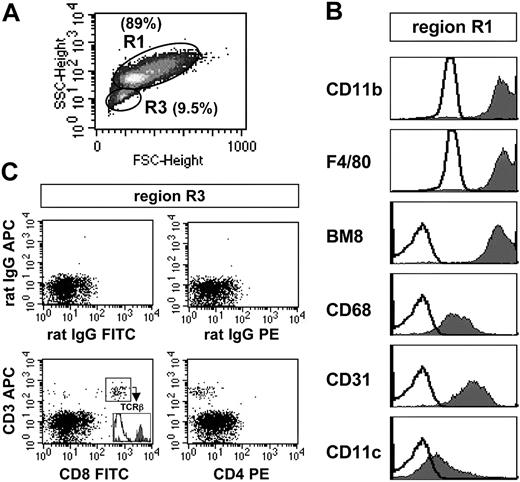
In BMMΦs, 2 subpopulations were discernible by forward/side scatter analysis, representing about 89% (R1) and 9.5% (R3) of all living cells, respectively (Figure 2A). All cells of region R1 were positive for the myeloid markers F4/80, BM8, CD68, CD11b, CD11c, and CD31 and, thus, represented macrophages comparable to the population R1 of PECs (Figure 2B versus Figure 1B). In contrast, the composition of R3 was very heterogeneous and comprised different myeloid cells expressing various combinations of myeloid markers (data not shown). Similar to our findings with PECs, region 3 of BMMΦs also contained a small fraction of lymphoid cells (0.7%-4% of all living BMMΦs) that were identified as CD8+CD3+ T cells carrying an α/β T-cell receptor (TCR; Figure 2C). From these results we conclude that not only PEC cultures, but, unexpectedly, also conventional BMMΦ cultures contain a minor population of lymphoid cells.
FACS analysis of C57BL/6 BMMΦs. (A) Density plot of the forward/side scatter analysis. Two subpopulations (R1, R3) are distinguishable and gated. (B) Histograms of the surface marker expression of region R1 BMMΦs. (C) Two-parameter dot plot analysis of BMMΦs of region R3. This region mostly consisted of various myeloid cells (not shown; see the second paragraph of “Multicolor FACS analysis of thioglycolate-elicited PECs and BMMΦ”), but also contained CD3+CD8+TCRβ+ T cells (∼7% of all living cells of region R3). The data are representative of 5 independent analyses.
FACS analysis of C57BL/6 BMMΦs. (A) Density plot of the forward/side scatter analysis. Two subpopulations (R1, R3) are distinguishable and gated. (B) Histograms of the surface marker expression of region R1 BMMΦs. (C) Two-parameter dot plot analysis of BMMΦs of region R3. This region mostly consisted of various myeloid cells (not shown; see the second paragraph of “Multicolor FACS analysis of thioglycolate-elicited PECs and BMMΦ”), but also contained CD3+CD8+TCRβ+ T cells (∼7% of all living cells of region R3). The data are representative of 5 independent analyses.
The phenotypic analysis of BALB/c PECs (3 experiments) or BMMΦs (2 experiments) showed no differences compared to that of B6 mice (data not shown).
Lymphoid cells account for the production of IFN-γ by inflammatory PECs and BMMΦs
IL-12/IL-18 were reported to strongly induce IFN-γ in PE-MΦs19,29 and BMMΦs.15 In these earlier studies, the production of IFN-γ was monitored by ELISA, the macrophages were not sorted, and no single-cell analyses were performed to ascertain the expression of IFN-γ protein by macrophages.
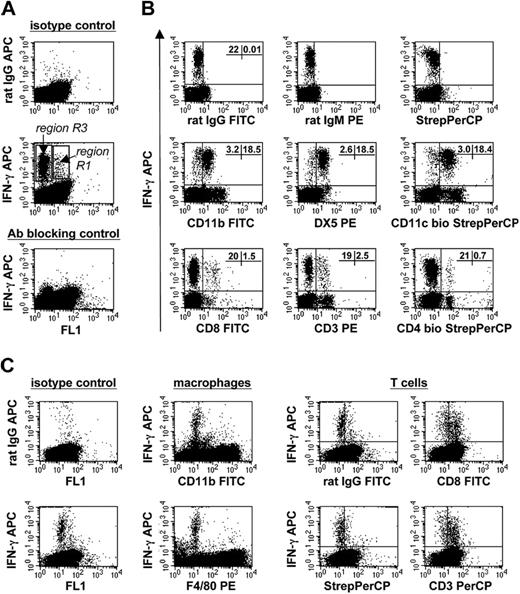
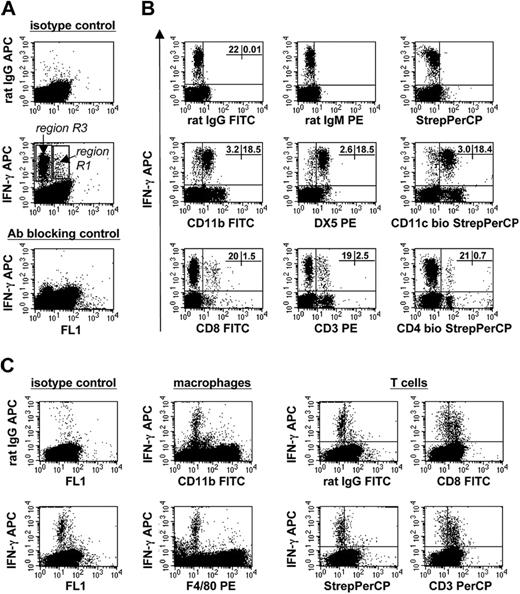
ICS of C57BL/6 PECs stimulated with IL-12/IL-18 revealed that cells producing high amounts of IFN-γ were exclusively located within region R3 (Figure 3A). The IFN-γ+ cells were identified as NK cells (NK1.1+DX5+) and, to a minor extent, also as CD3+CD4+ and CD3+CD8+ T cells (Figure 3B). Importantly, within R3 no IFN-γ+ cells of myeloid origin were detectable (not shown).
Analysis of total PECs and unseparated BMMΦs of C57BL/6 mice for the expression of IFN-γ by ICS and FACS after stimulation with IL-12/IL-18. Brefeldin A was added during the final 8 hours of the 36-hour stimulation period. (A) Total PECs: a dominant IFN-γ+ cell population is located within region R3 (Figure 1A). In addition a few IFN-γ+ cells were detectable localized within region R1. (B) Total PECs: dot plot analysis of the surface phenotype of the IFN-γ+ cells within region R3. The percentage of IFN-γ+ cells is given in the plot panels. (C) Total BMMΦs: dot plot analysis of the surface phenotype of IFN-γ+ cells within BMMΦs. The cells that specifically stained with anti-IFN-γ compared to normal rat IgG (left 2 panels) are negative for CD11b and F4/80 (2 panels in the middle) and positive for the T-cell markers CD3 and CD8 (4 panels on the right). Panels A and B represent one of 5 independent experiments; panel C, one of 3 independent experiments.
Analysis of total PECs and unseparated BMMΦs of C57BL/6 mice for the expression of IFN-γ by ICS and FACS after stimulation with IL-12/IL-18. Brefeldin A was added during the final 8 hours of the 36-hour stimulation period. (A) Total PECs: a dominant IFN-γ+ cell population is located within region R3 (Figure 1A). In addition a few IFN-γ+ cells were detectable localized within region R1. (B) Total PECs: dot plot analysis of the surface phenotype of the IFN-γ+ cells within region R3. The percentage of IFN-γ+ cells is given in the plot panels. (C) Total BMMΦs: dot plot analysis of the surface phenotype of IFN-γ+ cells within BMMΦs. The cells that specifically stained with anti-IFN-γ compared to normal rat IgG (left 2 panels) are negative for CD11b and F4/80 (2 panels in the middle) and positive for the T-cell markers CD3 and CD8 (4 panels on the right). Panels A and B represent one of 5 independent experiments; panel C, one of 3 independent experiments.
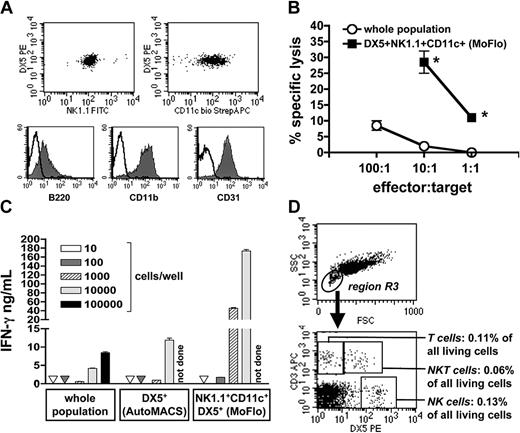
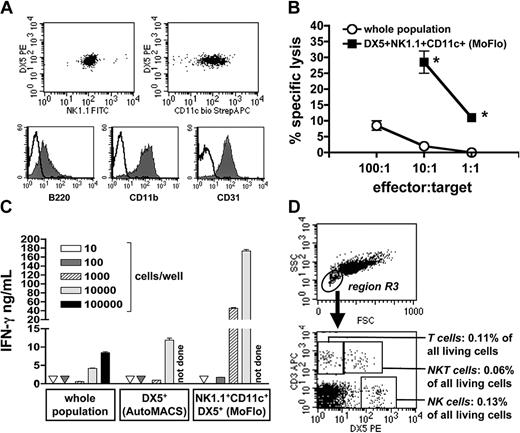
Because IFN-γ+NK1.1+DX5+ cells not only coexpressed B220, but also the myeloid cell markers CD11b, CD11c, and CD31 (Figures 3B and 4A), we decided to purify and further characterize these cells. Compared to unselected C57BL/6 PECs, the purified CD11c+NK1.1+DX5+cells (Figure 4A) exhibited a significantly increased cytolytic activity that is typical for activated, peritoneal NK cells (Figure 4B). Titration experiments revealed reproducibly that NK cells within the PEC population are a potent source of IFN-γ on activation by IL-12/IL-18, but not without cytokine restimulation (Figure 4C and data not shown). As few as 1000 sorted NK cells secreted about 5 times as much IFN-γ protein as 100 000 cells of the unseparated PEC population. This strongly suggests that a contamination of PE-MΦs with less than or equal to 0.2% NK cells accounts for the IFN-γ release of PE-MΦs observed after stimulation with IL-12 plus IL-18.19
Phenotypic and functional characterization of purified NK cells and PE-MΦs of C57BL/6 mice. (A-C) CD11c+NK1.1+DX5+ NK cells were positively selected from PECs by AutoMACS and MoFlo sorting (purity ≥ 99%). (A) Surface phenotyping of purified NK cells by FACS. Representative for 4 independent experiments. (B) NK cell cytolytic activity (mean of triplicates ± SD) of total PECs compared to purified CD11c+NK1.1+DX5+ NK cells against YAC-1 cells (5000 target cells/well). *Significantly different from unselected PECs (P < .02, unpaired Student t test). One of 2 independent experiments. (C) IFN-γ production (mean of triplicates ± SD) of total PECs, the DX5+ cell fraction (after AutoMACS separation), and the highly purified CD11c+NK1.1+DX5+ NK cells (AutoMACS plus MoFlo sorting). The number of cells was titrated and stimulated with IL-12/IL-18 for 72 hours. No IFN-γ was detectable in unstimulated cells (not shown). Representative of 2 independent experiments. (D) Phenotyping of PE-MΦ monolayers by FACS. After adherence and washing, the PE-MΦs were detached by accutase treatment and stained for lymphoid markers. Detection of NK cells (CD3-DX5+), T cells (CD3+DX5-), and NKT cells (CD3+DX5+) within region R3. Representative of 3 similar experiments.
Phenotypic and functional characterization of purified NK cells and PE-MΦs of C57BL/6 mice. (A-C) CD11c+NK1.1+DX5+ NK cells were positively selected from PECs by AutoMACS and MoFlo sorting (purity ≥ 99%). (A) Surface phenotyping of purified NK cells by FACS. Representative for 4 independent experiments. (B) NK cell cytolytic activity (mean of triplicates ± SD) of total PECs compared to purified CD11c+NK1.1+DX5+ NK cells against YAC-1 cells (5000 target cells/well). *Significantly different from unselected PECs (P < .02, unpaired Student t test). One of 2 independent experiments. (C) IFN-γ production (mean of triplicates ± SD) of total PECs, the DX5+ cell fraction (after AutoMACS separation), and the highly purified CD11c+NK1.1+DX5+ NK cells (AutoMACS plus MoFlo sorting). The number of cells was titrated and stimulated with IL-12/IL-18 for 72 hours. No IFN-γ was detectable in unstimulated cells (not shown). Representative of 2 independent experiments. (D) Phenotyping of PE-MΦ monolayers by FACS. After adherence and washing, the PE-MΦs were detached by accutase treatment and stained for lymphoid markers. Detection of NK cells (CD3-DX5+), T cells (CD3+DX5-), and NKT cells (CD3+DX5+) within region R3. Representative of 3 similar experiments.
In most studies that reported IFN-γ production by peritoneal macrophages, adherent macrophages, prepared by a 1- to 2-hour adherence step and removal of nonadherent cells by 3 (or fewer) vigorous washings, rather than total peritoneal cells (PECs or PCs) were used.14,17-20 We therefore tested whether lymphoid cells are still present within macrophage monolayers derived from PECs. FACS analysis of PE-MΦ monolayers detached by accutase clearly showed that apart from the predominant macrophage population (R1) approximately 0.3% of all recovered cells were NK, T, and NKT cells (R3; Figure 4D). Thus, the standard method for preparing adherent peritoneal macrophages does not result in the complete removal of lymphoid cells.
The ICS analysis of C57BL/6 BMMΦs confirmed our results obtained with the PECs. The production of IFN-γ on stimulation with IL-12/IL-18 was restricted to the CD3+CD8+ T cells, whereas IFN-γ+ macrophages (CD11b+F4/80+) were not detectable (Figure 3C).
Highly purified macrophages do not secrete IFN-γ on stimulation with IL-12/IL-18
Because the intracellular stainings of IFN-γ were performed with total PECs or BMMΦs in suspension cultures, we considered the possibility that the nonadherence accounts for the lack of IFN-γ production. Furthermore, the ICS analyses of IL-12/IL-18-stimulated PECs revealed a few ambiguous IFN-γ+ cells within the macrophage region R1 (Figure 3A). We therefore sorted macrophages carrying the marker CD68 (present on all PECs of R1; also positive for F4/80+), analyzed them for the expression of IFN-γ by ICS under nonadherent conditions, and tested them for the release of IFN-γ after adherence and stimulation with IL-12/IL-18 by ELISA.
Compared to freshly isolated C57BL/6 PECs, IFN-γ secretion in response to IL-12/IL-18 was significantly reduced in PE-MΦs that were prepared by adherence of PECs and 3 subsequent washing steps (Figure 5A). Furthermore, the frequency of washing correlated inversely with the extent of IFN-γ release; the more often the monolayers of PE-MΦs were washed, the less IFN-γ was present (not shown). IFN-γ was neither detectable in the culture supernatants (Figure 5A, ELISA) nor in the cytoplasm (Figure 5B, ICS) of highly purified CD68+ PE-MΦs after stimulation with IL-12/IL-18 for 24 to 72 hours. The absent IFN-γ production is unlikely to result from the purification procedure because all other functions of macrophages that were tested (phagocytosis, production of TNF or NO after stimulation with IFN-γ/LPS, production of IL-10 or IL-12p70 after exposure to Staphylococcus aureus) remained unaltered after sorting (Figure 5A and data not shown).
IFN-γ production and STAT4 activation of unselected versus sorted PE-MΦs or BMMΦs of C57BL/6 mice. CD68+ PE-MΦs (A-C) or CD11b+F4/80+ or CD68+ BMMΦs (D-F) were purified from total PEC or BMMΦ populations by MoFlo sorting (purity ≥ 99%). (A,D) Unseparated and sorted PECs, unseparated and sorted BMMΦs, and PE-MΦs (obtained after adherence of PECs and removal of nonadherent cells) were stimulated under adherent conditions with IL-12 plus IL-18 or IFN-γ (20 ng/mL) plus LPS (200 ng/mL) for 72 hours before culture supernatants were analyzed for IFN-γ and TNF. Means (± SEM) of 3 experiments are shown. *Significantly different from unseparated PECs (P ≤ .01, unpaired Student t test). (B,E) The presence of IFN-γ+ cells in purified CD68+ PE-MΦs or CD11b+F4/80+ BMMΦs in response to IL-12/IL-18 was analyzed by ICS and FACS. Representative for 3 experiments. (C,F) Activation of STAT4 as analyzed by EMSA. Unsorted PE-MΦs or purified CD68+ PE-MΦs and unsorted or purified CD11b+F4/80+ BMMΦs were cultured without or with IL-12/IL-18 for 2 hours. As controls, the nuclear extracts were combined with the [32P]-labeled DNA probe in the presence of a 100-fold excess of the unlabeled probe, the nuclear extract was omitted from the gel shift-reaction, or nuclear extracts were prepared from unsorted STAT4-/- PE-MΦs. Representative of 3 experiments.
IFN-γ production and STAT4 activation of unselected versus sorted PE-MΦs or BMMΦs of C57BL/6 mice. CD68+ PE-MΦs (A-C) or CD11b+F4/80+ or CD68+ BMMΦs (D-F) were purified from total PEC or BMMΦ populations by MoFlo sorting (purity ≥ 99%). (A,D) Unseparated and sorted PECs, unseparated and sorted BMMΦs, and PE-MΦs (obtained after adherence of PECs and removal of nonadherent cells) were stimulated under adherent conditions with IL-12 plus IL-18 or IFN-γ (20 ng/mL) plus LPS (200 ng/mL) for 72 hours before culture supernatants were analyzed for IFN-γ and TNF. Means (± SEM) of 3 experiments are shown. *Significantly different from unseparated PECs (P ≤ .01, unpaired Student t test). (B,E) The presence of IFN-γ+ cells in purified CD68+ PE-MΦs or CD11b+F4/80+ BMMΦs in response to IL-12/IL-18 was analyzed by ICS and FACS. Representative for 3 experiments. (C,F) Activation of STAT4 as analyzed by EMSA. Unsorted PE-MΦs or purified CD68+ PE-MΦs and unsorted or purified CD11b+F4/80+ BMMΦs were cultured without or with IL-12/IL-18 for 2 hours. As controls, the nuclear extracts were combined with the [32P]-labeled DNA probe in the presence of a 100-fold excess of the unlabeled probe, the nuclear extract was omitted from the gel shift-reaction, or nuclear extracts were prepared from unsorted STAT4-/- PE-MΦs. Representative of 3 experiments.
Identical results were obtained with C57BL/6 BMMΦs. Unlike the unseparated population of BMMΦs, highly purified BMMΦs (macrophages of R1), sorted for CD11b+F4/80+ or CD68+ cells, failed to produce IFN-γ in response to IL-12/IL-18 as analyzed by ELISA and ICS, whereas the synthesis of TNF was unimpaired (Figure 5D-E).
The lack of detectable IFN-γ production after purification of the macrophage populations was independent of the mouse strain because it was also observed with sorted CD68+ PE-MΦs (1 experiment) or CD11b+F4/80+ BMMΦs (2 experiments, not shown) derived from BALB/c mice.
These data further corroborate that the high amounts of IFN-γ previously detected in culture supernatants of peritoneal as well as BMMΦ populations (95%-98% purity) do not originate from macrophages.
Highly purified macrophages do not activate STAT4 on stimulation with IL-12/IL-18
In T and NK cells stimulation with IL-12 activates STAT4.30-33 In adherent cultures of unsorted BMMΦs or PE-MΦs, the IL-12/IL-18-induced IFN-γ production was accompanied by the tyrosine phosphorylation or nuclear translocation of STAT4.16,19 We therefore tested whether IL-12 plus IL-18 is able to activate STAT4 in adherent cultures of sorted (CD68+ or CD11b+F4/80+) C57BL/6 macrophages. Unlike unsorted PE-MΦs or BMMΦs, highly purified PE-MΦs and BMMΦs did not translocate STAT4 into the nucleus after stimulation with IL-12/IL-18 (Figure 5C,F). These results strongly suggest that in unselected macrophage populations both the production of IFN-γ and the activation of STAT4 are due to the presence of lymphoid cells.
RAG2-/-γc-/- macrophages neither release IFN-γ protein nor activate STAT4 in response to IL-12/IL-18
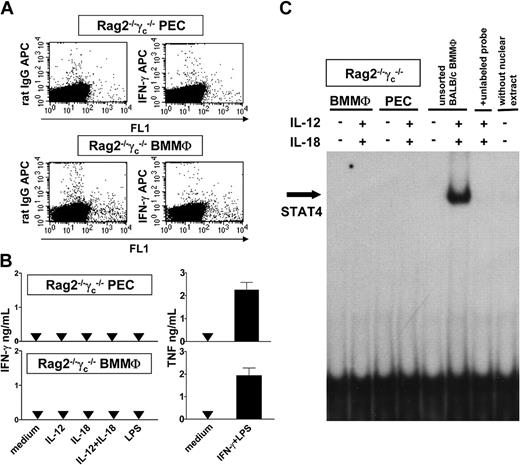
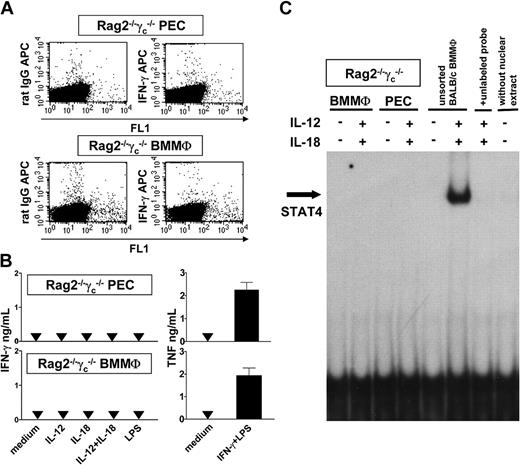
To exclude the possibility that our cell separation technique selectively affected the ability of macrophages to produce IFN-γ, we investigated macrophages of RAG2-/-γc-/- mice backcrossed to BALB/c. Due to a combined deficiency of the common γ chain and the RAG2 gene, these mice lack all lymphoid cells (T, B, NK, and NKT cells), whereas macrophages and DCs develop normally.29,34 In resident PCs (not shown), PECs, and BMMΦs, stimulation with IL-12 (with or without IL-18) did not lead to a detectable production of IFN-γ using ICS (Figure 6A) or ELISA (Figure 6B), to the activation of STAT4 as assessed by EMSA (Figure 6C), or to the generation of NO (which would be induced by endogenously produced IFN-γ; data not shown). C pneumoniae that was previously reported to stimulate IFN-γ production in BMMΦs of wild-type mice24 also failed to induce IFN-γ in RAG2-/-γc-/- macrophages (not shown), as did LPS (Figure 6B). There was no general secretory defect of these cells because on stimulation with IFN-γ/LPS their release of TNF (Figure 6B; compare with Figure 5A,D) and NO (not shown) was comparable to that of wild-type macrophages. Finally, intraperitoneal treatment of BALB/c wild-type or RAG2-/-γc-/- mice with IL-12/IL-18 in vivo (see “Materials and methods”) was also unable to induce the expression of IFN-γ protein in PE-MΦs as assessed by ICS (not shown). In contrast, IFN-γ protein expression was readily detectable in the peritoneal lymphoid cells of the BALB/c wild-type controls.
IFN-γ production and STAT4 activation of PECs and BMMΦs of RAG2-/-γc-/- mice. (A) Total of RAG2-/-γc-/- PECs or BMMΦs were stimulated with IL-12/IL-18 and intracellular IFN-γ was detected by ICS. Representative for 3 experiments. (B) Production of IFN-γ and TNF of RAG2-/-γc-/- PECs or BMMΦs after stimulation with IL-12 (with or without IL-18), IL-18, LPS (1μg/mL), or IFN-γ (20 ng/mL) plus LPS (200 ng/mL) for 72 hours. Mean ± SEM of 5 experiments. (C) Analysis of STAT4 activation by EMSA. Nuclear extracts were prepared from PECs or BMMΦs of RAG2-/-γc-/- mice or from unsorted BALB/c BMMΦs as positive control. The cells remained unstimulated or were stimulated with IL-12/IL-18 for 2 hours (Figure 5). Representative for 3 experiments.
IFN-γ production and STAT4 activation of PECs and BMMΦs of RAG2-/-γc-/- mice. (A) Total of RAG2-/-γc-/- PECs or BMMΦs were stimulated with IL-12/IL-18 and intracellular IFN-γ was detected by ICS. Representative for 3 experiments. (B) Production of IFN-γ and TNF of RAG2-/-γc-/- PECs or BMMΦs after stimulation with IL-12 (with or without IL-18), IL-18, LPS (1μg/mL), or IFN-γ (20 ng/mL) plus LPS (200 ng/mL) for 72 hours. Mean ± SEM of 5 experiments. (C) Analysis of STAT4 activation by EMSA. Nuclear extracts were prepared from PECs or BMMΦs of RAG2-/-γc-/- mice or from unsorted BALB/c BMMΦs as positive control. The cells remained unstimulated or were stimulated with IL-12/IL-18 for 2 hours (Figure 5). Representative for 3 experiments.
These results unequivocally demonstrate that both PE-MΦs and BMMΦs of RAG2-/-γc-/- mice lack the capacity to release high amounts of IFN-γ in response to IL-12/IL-18.
Activated primary macrophages, but not RAW264.7 macrophages, express IFN-γ mRNA
Earlier studies showed that IL-12 (with or without IL-18) induced IFN-γ mRNA in resident peritoneal macrophages, BMMΦs, and PE-MΦs. In resident and inflammatory peritoneal macrophages the expression of IFN-γ mRNA was demonstrated by RT-PCR and therefore could have resulted from contaminating lymphoid cells.17,19 In BMMΦs, however, IFN-γ mRNA was directly detected by in situ hybridization.15
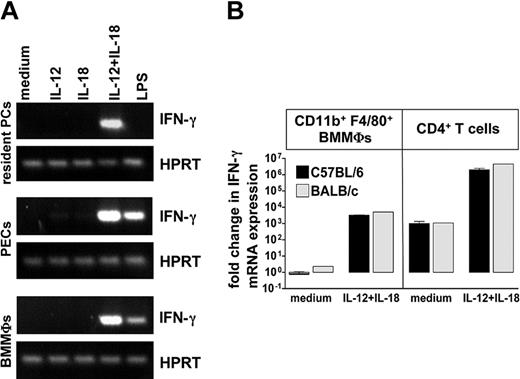
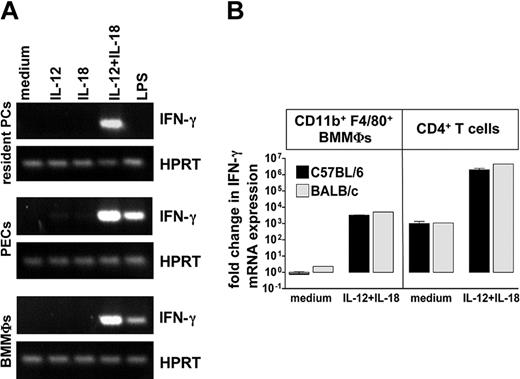
To ascertain that macrophages stimulated with IL-12/IL-18 express IFN-γ mRNA without releasing IFN-γ protein, we assessed 3 different macrophage populations of alymphoid RAG2-/-γc-/- mice (resident PCs, PECs, and BMMΦs) by conventional RT-PCR analysis. In all 3 cases IFN-γ mRNA was clearly induced by IL-12/IL-18, in the case of PECs and BMMΦs also after stimulation with LPS (Figure 7A) or C pneumoniae (not shown). These results were confirmed in 2 independent experiments by quantitative real-time RT-PCR analysis (Table S1).
IFN-γ mRNA expression in macrophages of RAG2-/-γc-/- mice and in purified CD11b+F4/80+ BMMΦs and CD4+ T cells of C57BL/6 and BALB/c mice. (A) Resident PCs, PECs, and BMMΦs of RAG2-/-γc-/- mice were incubated with IL-12 (with or without IL-18), IL-18, or LPS (1 μg/mL) for 24 hours, and RNA was prepared and analyzed by conventional RT-PCR for hypoxanthine-guanine phosphoribosyltransferase (HPRT) and IFN-γ. Representative of 3 experiments. (B) Sorted CD11b+F4/80+ BMMΦs and CD4+ purified T cells of naive mice were stimulated with IL-12/IL-18 and harvested for real-time RT-PCR analysis at 24 hours. IFN-γ mRNA transcription was calculated by calibrating to unstimulated C57BL/6 BMMΦs. The data represent the mean (± SEM) of 2 experiments with C57BL/6 BMMΦs and T cells (▪) and the results of one experiment with BALB/c BMMΦs and T cells (▦).
IFN-γ mRNA expression in macrophages of RAG2-/-γc-/- mice and in purified CD11b+F4/80+ BMMΦs and CD4+ T cells of C57BL/6 and BALB/c mice. (A) Resident PCs, PECs, and BMMΦs of RAG2-/-γc-/- mice were incubated with IL-12 (with or without IL-18), IL-18, or LPS (1 μg/mL) for 24 hours, and RNA was prepared and analyzed by conventional RT-PCR for hypoxanthine-guanine phosphoribosyltransferase (HPRT) and IFN-γ. Representative of 3 experiments. (B) Sorted CD11b+F4/80+ BMMΦs and CD4+ purified T cells of naive mice were stimulated with IL-12/IL-18 and harvested for real-time RT-PCR analysis at 24 hours. IFN-γ mRNA transcription was calculated by calibrating to unstimulated C57BL/6 BMMΦs. The data represent the mean (± SEM) of 2 experiments with C57BL/6 BMMΦs and T cells (▪) and the results of one experiment with BALB/c BMMΦs and T cells (▦).
The up-regulation of IFN-γ mRNA by IL-12/IL-18 was also demonstrated in highly purified CD11b+F4/80+ C57BL/6 BMMΦs and, to a similar extent, in BALB/c BMMΦs (Figure 7B). The real-time RT-PCR further revealed that there was a comparable 1000-fold inducibility of IFN-γ mRNA by IL-12/IL-18 in sorted BMMΦs and CD4+ splenic T cells from naive BALB/c or C57BL/6 mice; however, in the chosen T-cell population the baseline expression of IFN-γ mRNA was strikingly higher than in the macrophages (Figure 7B). On the protein level, again no IFN-γ was found in the corresponding culture supernatants of sorted BMMΦs, whereas CD4+ T cells secreted 3.2 ± 0.1 ng/mL (mean ± SEM of 2 experiments with C57BL/6 T cells) and 3.5 ng/mL (1 experiment with BALB/c T cells) on stimulation with IL-12/IL-18 for 24 hours.
Thus, primary mouse macrophages can be readily activated for the expression of IFN-γ mRNA, but not for the production of IFN-γ protein within the sensitivity limits of the applied methods. In accordance with previous data15 neither IFN-γ mRNA nor protein (not shown) were detectable in RAW264.7 macrophages after stimulation with IL-12/IL-18 or LPS using conventional or real-time RT-PCR and ELISA (Figure S1 and data not shown).
Discussion
Composition and purity of macrophage populations
In PECs and day-8 BMMΦ cultures, typical macrophages were identified by size, granularity, and the expression of surface molecules that are largely selective for (F4/80, BM8, CD68) or abundantly expressed on macrophages (CD11b; Figures 1, 2, R1).35,36 CD68 was found not only on PE-MΦs as published before,37 but also on the surface of BMMΦs (Figure 2B).
In PECs, a second myeloid subpopulation (R2) could be defined that was also positive for F4/80, BM8, CD31, and CD11b. However, unlike the R1 macrophages, these cells were CD68 negative, expressed the markers Ly6C and GR1 (30%), and stained positively for the pan-NK cell marker DX5, whereas NK1.1 was absent. After a culture period of 24 hours, FACS analysis of the detached cell monolayer revealed that the subpopulation R2 had disappeared (not shown). This suggests that PECs of region R2 represent a precursor stage of macrophages in region R1. Based on their coexpression of a macrophage (F4/80) and a NK cell marker (DX5), the cells of R2 might be related to the F4/80+NK1.1+ cytotoxic macrophage and NK cell precursors that were previously generated from BM cells in the presence of exogenous M-CSF and IL-2.38 A similar population was also observed in the spleen and BM of mice after administration of M-CSF.39 The ontogeny and function of these F4/80+NK1.1+ (or F4/80+DX5+) cells under physiologic conditions remains currently unknown.
In region R3 of freshly isolated PECs, adherent PE-MΦs, and BMMΦs, we not only detected subsets of myeloid cells (eg, granulocytes, DCs; not shown), but also small quantities (≤ 1%-4%) of NK cells or T cells or both.
In PECs, CD11b+CD11c+CD31+DX5+NK1.1+ cells were the predominant IFN-γ-producing population after stimulation by IL-12/IL-18. We consider these cells as activated NK cells because of their high NK cell cytotoxicity, their ability to produce large amounts of IFN-γ, and the expression of CD11b and CD11c, which were previously found on the surface of activated human NK cells.40 The peritoneal CD11b+CD11c+CD31+DX5+NK1.1+ cells might be related to cytolytic dendritic cells (DCs) in lymphoid organs,41,42 or to the recently described splenic bitypic NK/DC regulatory cells (CD11c+DX5+), which were reported to exhibit high cytotoxic activity against NK-sensitive YAC cells, to express the NK1.1 (80%) and the F4/80 marker (30%), and to produce IFN-γ (25%).43
The detection of CD3+TCRβ+CD8+ T cells within R3 of BMMΦs was unexpected. Although for certain subtypes of DCs a lymphoid origin, the presence of CD8, and the expression of CD3 and pre-Tα mRNA were demonstrated,44,45 there is no evidence that DCs (or other myeloid cells) express TCR components on the cell surface. Furthermore, our CD3+TCRβ+CD8+ population was negative for myeloid cell markers (eg, CD11c), but positive for Ly6C (not shown) that is found on about 50% of all peripheral CD8+ T cells.46
Production of IFN-γ by macrophages
Previously, several groups including ours provided data that not only argued for the expression of IFN-γ mRNA,14 but also for the release of small17,24 or, in the case of BMMΦs or PE-MΦs stimulated with IL-12/IL-18, very high (2-40 ng/mL) amounts of IFN-γ protein by activated macrophages.15,19,24,29 This hypothesis was supported by the binding of an anti-IFN-γ antibody to F4/80+ cells within resident peritoneal cells,17 the simultaneous detection of IFN-γ mRNA in about 30% of IL-12/IL-18-stimulated BMMΦs by in situ hybridization and of IFN-γ protein in the respective culture supernatants,15 the IL-12/IL-18-dependent activation of STAT4 in PE-MΦs or BMMΦs with less than 2% to 5% lymphoid contaminants and with high amounts of IFN-γ in the conditioned medium,16,19 and the expression of IFN-γ mRNA or protein or both by macrophage populations even after antibody-mediated or genetic depletion of NK or T cells.7,14,17,24
Although these data were compatible with, they did not prove the hypothesis that the IFN-γ protein in the culture supernatants originated from macrophages. First, in none of these studies did the purity of the analyzed macrophage populations reach or exceed 99%. Our results show that as few as 0.2% activated NK cells or 0.7% CD8+ T cells are sufficient to generate the IFN-γ protein that was measured in cultures of PE-MΦs or BMMΦs prepared by conventional techniques. Second, the methods applied in the earlier reports did not allow definition of the divergent cellular origin of IFN-γ mRNA expression and IFN-γ release. Instead, it was tacitly assumed that the IFN-γ mRNA and protein in the cultures were both derived from the most prevalent cell type, that is, the macrophage. Third, for several reasons (eg, variable surface marker expression) antibody-based methods for the elimination of T and NK cells never led to complete depletion of the target cell population so that residual NK or T cells might have caused the previously reported results.
To address this latter issue, we investigated macrophages from alymphoid RAG2-/-γc-/- mice. RAG2-/-γc-/- macrophages did not release any IFN-γ protein in response to IL-12/IL-18, LPS, or C pneumoniae, but readily expressed IFN-γ mRNA after exposure to these stimuli (Figures 6B and 7A and data not shown). Thus, RAG2-/-γc-/- macrophages are not unresponsive to IL-12 with or without IL-18 as previously postulated on the basis of a slight reduction of the IL-12 receptor β1 mRNA,29 but have the same phenotype as highly purified wild-type macrophages; that is, they fail to release IFN-γ after stimulation with IL-12 or IL-12/IL-18 despite the expression of IFN-γ mRNA. Accordingly, the very low (≤ 50-250 pg/mL) or hardly measurable levels of IFN-γ (≤ 5 pg/mL) in sera or mixed spleen cell cultures of RAG2-/-γc-/- mice after stimulation with IL-127,47 are unlikely to originate from macrophages, but may instead be released by nonmyeloid IFN-γ-producing cells, for example, fibroblasts or erythroid cells.48,49
Previous immunofluorescence analyses suggested a cell-associated expression of IFN-γ protein in macrophages activated by LPS, C pneumoniae, or IL-12,14,17,24 although the positive IFN-γ staining of unstimulated macrophages that lacked IFN-γ mRNA by RT-PCR remained puzzling.14,17 Nevertheless, the IFN-γ mRNAof IL-12/IL-18-stimulated macrophages might be translated without secretion of the protein. However, even in the presence of brefeldin A, neither ICS and FACS nor immunocytochemistry nor the analysis of lysates of activated macrophages by ELISA allowed us to detect intracellular IFN-γ protein in PE-MΦsorBMMΦs (Figures 3, 5, and 6 and data not shown). Thus, it is highly unlikely that in IL-12/IL-18-stimulated macrophages IFN-γ accumulates intracellularly.
At present, we cannot exclude the possibility that macrophages produce minute amounts of IFN-γ protein below the sensitivity limits of our assays, that other populations of macrophages not investigated here (eg, splenic macrophages) are capable of releasing IFN-γ,7 and that certain other cytokines (eg, IL-2) or pathogens (eg, Listeria monocytogenes, T gondii, Salmonella typhimurium) stimulate the production of IFN-γ by macrophages in vitro or in vivo.7,47,50 However, in the light of the present results the previously published data deserve careful reassessment, notably with respect to the purity and phenotypic definition of the cell populations. In the same context, it might be worthwhile to revisit the production of high amounts of IFN-γ (≥ 20 ng/mL) that was reported for DC populations after stimulation with IL-12/IL-18.7,8,51
Differential regulation of IFN-γ in macrophages versus lymphoid cells
Within the limits of sensitivity of the applied assays IL-12 plus IL-18 clearly induced IFN-γ mRNA, but no IFN-γ protein in purified or alymphoid macrophage populations (Figures 5A,B,D,E; 6A-B; 7A-B; and Table S1). In contrast, in T cells and NK cells both IFN-γ mRNA and protein are readily detectable after stimulation with IL-12 plus IL-18.52-54 This suggests that the expression of IFN-γ in macrophages is controlled on the level of translation. Possible mechanisms include the protein kinase-dependent inactivation of elongation factors and the subsequent down-regulation of protein synthesis or stability in response to various stress factors such as oxidants, cytokine stimulation, or amino acid depletion, which has already been described for macrophages.55-57
In T and NK cells the IL-12- or IL-12/IL-18-induced transcription of the IFN-γ gene requires the phosphorylation and translocation of STAT4 into the nucleus where it binds to the IFN-γ promotor.31,33,58-60 Our observation that the removal of the lymphoid contaminants (0.2%-0.7%) from macrophage populations completely eliminated the STAT4 signal in the EMSA analysis raises the intriguing possibility that the expression of IFN-γ mRNA in macrophages occurs in a STAT4-independent manner. Conversely, the translation of IFN-γ mRNA in macrophages might only occur in the presence of STAT activation. Ongoing studies further address this issue.
In conclusion, the 2 most frequently used macrophage populations (adherent PE-MΦs and BMMΦs) contain unexpected lymphoid cells (when generated by routine methods) that account for the high amounts of IFN-γ previously found in supernatants of activated macrophage cultures. Thus, a purity of myeloid cell preparations of 95% to 98% is insufficient to attribute a specific (eg, secretory) function to the main subpopulation of cells. The discovery of T cells in cultures of BMMΦs questions the previous use of BMMΦ cultures as selective sources of macrophages. The presence ofmyeloid markers (CD11b, CD11c, CD31) on the surface of peritoneal NK cells and the expression of NK cell markers (DX5) by subpopulations of macrophages exemplify that macrophages cannot be identified by a single phenotypic marker. The observation that highly purified macrophages express IFN-γ mRNA, but fail to produce readily detectable amounts of IFN-γ protein in response to IL-12/IL-18, challenges the concept of autocrine macrophage activation and points to a hitherto unrecognized translational control of IFN-γ production.
Prepublished online as Blood First Edition Paper, September 21, 2004; DOI 10.1182/blood-2004-05-1749.
Supported by the priority program “Innate Immunity” SPP 1110 (DFG996/3-1) and the Sonderforschungsbereich 620 (project A9) of the German Research Foundation and by the European Community (QLK2-CT-2001-02103).
The online version of the article contains a data supplement.
The publication costs of this article were defrayed in part by page charge payment. Therefore, and solely to indicate this fact, this article is hereby marked “advertisement” in accordance with 18 U.S.C. section 1734.
We thank M. Modolell and N. Justies (Max Planck Institute for Immunobiology, Freiburg, Germany) for all materials and reagents required for the generation of BMMΦs, T. Miethke (Tu Munich, Germany) for C. pneumoniae, H. Mossmann (Max Planck Institute for Immunobiology, Freiburg, Germany) for providing mice, C. Kurzmann for technical assistance, and P. Rohwer (Nikolaus-Fiebiger-Center for Molecular Medicine, Erlangen, Germany), and K. Geiger and M. Follo (Core Facility, Medical Center, Freiburg, Germany) for cell sorting.

![Figure 5. IFN-γ production and STAT4 activation of unselected versus sorted PE-MΦs or BMMΦs of C57BL/6 mice. CD68+ PE-MΦs (A-C) or CD11b+F4/80+ or CD68+ BMMΦs (D-F) were purified from total PEC or BMMΦ populations by MoFlo sorting (purity ≥ 99%). (A,D) Unseparated and sorted PECs, unseparated and sorted BMMΦs, and PE-MΦs (obtained after adherence of PECs and removal of nonadherent cells) were stimulated under adherent conditions with IL-12 plus IL-18 or IFN-γ (20 ng/mL) plus LPS (200 ng/mL) for 72 hours before culture supernatants were analyzed for IFN-γ and TNF. Means (± SEM) of 3 experiments are shown. *Significantly different from unseparated PECs (P ≤ .01, unpaired Student t test). (B,E) The presence of IFN-γ+ cells in purified CD68+ PE-MΦs or CD11b+F4/80+ BMMΦs in response to IL-12/IL-18 was analyzed by ICS and FACS. Representative for 3 experiments. (C,F) Activation of STAT4 as analyzed by EMSA. Unsorted PE-MΦs or purified CD68+ PE-MΦs and unsorted or purified CD11b+F4/80+ BMMΦs were cultured without or with IL-12/IL-18 for 2 hours. As controls, the nuclear extracts were combined with the [32P]-labeled DNA probe in the presence of a 100-fold excess of the unlabeled probe, the nuclear extract was omitted from the gel shift-reaction, or nuclear extracts were prepared from unsorted STAT4-/- PE-MΦs. Representative of 3 experiments.](https://ash.silverchair-cdn.com/ash/content_public/journal/blood/105/3/10.1182_blood-2004-05-1749/6/m_zh80030573310005.jpeg?Expires=1768669607&Signature=JTRd5713RiQw~o98CXVeodf7-~gdxEzN1g6bBt4RhnM8DEjdQ0kBfQ1EeKgsfh8tkkP-QfTj52ctOEfgfY2XpHD7OvrO3EnHZeS78j0W3bHSIQJmCFruVvwPhRlSsrMX8ZiQ1o6fHl8VRV-MiC87Gwsnxph0tA1-UxZp2-VVoR~sHh7mX4uHOa7b6bD-wfVOc~88Jv95Qu5pOsCmfpI3c6zGTnVAvM8Oq27fbIFvkqdcAKDYs8Clw4bu6AmFDnLeHO-qADVKnLHcKDsstSlbcEp~7VwNIPxP-lxAfrHV5KjtQVBO-uYBa4CHtOomkdLmxNsgpWetXFaSHh-abk0XFg__&Key-Pair-Id=APKAIE5G5CRDK6RD3PGA)

![Figure 5. IFN-γ production and STAT4 activation of unselected versus sorted PE-MΦs or BMMΦs of C57BL/6 mice. CD68+ PE-MΦs (A-C) or CD11b+F4/80+ or CD68+ BMMΦs (D-F) were purified from total PEC or BMMΦ populations by MoFlo sorting (purity ≥ 99%). (A,D) Unseparated and sorted PECs, unseparated and sorted BMMΦs, and PE-MΦs (obtained after adherence of PECs and removal of nonadherent cells) were stimulated under adherent conditions with IL-12 plus IL-18 or IFN-γ (20 ng/mL) plus LPS (200 ng/mL) for 72 hours before culture supernatants were analyzed for IFN-γ and TNF. Means (± SEM) of 3 experiments are shown. *Significantly different from unseparated PECs (P ≤ .01, unpaired Student t test). (B,E) The presence of IFN-γ+ cells in purified CD68+ PE-MΦs or CD11b+F4/80+ BMMΦs in response to IL-12/IL-18 was analyzed by ICS and FACS. Representative for 3 experiments. (C,F) Activation of STAT4 as analyzed by EMSA. Unsorted PE-MΦs or purified CD68+ PE-MΦs and unsorted or purified CD11b+F4/80+ BMMΦs were cultured without or with IL-12/IL-18 for 2 hours. As controls, the nuclear extracts were combined with the [32P]-labeled DNA probe in the presence of a 100-fold excess of the unlabeled probe, the nuclear extract was omitted from the gel shift-reaction, or nuclear extracts were prepared from unsorted STAT4-/- PE-MΦs. Representative of 3 experiments.](https://ash.silverchair-cdn.com/ash/content_public/journal/blood/105/3/10.1182_blood-2004-05-1749/6/m_zh80030573310005.jpeg?Expires=1768838316&Signature=MmwAn6b6ZMe3eXe0bKQTA7yuIinxJP87ika4Tvr2jHmZYLc1or~p5rDPh3ENUiUNTRqlHPJKOC2XF~5ZgQ~PlPpU-gorZSyKTQKadKgRZ4fWBL9rW5xbjCAk6vfBFO--ChL62Dd3p-jq6SgnPUoBkaxfGfg92DwopfepQfWcPy9Cl59HfW0AkEN8iHJJWTv9z5G5gIzI6gCzszow89trXQjH9tajwS~39AMpIjVW7Eo2x11A7AVaJboqekoJje0hMigG5tBGsNpluaoUOH~r5ceKEsHuDmGO1mAP9oS~p8E-3~t9FIGhDeIdPhfIwQS5-wIDSMQ00ux13~xp5cerNQ__&Key-Pair-Id=APKAIE5G5CRDK6RD3PGA)
