Abstract
Information about the kinetic behavior and lifespan of lymphocytes is crucial to understanding the mechanisms that regulate processes such as immunologic memory. We have used in vivo labeling of dividing cells with 6,6-2H2-glucose, combined with cell sorting and gas-chromatography-mass spectrometry for deuterium enrichment, in order to analyze the kinetics of human total, naive, or memory B lymphocytes, separated from peripheral blood using monoclonal antibodies. We show that total blood B cells of young adults divide at an average rate of 1.9% (±1.0%) per day and at a similar though slightly slower rate, 1.5% (±1.3%) per day, in the elderly. Separation of naive and memory B cells according to expression of CD27 indicates that naive peripheral blood B cells divide slowly (0.46% per day), while memory cells proliferate more rapidly (2.66% per day). These data are compatible with the view that B-cell memory may be maintained by clones of proliferating B cells.
Introduction
Induction of protective immunity is often one outcome of infection and is the objective of vaccination. In most cases, maintenance of high titer immunoglobulin G (IgG) antibody is taken as evidence of continued protection, and in humans this may be maintained over many decades, but the mechanisms by which this is achieved remain poorly understood. Clearly a complete understanding of this remarkable ability of the human immune system will require much more insight into many aspects of human B-cell biology, one of which is the kinetic behavior of the B cells that give rise to antibody-forming plasma cells.
The kinetics of B cells have been studied for many years, but most experiments have been performed in rodents. These studies have demonstrated the extremely dynamic nature of the B-cell compartment. Thus, in young rats the daily rate of production of surface immunoglobulin M (IgM)–negative (sIgM-) pre–B cells in the bone marrow is estimated to be sufficient to populate the entire peripheral B-cell compartment within days.1 After a delay of 1 to 2 days, sIgM+ B cells mature in the marrow from pre–B cells2,3 and then leave the bone marrow to enter blood, spleen, and lymph nodes. These recent marrow emigrant B cells can be detected as a phenotypically distinct population in the spleen, making up approximately 10% of B cells. They have a very rapid turnover, the majority being culled, with only a minority surviving to become part of the mature peripheral B-cell pool.4-6 Thus, in adults the mature circulating B-cell pool is maintained from 2 sources, continued output of cells from bone marrow and division of lymphocytes in the periphery. The relative contribution of these 2 processes is not well understood. Cell input and proliferation are balanced by death in lymph nodes, secondary lymphoid organs, and tissues.
Long-term labeling experiments with bromodeoxyuridine (BrdU) in mice have shown that mature B cells exhibit considerable heterogeneity in kinetics. Cell separation experiments using antibodies to heat stable antigen (HSA or CD24) suggest that as murine B cells mature and express less HSA, their rate of proliferation declines.1,4,5,7 The most mature (HSAlo) subset includes IgM-IgD- cells that express other Ig isotypes and show extensive somatic mutation.8 However, there have been few studies specifically addressing the kinetic behavior of this presumed memory population, although one study suggested that these cells may be relatively slowly dividing except shortly after immunization.9 Similarly, there is known to be great heterogeneity in the duration of survival of plasma cells, some bone marrow resident plasma cells surviving for more than 6 months in the mouse.10
There is remarkably little information on the kinetics of human B cells in vivo but every reason to think that the behavior of B cells in humans might differ from that in rodents, particularly the mouse. The first and most obvious is that mice are very short-lived compared to humans. While it is relatively easy to imagine individual memory B cells or plasma cells surviving without dividing or dividing only a few times during the life of a mouse, this seems less likely over many decades in humans. In addition, while in mice—even elderly mice—the frequency of somatically mutated memory B cells is low (< 5%), this is not the case in humans in whom up to 40% of peripheral blood B cells show extensive somatic mutation.8,11-13 Other aspects of B-cell biology vary greatly in vertebrate species. Thus, in birds the bursa is the site of B lymphopoiesis, while in sheep, ileal Peyer patches contribute to generation of diversity.14 Rabbits generate B-cell diversity by gene conversion,15 while mice and humans do not. There is therefore a clear need to exercise caution in extrapolating from rodent B-cell data to humans and a need to measure directly B-cell kinetics in humans.
In recent years deuterated glucose has been developed as a safe and nontoxic method for labeling dividing cells in vivo in humans.16 We and others have combined this with antibody-based cell separation methods, to analyze the kinetics of T-lymphocyte subsets in healthy adults17,18 and patients with HIV19 or Epstein-Barr virus (EBV) infection.20 These data have shown that memory T cells divide more rapidly than naive T cells, confirming earlier data obtained by other methods,21 and have shown that it is possible to use this methodology to investigate cellular kinetics in disease.16-18 Here we report for the first time the application of this methodology to study the kinetics of human B cells in vivo. We have investigated the proliferation and disappearance rates of total B cells isolated from the peripheral blood of healthy young and elderly individuals and have compared the kinetic behavior of memory (CD27+) and naive (CD27-) B cells.11,12,22,23 Implications for the maintenance of B-cell memory are discussed.
Patients and methods
Subjects
Two cohorts of healthy individuals were recruited. Young controls were younger than 35 years of age; elderly subjects were older than 65 years. Screening prior to study entry, by a physician, excluded any subjects with a history of significant known medical problems, including infection, recent vaccination, inflammatory conditions, or malignancy. All subjects gave written informed consent, and the study was approved by the Local Research Ethics Committee.
Four sets of experiments are described. First, total B-cell kinetics were investigated in 8 young controls (mean age, 25; 4 men and 4 women). Second, total B-cell kinetics were assessed in 7 elderly subjects (mean age, 77; 2 men and 5 women), one of whom was studied twice; the effects of aging were assessed by comparison with data from the young cohort. Third, the effect of CD27 expression on B-cell kinetics was investigated in a separate cohort of 6 young subjects (mean age, 23; 1 man and 5 women). Fourth, CD27 subset distribution in young and elderly subjects was compared; this group of subjects included some investigated as part of the kinetic studies and a further 6 subjects (5 young, 1 elderly) not previously included.
Measurement of cell turnover
Proliferation and disappearance rates of lymphocytes in vivo were measured by labeling dividing cells in vivo with deuterated glucose. Labeling consisted of a primed 24-hour intravenous infusion of 1g/kg 6,6-2H2-glucose (Cambridge Isotopes, MA), during which diet was restricted. Blood for measurement of plasma glucose deuterium (2H) enrichment was taken after 1 hour and approximately every 4 hours thereafter during the infusion. Blood samples for estimation of deuterium enrichment in DNA of B lymphocytes were taken 3, 4, 10, and 21 days after infusion, or on the closest days possible. Day-3 samples were omitted in the first 3 controls and the elderly cohort; in the latter, to minimize blood sampling.
Cell sorting
Peripheral blood mononuclear cells (PBMCs) were isolated from 50 mL of heparinized fresh blood by Ficoll-Paque (Pharmacia, St Albans, England) density gradient centrifugation. Cells (1 × 10⁷/mL in phosphate-buffered saline [PBS] plus 0.2% bovine serum albumin [BSA]) were stained with CD3-RPE (Serotec, Oxford, England), then sorted into CD3+ and CD3- fractions using a Moflo cytometer (Cytomation, Fort Collins, CO). For isolation of total B cells, CD3- cells were stained with CD19-allophycocyanin (PharMingen, San Diego, CA), washed, and resuspended at 1 × 10⁷/mL in PBS+ 0.2% BSA before sorting. For isolation of CD27+ and B-cell subpopulations, 2 different protocols were used. PBMCs (CO9, CO11, CO12, CO13) were stained with CD19-allophycocyanin (PharMingen) and CD27-FITC (PharMingen) and sorted into CD19+CD27+ and CD19+CD27- subsets. For CO14 and CO15, CD4-depleted PBMCs (Moflo sorted) were stained with CD19-RPE-CY5 (Serotec, Kidlington, England) together with CD27-FITC (PharMingen) and sorted into CD19+CD27+ and CD19+CD27- subsets.
Analysis of deuterium enrichment
Measurement of deuterium enrichment in DNA was essentially as previously described.17,18,20 DNA from sorted subsets was extracted and digested enzymatically to deoxynucleosides. Deoxyadenosine, purified by C-18 solid-phase extraction column chromatography, was converted to its aldononitrile triacetate derivative by reaction with hydroxylamine/pyridine (1% wt/vol, 100°C, 45 minutes) and acetic anhydride (room temperature, 30 minutes) and analyzed by gas chromatography mass spectrometer (GCMS) (ions m/z 198 and 200 by positive chemical ionization [PCI] in selective ion monitoring [SIM]; HP-225 column, HP 6890/5973 GCMS; Hewlett Packard, Bracknell, United Kingdom). Abundance-matched samples were analyzed in triplicate alongside a standard curve derivatized concurrently. Plasma glucose enrichment was measured using the same derivatization (m/z 328 and 330). Typical precision of reproducibility of the M+2/M+0 ratio was 0.02%.
Modeling
Results were expressed as the fraction of labeled cells (F) present on each day, given by the ratio of the enrichment of label in DNA (E), which is measured, and the precursor enrichment, b (mean glucose enrichment × 0.65). F was plotted against time following labeling. The magnitude of the peak value for F represents a crude measure of the extent of cellular proliferation, although this does not take into account cell death prior to peak labeling.
Proliferation and disappearance rate constants were estimated according to the following premises as previously described.16-18 The rate of increase of labeled deoxyadenosine (A*) is given by the product of 3 factors: the likelihood of a newly incorporated precursor being labeled (b), the rate of proliferation of new cells (p), and the total amount of deoxyadenosine (A). Thus, the rate of increase of labeled deoxyadenosine (A*) is given by bpA. However, at the same time, labeled deoxyadenosine is lost by death, migration out of peripheral blood, or change of cell phenotype. This is given by A*d*, where (d*) is the rate of loss of labeled deoxyadenosine.
During the labeling period acquisition and loss of label occur concurrently such that
where t is time and τ is the length of the labeling period.
After the labeling period, only loss of label occurs, given by
Since E = A*/A, and F = E/b, the fraction of labeled cells at a given time can be solved to give
assuming no changes in lymphocyte pool sizes during the experiment.
This model was fitted to the data using nonlinear least squares regression (Sigmaplot v8.02; SPSS, Woking, United Kingdom) to yield the cellular proliferation and disappearance rate constants, p and d* (both constrained to be ≥ zero). In this model no assumption of equality between p and d* has been made; p represents the average proliferation rate of the whole population, whereas d* refers only to labeled cells (ie, cells that divided during the labeling period), as distinct from d, the rate of disappearance of all cells (labeled and unlabeled) which, at steady state, will be equal to p. For a kinetically heterogeneous population, even one at steady state, p and d* will not be the same, as discussed elsewhere.16-18 Values shown here will be broadly comparable with data derived from peak height alone, as used in some comparable literature, although our proliferation rate estimates will be slightly higher because of the inclusion of a modeled amount of cell death prior to the peak labeling measurement.
Proliferation was also expressed as estimated doubling-time (t2 = ln2/p), equivalent to the mean intermitotic time (we do not imply by this that there is a doubling of cell numbers, as the B-lymphocyte population is of roughly constant size over the period of the experiment). Similarly, disappearance was expressed as half-life (t1/2 = ln2/d*), representing the time to loss of half of labeled cells from blood. Data are expressed as mean plus or minus 1 standard deviation, except for average t2 and t1/2, where the doubling-time/half-life equivalent of the mean p or d* are shown (1n2/p̄,1n2/d̄*) rather than the mean of the individual values, as the latter constitute a very skewed distribution, including values equivalent to infinity where rates of turnover were below the limit of detection. Comparisons between groups were made by either paired or unpaired Student t test; all tests were 2-tailed.
Results
B-cell kinetics in young subjects
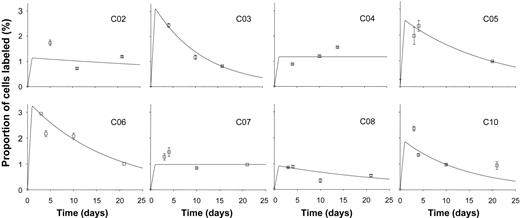
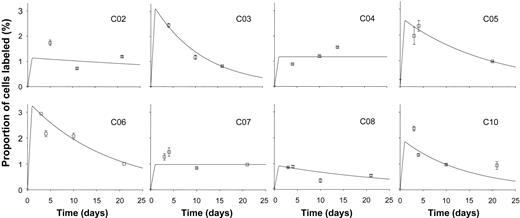
Following infusion of 6,6 2H2-glucose, enrichment of deuterium in DNA from B cells was found in most young subjects to peak at day 3 or 4 and fall thereafter (Figure 1). Best fit curves based on the model described in the previous section were plotted (Figure 1), and values for proliferation and disappearance rate constants were derived (Table 1). Mean B-cell proliferation rate was 1.9% (±1.0%) per day, equivalent to a doubling time of cells within this population of about 36 days (Table 1). Disappearance rates exceeded proliferation rates for most subjects, although for CO4 and CO7 no disappearance rate could be modeled, and it was taken as zero. Mean disappearance rate for the whole group (n = 8) was 3.9% (±3.4%) per day (Table 1), equivalent to a half-life of about 18 days.
Labeling kinetics of peripheral blood B cells in healthy young subjects. Values represent fraction of B cells labeled (F, as defined in “Modeling” above) at time points after 24-hour infusion of 6,6-2H2-glucose. Error bars indicate SD of GCMS measurement of enrichment. Lines show the best fit to the model, assuming peak labeling at 24 hours. All graphs are on the same scale.
Labeling kinetics of peripheral blood B cells in healthy young subjects. Values represent fraction of B cells labeled (F, as defined in “Modeling” above) at time points after 24-hour infusion of 6,6-2H2-glucose. Error bars indicate SD of GCMS measurement of enrichment. Lines show the best fit to the model, assuming peak labeling at 24 hours. All graphs are on the same scale.
B-cell kinetics in healthy elderly individuals
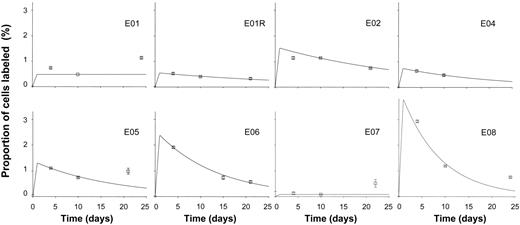
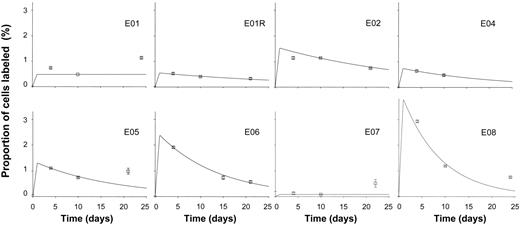
When B-cell kinetics were investigated in healthy elderly individuals, similar overall patterns of labeling in DNA of B cells were found (Figure 2). Proliferation and disappearance rate constants are shown in Table 1. Overall, there appeared to be a slight reduction in the turnover rate of B cells in elderly subjects, with a mean proliferation rate of 1.5% (±1.3%) per day, equivalent to doubling time of 45 days. However, in this initial study, with small numbers of subjects, this difference between young and elderly was not statistically significant (P = .4 by 2-tailed t test). Exclusion of day 3 data from the young dataset, to ensure comparability, did not substantively alter the result for the young control group or the comparison between groups.
Labeling kinetics of peripheral blood B cells in healthy elderly subjects. Values depicted as for Figure 1.
Labeling kinetics of peripheral blood B cells in healthy elderly subjects. Values depicted as for Figure 1.
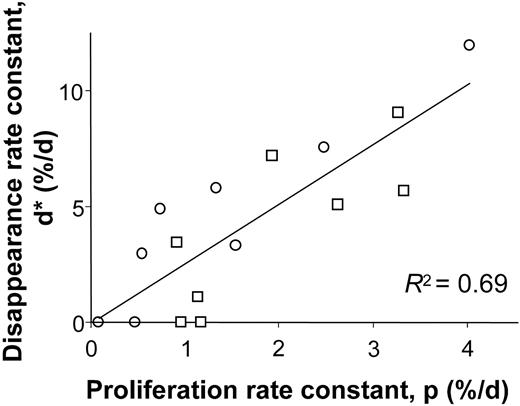
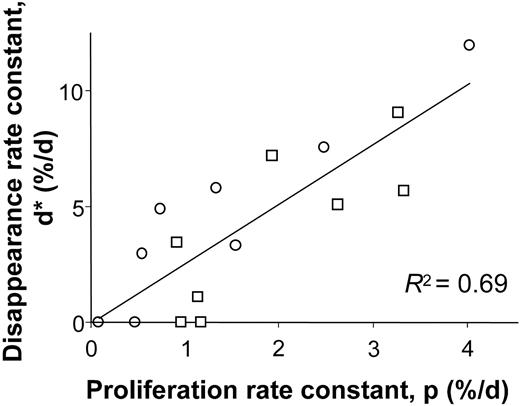
When proliferation and disappearance rates were compared, a clear relationship was observed (r2 = 0.69, Figure 3), although disappearance rates tended to be higher than corresponding proliferation rates, as indicated by the regression line slope of 2.6. This result accords with our earlier findings for T cells that disappearance rates for labeled cells exceed rates of labeling for the whole cell population, perhaps because cells that have recently divided are at higher risk of death by apoptosis.17,18 Clearly if the intrinsic rate of cell division of B cells differs between individuals, those individuals with high rates of division (eg, C03, C06, E02, and E08; Table 1) also must have higher rates of cell death in order to maintain homeostasis.
Relationship between modeled B-cell proliferation and disappearance rate constants. Values from young (□) and elderly (○) healthy subjects.
Relationship between modeled B-cell proliferation and disappearance rate constants. Values from young (□) and elderly (○) healthy subjects.
CD27 and B-cell kinetics
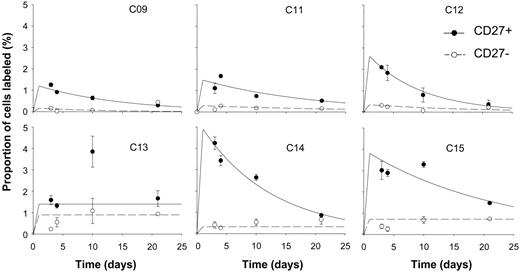
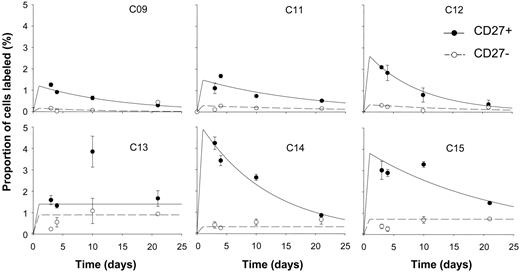
In view of the identification of CD27 as a marker for memory B cells, labeling of CD27+ and CD27- cells was compared. In all 6 subjects analyzed, labeling rates in CD27+ cells were higher than in CD27- cells (Figure 4), although in one subject, modeling was difficult because of high variability in the analytic data and apparent late rises in labeling. Modeled variables for proliferation and disappearance (Table 2) revealed a mean proliferation rate for CD27+ cells about 5 times higher than for CD27- cells (2.66% versus 0.46% per day, P = .02 by paired 2-tailed t test). Thus the “memory” (CD27+) population of B cells appears to have a higher proliferation rate than the CD27- “naive” population of cells. Interestingly, disappearance rates showed far less discrimination between the two, suggesting that in both these subsets, as in most T-cell subsets, cells that have recently divided are at a similar increased risk of cell death.17,18 In some subjects (C13, C14, C15; Figure 4), there appears to be a small late rise in labeling of CD27- cells. This may indicate late emergence of some CD27- B cells into blood after a long lag phase after labeling. Such cells might represent bone marrow–derived cells undergoing postmitotic maturation before trafficking to lymphoid organs. In 2 individuals (C13 and C15), peak labeling of CD27+ cells is at day 10. Whether this represents postlabeling maturation of clonally expanding antigen-stimulated B cells prior to their appearance in peripheral blood or has some other explanation remains to be determined.
CD27 expression and kinetics of peripheral blood B cells in healthy young subjects. Fraction of cells labeled (F) at time points after 24-hour infusion of 6,6-2H2-glucose in B cells separated into CD27+ (⬡, solid line) and CD27- (○, dashed line) subsets. Error bars indicate SD of GCMS measurement of enrichment. Lines show the best fit to the model, assuming peak labeling at 24 hours. All graphs are on the same scale.
CD27 expression and kinetics of peripheral blood B cells in healthy young subjects. Fraction of cells labeled (F) at time points after 24-hour infusion of 6,6-2H2-glucose in B cells separated into CD27+ (⬡, solid line) and CD27- (○, dashed line) subsets. Error bars indicate SD of GCMS measurement of enrichment. Lines show the best fit to the model, assuming peak labeling at 24 hours. All graphs are on the same scale.
Distribution of CD27+ and CD27- cells in young and elderly subjects
Since CD27+ and CD27- subsets have very different rates of proliferation (Table 2), the overall kinetics of unseparated B cells represent a composite of the kinetics of the 2 subsets, and differences in kinetics may arise as a consequence of changes in subset distribution rather than in the behavior of phenotypically identical cells. We therefore studied the distribution of CD27+/- subsets among CD19+ B cells of young and elderly subjects. Table 3 shows data from 10 young and 5 elderly subjects, of whom 5 and 4, respectively, had been included in kinetic analyses. There is a clear trend toward an increased proportion of CD27+ B cells in the elderly (mean 26.2% versus 47.4%, young versus elderly, P < .01 by 2-tailed t test).
Discussion
After immunization or infection, serum antibody titers are maintained at protective levels for long periods. In humans this may be for many years. However, although many of the molecular mechanisms by which high-affinity isotype-switched immunoglobulins are generated have been worked out, the cellular mechanisms responsible for long-term antibody production are much less well understood and have most often been studied in short-lived species, such as the mouse. Maintenance of antibody production in long-lived humans presents problems of a different order of magnitude. An important parameter that must contribute to determining the duration of antibody production or B-cell memory (here defined as expanded clones of antigen-specific cells containing somatically mutated Ig genes that are not high-rate antibody secreting cells) is the kinetic behavior of B lymphocytes. In this study we have analyzed, for the first time, rates of proliferation and death or disappearance of human peripheral blood B cells in young and elderly healthy individuals. Further, we have examined separately the behavior of phenotypically defined naive and memory B cells in young adults.
In the mouse, the kinetic behavior of B cells has been studied for many years and produced very varied estimates of rates of cell division and survival. However, many of the methods used in earlier experiments disturbed the immune system or failed to enumerate all B cells. More recently, a consensus has emerged through the use of in vivo labeling methods less prone to artefacts (reviewed in Fulcher and Basten7 ). Several studies in the mouse and rat indicate that a high proportion of bone marrow sIgM- B-cell precursors are rapidly labeled by BrdU,4,6 while sIgM+ bone marrow B cells are labeled only after a delay of 1 to 2 days, indicating that they undergo a period of postmitotic maturation. Many of these cells leave the bone marrow within 3 days and appear in the blood, spleen, and then lymph nodes.2,3 Labeling of cells in the bone marrow that have a long postmitotic maturation period before exiting from the marrow might account for the late rise in label seen in some individuals. Estimates of the rate of production of B cells suggest that 20 to 50 × 106 pre–B cells are produced daily in young rats, enough to replace totally the peripheral B-cell pool of approximately 150 million cells in a very few days.1 However, only a minority (3%-20%) of B cells produced in the marrow enter the peripheral mature B-cell pool, with the rest being culled either in the marrow or elsewhere.4,5
In the spleen, long-term labeling experiments with BrdU indicate considerable heterogeneity of rates of labeling, but 2 dominant patterns are apparent. Immature B cells (B220lo HSAhi) label rapidly, decay within days, and represent recent immigrants to the spleen from bone marrow, while about 50% of the mature B cells that represent approximately 85% of splenic B cells (phenotypically B220hi HSAlo IgMlo-hi/IgDhi or HSAlo IgMhi/IgDlo) divide within 5 to 6 weeks.7,24 These 2 subsets of splenic B cells can be separated according to the level of expression of heat-stable antigen (HSA or CD24). HSAhi cells (recent immigrants from the marrow) label rapidly, HSAint (mature recirculating B cells) more slowly, and HSAlo (more mature still and including memory cells) label yet more slowly.4,25 There are considerable difficulties in comparing these data with the results we have obtained in humans; most obviously that we have studied only peripheral blood while there are no rodent data on the kinetics of blood B cells. Furthermore, it is clear that blood is unlikely to contain some types of B cells that are found in lymphoid organs, such as germinal center cells. However, in the mouse the major population of splenic B220hi HSAlo IgM+ IgD+ B cells have germ line configuration Ig genes8 and appear to be mainly mature antigen-reactive cells. These cells appear equivalent to the majority (∼ 75%) of human blood B cells in young adults (Table 3), which are CD27-IgM+ IgD+ and also carry germ line configuration Ig genes. Irrespective of whether human blood B cells exactly correspond to the major murine splenic population, 50% of these cells divide in young adult humans in approximately 5 weeks (Table 1), which is very comparable to the mouse.7,24 These data suggest that in humans, as in mice, the total B-cell pool is highly dynamic, exhibiting a considerable rate of turnover.
Our values for in vivo proliferation rates of peripheral blood B cells in humans (1.9% per day) are similar to values obtained in sheep and cows using in vivo BrdU labeling. Studies in 3 sheep, each studied twice, demonstrated a mean proliferation rate of 1.1% per day26 and a similar disparity between proliferation and disappearance of labeled cells to that described in “Results,” although the absolute value for labeled B-cell disappearance in sheep (9.4% per day) was higher than we observed in humans (3.9% per day). Interestingly, such ovine studies demonstrated that a minority of B cells may survive for extended periods of time. In cows, similar studies have estimated peripheral B-cell proliferation rates at about 1% per day.27
Since in the mouse different subsets of B cells exhibit very different rates of cell division, ranging from rapidly dividing B-cell precursors through the relatively slowly dividing mature B-cell pool to antibody-secreting bone marrow resident plasma cells with a lifespan of 6 months or more,28,29 it was clearly important in seeking to understand human B-cell homeostasis to investigate the kinetics of B-cell subsets. In humans, antibodies to CD27 have been found to separate 2 major subsets of B cells. CD27- cells are IgM+ IgD+ and have germ line configuration Ig genes, while CD27+ B cells show somatic mutations and are therefore presumed to have encountered antigen.11,12,22,23 This primed or memory population exhibits further heterogeneity containing both an IgM+ IgD+ subset with somatically mutated variable regions, that is now thought to represent marginal zone, T-independent B cells, responsive to encapsulated bacteria30 and IgD- cells that have surface IgM, IgG, or IgA and more extensive somatic mutation.11,12 These memory subsets make up a significant proportion of blood B cells (Table 3), but evidence from studies of latent EBV infection in human B cells suggest that there is free trafficking between compartments such as the tonsil, spleen, and peripheral blood.31 Memory phenotype-labeled B cells in blood may therefore represent marginal zone cells that have recently divided and then migrated out of lymphoid tissues, as division within the blood appears very rare. Strikingly, we found that the kinetics of blood CD27- (naive) and CD27+ (memory) populations differ greatly. CD27- cells divide slowly (t2 of about 5 months), while CD27+ cells divide much more rapidly (t2 of about 1 month).
At first sight our results appear to contradict data showing that more mature (memory) murine B cells, defined by expression of low levels of HSA, turn over more slowly.7 However, the differences may be more apparent than real. Following immunization of mice, antigen-stimulated cells entering the memory pool initially divide rapidly, but by 20 weeks after antigen exposure have become slowly dividing.9 If blood B cells of humans were enriched for recently antigen-activated B cells, the rapid proliferation rate observed in the CD27+ subset would be in agreement with the mouse data. In accord with this idea, it is known that immunization of humans leads to an increase in the frequency of antigen-specific B cells in peripheral blood, peaking at approximately 1 week after a booster immunization.32 Many of these cells have the phenotype of plasma cells, being CD27hi CD20lo CD38+. Since in the present experiments we have separated all CD27+ cells, it is not clear whether the measured proliferation rate of this subset conceals a rapidly dividing smaller subset of recently activated memory B cells. Among CD4+ T cells we have shown that effector memory cells turn over more rapidly than central memory and more strikingly still, most of the proliferation of CD4+ CD45RA+ “naive” cells is within a very small CCR7- subset.33 Thus, small subsets may have a profound influence on the kinetics of larger populations. Further cell separations will resolve this issue for B cells. However, it is known that human memory B cells proliferate much more readily in vitro in response to “danger” signals, bystander T cells, and cytokines such as interleukin-2 (IL-2), IL-10, and IL-15,32,34,35 suggesting that the memory population also proliferates in vivo in response to similar stimuli. This would be in accord with data showing the important role of cytokine-driven proliferation in the homeostasis of memory T cells in vivo36 and our own evidence showing that the turnover of memory T cells is consistently more rapid than that of naive T cells.17
The disparity between p and d* (Tables 1 and 2; Figure 3) has been described and discussed in detail for T cells and may be explained if labeled cells are derived predominantly from a fast turnover subset or if division and cell death are temporally linked.17,18,20 In addition, for B cells, entry of unlabeled cells (because they divided prior to the labeling phase) into the peripheral blood pool from compartments such as bone marrow or lymphoid tissue may also contribute to this disparity, analogous to the mathematical “source” term used in some models.37 The correlation between p and d* (Figure 3) would be expected on homeostatic grounds, particularly since activated B cells proliferate and transform into tissue-resident plasma cells, thus disappearing from the circulation. It also may represent different proportions of activated B cells in different individuals, although this was not measured.
Elderly humans exhibit relative immunodeficiency with an increased susceptibility to infection and evidence of altered immune function.38 Among T lymphocytes, there is an altered distribution of subsets and, within the memory pool, increased numbers of large clones.39,40 In contrast, there is much less data on alterations in the B-cell compartment during aging in humans, although changes in the antibody repertoire and monoclonal gammopathy of undetermined significance are known to occur in the elderly.41,42 The data of Table 3 indicate a change in the distribution of B-cell subsets in elderly subjects, with an increase in CD27+ memory cells, which others have reported previously.43 Thus, in both T- and B-cell compartments, there appears to be a tendency for lymphocyte pools to “fill up” with memory cells, with consequent displacement of naive phenotype cells, though the reasons for this are not well understood. Rodent data indicate that the turnover of B cells alters with age,7,44 but it is less clear whether there is a decline in output of B cells from the marrow in older mice45 or humans,46,47 although data from human bone marrow transplants suggest that children reconstitute B-cell function more rapidly than adults do.47 On the other hand, experiments in old mice have shown that full reconstitution of B-cell function is possible after irradiation with partial bone marrow shielding.48 It seems likely, therefore, that a decline in B-cell output from the marrow is not a major determinant of impaired B-cell function in the elderly.
We have not yet investigated the kinetics of B-cell subsets in the elderly but found no difference in the kinetics of the total B-cell pool between elderly and young subjects, although there may be a trend toward a slower rate of proliferation in the elderly. This is at first sight surprising in that older people have an increased proportion of memory cells, which, at least in the young, show more rapid proliferation than corresponding naive cells. However, among CD8 T cells in the elderly, there is an accumulation of a memory subset with both a slow rate of cell division and slow death rate.49 Accumulation of these cells is thought to be driven by cytomegalovirus and other chronic virus infections.50,51 Similar effects of infection on B cells together with increasing numbers of monoclonal gammopathies might account for altered and more variable kinetics in the elderly. Further investigation may well reveal other alterations that could contribute to the relatively poor antibody responses seen in this age group.
Our results, even in the young, show more variability than we have generally seen in T-cell subset kinetics in healthy individuals, particularly in the disappearance phase. Variability may arise from 4 principal sources: purity of cell sorting, analytic variation, modeling uncertainty, and physiologic variation. Some variability may arise from the purity of the cell sorting. Contamination is more likely with smaller cell populations such as B cells, which represent only 5% to 15% of PBMCs, compared to 70% for T cells. Sorting these smaller populations and even smaller CD27+ and CD27- subsets to high purity is technically demanding. Analytic reproducibility was very good, particularly for estimation of peak labeling; however, during the disappearance phase, label enrichments are much lower and therefore susceptible to larger errors. Thus, estimates of p are more likely to be reliable than estimates of d*. Finally, there is an inherent uncertainty in the modeling process, particularly in terms of extrapolating back to the end of the labeling period from the first data point; this is necessary, as labeled cells do not appear immediately in the circulation and so cannot be sampled earlier than day 3 or 4. The estimation of p is considered more reliable than that of d*, and this is reflected by a smaller standard error of the estimate for p (median value, 0.22) than for d* (0.89). However, the greatest source of variability is likely to be physiologic in this group of outbred humans potentially exposed to intercurrent subclinical infections, and the scatter in values for p and d probably represents true interindividual variability.
This is the first investigation of B-cell kinetics in vivo in humans. The B-cell compartment appears to be under long-term homeostatic control. Dysregulation of such homeostasis is one element of lymphoproliferative diseases such as chronic lymphocytic leukemia (CLL) in humans and bovine leukemia virus–induced disorders in cows and sheep.26,27 We have shown that the B-cell compartment is dynamic, with rates of proliferation and death/disappearance comparable to those found among T cells. As for T cells, naive B lymphocytes in adult humans appear to have a slow turnover, while B cells that have encountered antigen turn over much more rapidly. Analysis of further subsets would allow further definition of B-cell homeostasis. Our data are compatible with a model in which mature naive B cells divide infrequently and require multiple signals though surface Ig and coreceptors for activation and clonal expansion.32,35,52-54 In contrast, once activated and after a burst of rapid proliferation, somatic mutation, and class switching, B-cell memory is thereafter maintained as proliferating clones of cells.
Prepublished online as Blood First Edition Paper, January 11, 2005; DOI 10.1182/blood-2004-09-3740.
Supported by the Edward Jenner Institute for Vaccine Research and is paper number 84 of the institute. Supported by an MRC (Medical Research Council)–Glaxo Wellcome Clinician Scientist Fellowship (D.C.M.), the Medical Research Council (H.G.), the Wellcome Trust (Y.Z.), and the Leverhulme Trust (B.A.).
The publication costs of this article were defrayed in part by page charge payment. Therefore, and solely to indicate this fact, this article is hereby marked “advertisement” in accordance with 18 U.S.C. section 1734.
We are grateful to Andy Irvine for technical support, to Elka Giemza for nursing assistance, and to the subjects who willingly took part.

