Abstract
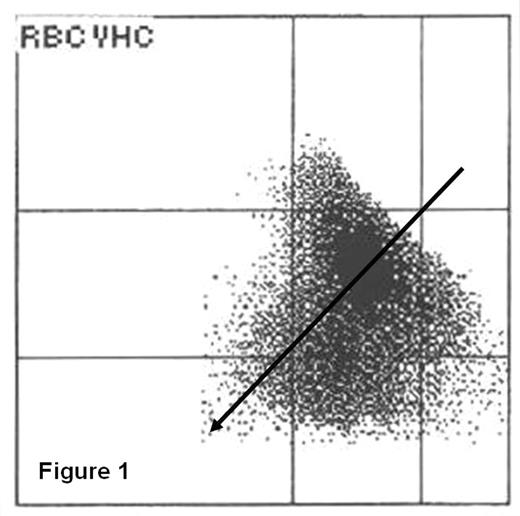
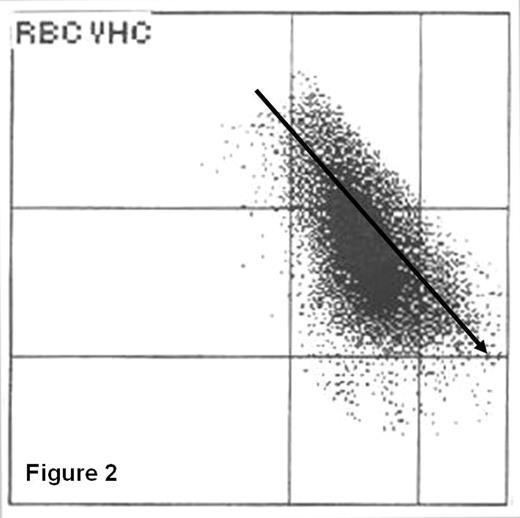
The scatter plots of red blood cells (RBC), called erythrogram produced by the ADVIA® 2120 cell counter gives a visual representation of RBC characteristics. Using a pair of threshold gates on each axis, nine areas are defined according to the cell volume and the hemoglobin (Hb) content. Normal RBC are distributed in the central quadrant. In diseases such as iron deficiency and thalassemia the erythrogram shows a characteristic pattern commonly used for diagnostic approach. We observed in patients, mainly with myeloid diseases with ringed sideroblasts (RS) in the bone marrow a particular erythrogram pattern with a broad distribution of the RBC and a marked variation in RBC size and hemoglobinization. From the central quadrant an abnormal RBC population shifts on an imaginary axis to the lower-left quadrant representing a tail advancing into the microcytic and hypochromic quadrants (Fig1). To confirm whether this particular erythrogram was predictive for bone marrow sideroblastic changes; we compared retrospectively the erythrogram of patients with RS to a group of myeloid diseases without RS. Between January 2004 and August 2005, 33 of 1973 cases with more than 15% of RS in the marrow were identified, 21/33 patients were evaluable (AML=2, MDS=13, MPS=1, MDS/MPS=3, non neoplasia=2). These patients were compared to 30 consecutive cases with myeloid diseases without RS (No RS) (AML=16, MDS=11, MPS=2, MDS/MPS=1). In addition to the erythrogram pattern, Hb, RBC indices, and bone marrow iron staining were analyzed in both groups. We defined two types of erythrogram pattern in respect of sideroblastic changes: a) typical (fig1) b) non typical: any other pattern (i.e. macrocytosis, fig 2). The erythrogram was typical in 17/21 patients with RS and in 0/30 patients with No RS (p<0.0001). The positive predictive value for sideroblastic changes was 100% and the negative predictive value was 88%. Despite the RBC indices comparison showed statistical significance in some variables, they were not specific enough to identify sideroblastic changes. In the group with RS, mean cell Hb was lower (median 30.8 versus 33.6pg), RBC distribution width was higher (19.3 versus 16.5%), the % of hypochromic RBC was higher (5.3 versus 0.9%) and Hb content of reticulocyte was lower (33 versus 37 pg) compared to No RS patients (p<0.05). This last index was particularly useful to rule out iron deficiency in RS group as a cause of hypochromic RBC changes, since in contrast to iron deficiency it was not decreased. In conclusion: sideroblastic changes can be recognized in the erythrogram. Indeed, despite myeloid diseases with RS are a heterogeneous group of diseases they have a common pattern of RBC distribution that can be considered as a kind of fingerprinting for sideroblastic changes with a high predictive value allowing a straightforward diagnostic approach in clinical practice.
Author notes
Corresponding author


