Abstract
The pathogenesis of chronic lymphocytic leukemia (CLL) is unknown but may involve aberrant activation of signaling pathways. Somatic hypermutations in rearranged immunoglobulin heavy-chain (IgVH) genes allow a division of CLL patients into 2 categories: mutated IgVH genes are associated with an indolent disease, whereas unmutated IgVH genes define an aggressive form. Using differential display to compare gene expression in CLL cells with and without IgVH hypermutations, we identified a novel gene, CLL up-regulated gene 1 (CLLU1), that was highly up-regulated in CLL cells without IgVH hypermutations. CLLU1 mapped to chromosome 12q22, within a cluster of genes that are active in germinal center B cells. However, appreciable levels of CLLU1 were detectable only in CLL cells and not in a panel of normal tissue extracts or in any other tested hematologic malignancy. High expression of CLLU1 in CLL samples occurred irrespective of trisomy 12 or large chromosomal rearrangements. CLLU1 encodes 6 mRNAs with no sequence homology to any known gene, and most transcripts appear to be noncoding. Two transcripts, however, potentially encode a peptide with remarkable structural similarity to human interleukin 4. These data, in particular the unique and restricted expression pattern, suggest that CLLU1 is the first disease-specific gene identified in CLL.
Introduction
Many hematologic malignancies are characterized by aberrant and constitutive activation of oncogenes such as ABL, c-MYC, BCL-2, and Cyclin D1. This feature is often caused by disease-specific balanced chromosomal translocations, such as t(9;22) in chronic myelogenous leukemia (CML), t(8;14) in Burkitt lymphoma, t(14;18) in follicular lymphoma, and t(11;14) in mantle-cell lymphoma. However, for other hematologic diseases, knowledge of the genetics underlying malignant transformation is still limited. One such case is chronic lymphocytic leukemia (CLL), the most common leukemia in the Western world.1 The clinical course of CLL is variable. For about half the patients the diagnosis of CLL will not affect morbidity or mortality, while for the rest of the patients, CLL constitutes a malignant disease that substantially reduces the life expectancy. At present no consistent aberrant oncogene activation or balanced translocation has been identified in CLL. Instead several common genetic aberrations are found in proportions of the CLL patients. The most abundant chromosomal change is del13q14, which can be detected in 50% to 80% of CLL patients dependent on the detection technique; del13q14 is associated with a favorable prognosis compared to normal karyotype.2 About 20% of CLL patients harbor 3 copies of chromosome 12, but this aberration is more common in atypical CLL, and it is associated with slightly worse prognosis than normal karyotype.2 The cytogenetic aberrations in CLL associated with poor outcome are del17p13 (5%-10% of CLL patients) and del11q22 (10%-15% of CLL patients), which involve deletion of tumor suppressors p53 and ATM, respectively.3 However, del17p13 and del11q22 are sometimes seen only in subpopulations of the CLL clone, often after treatment, suggesting that cytogenetic clonal evolution occurs as the disease evolves.
Numerous studies have been carried out to identify genes involved in the pathogenesis of CLL. The search for differentially expressed genes has mainly been performed by DNA-array studies4,5 and, although powerful, this methodology will inherently investigate only known gene transcripts. The microarray studies did clarify, though, that CLL, despite its heterogenic nature, is one disease entity with a common genetic phenotype resembling memory B lymphocytes.4,6 This suggests that all CLL cases must share some aspects of pathogenesis. The difference in clinical course has been shown to be associated with the degree of somatic hypermutation in the immunoglobulin heavy chain variable region (IgVH) of the B-cell antigen receptor on the CLL cells.7,8 Using microarrays, a multitude of genes have been found to be differentially expressed between IgVH unmutated and IgVH mutated CLL patients; examples are lipoprotein lipase (LPL)4,6,9,10 and AICL.4,6 However, the most differentially expressed gene, highly expressed in CLL cells without IgVH hypermutations, was the tyrosine kinase ZAP-70,6 which has proven to be a strong prognostic marker.11,12 Thus, while the array studies provided new information concerning the cell of origin for CLL, a common overexpressed disease-specific gene or a genetic aberration that affects all CLL cases has not been identified.
We decided to use an alternative technique, differential display (DD), to identify genes involved in CLL. DD has the advantage that it allows for detection of novel as well as known mRNAs. On the basis of the prognostic dichotomy provided by IgVH mutational status7,8 we used this technique to search for genes associated with poor prognosis in CLL. In this report we describe the identification, cloning, and characterization of the novel gene CLL up-regulated gene 1 (CLLU1), which is located on chromosome 12q22.
Materials and methods
Preparation of cells
Blood samples were collected from untreated CLL patients. All patients gave informed consent to the use of blood samples for research, and the research protocol was approved by The Regional Committee for Scientific Ethics (KF 01-021/03). Mononuclear cells were isolated by lymphoprep separation (Nycomed Pharma, Oslo, Norway); the percentage of CD5+CD20+ CLL cells in the mononuclear fraction was more than 90% in all samples as determined by flow cytometric analysis. Normal B cells were MACS isolated CD19+-lymphocytes from lymphoprep-separated buffy coats from healthy donors. Purified B cells (2 × 10⁶ cells/mL) were cultured in RPMI with glutaMAX containing 10% fetal calf serum and 1 mg/mL each of penicillin and streptomycin. Cells were left unstimulated or stimulated for 24 hours. with goat-antihuman IgM (50 mg/mL final) and/or CD40L (1 mg/mL final) and/or interleukin 4 (IL-4) (30 ng/mL final). Normal CD19+CD5+, CD19+CD5-, CD19+CD27+, and CD19+CD27- B-cell subpopulations were obtained by cell sorting using a FACSVantage SE Diva (BD Biosciences, Franklin Lakes, NJ) in purity mode. MACS separation with anti-CD19-coated or anti-CD138-coated magnetic beads was used to purify malignant cells from leukemia and lymphoma samples.
Laser-assisted microdissection was performed on frozen tissue from 2 reactive lymph nodes, as previously described.13 Germinal centers were captured, and total RNA was extracted using the TRIzol reagent according to the manufacturer with minor modifications.14 IgVH mutational status and ZAP-70 levels were determined as described.43
RNA preparation and differential display screening
Total RNA was prepared from blood using the RNeasy kit from Qiagen as described by the manufacturer (Qiagen, Hilden, Germany). RNA samples were double-DNAse digested, first “on-column” as described by the manufacturer and then in solution after the RNA had been purified.15 cDNA was prepared using one-base-anchored AAGCT11V (V = A, C, or G) downstream primers. Differential display reverse transcription (DDRT)16 was subsequently performed using either 1- or 2-base-anchored (AAGCT11VN; n = A, C, G, or T) primers in combination with different upstream primers. Bands of interest were cut from the DD gels and reamplified using the upstream and downstream primers that displayed the bands, but the downstream primer was extended at the 5′-end with a T7-promotor sequence (taatacgactcactatagggAAGCT11V; T7 promotor sequence in small letters), allowing direct sequencing on ALFexpress sequenators (Amersham-Pharmacia Biotech, Uppsala, Sweden), using a Cy5-labeled T7-promotor complementary primer. The DD method has previously been described in detail.15
cDNA library construction and screening
Total RNA was purified from CLL patients without somatic hypermutations, and poly-A+ RNA was purified using the MicroPoly (A)Purist kit as described by the manufacturer (Ambion, Austin, TX). cDNA was made by the cDNA Synthesis Kit (Stratagene, La Jolla, CA) and size fractionated into 2 pools (300-2500 bp and > 2500 bp), ligated to the λ-Uni-ZAP-XR vector, packaged into phage particles (GigaPack Gold; Stratagene), and test-plated as described (Stratagene). The yield was 1.5 × 10⁶ and 2 × 10⁵ plaque-forming units (pfu), respectively for the 2 size fractions, with 1.2% and 3.2% nonrecombinants, respectively. For screening, all pfu from fraction 1 were plated on 2 22 × 22 cm screening plates (100 000 on each), and 750 000 pfu from fraction 2 were plated on 5 plates (150 000 on each). Plaques were lifted to replica nylon filters (Amersham) and screened using 6 different 32P-random primed-labeled probes, starting with the identified DD fragment, but expanded with DNA fragments made by polymerase chain reaction from cDNA or genomic DNA, covering from the start of exon 1 to exon 3 (Figure 2). Positive plaques were replated and converted to plasmids as described (Stratagene).
RACE, RT-PCR, and hybridization analysis
5′- and 3′-RACE (rapid amplification of cDNA ends) were performed using the SMART RACE cDNA amplification kit (Clontech, Palo Alto, CA) according to the manufacturer's instructions. The applied oligonucleotides have been provided as supplemental data (Table S1, available on the Blood website; click on the Supplemental Table link at the top of the online article). Expression of transcripts was analyzed by reverse transcriptase-polymerase chain reaction (RT-PCR). RNA was purified as described for DD cDNA was synthesized using a dT24 primer and avian myeloblastosis virus (AMV) reverse transcriptase (Amersham). cDNA synthesis: 1 μg total RNA and 0.5 μg dT24 primer were incubated in 20 μL of (final concentration): 130 mM Tris-HCl, pH 8.3; 5 mM MgCl2; 20 mM KCl; 10 units (u) AMV reverse transcriptase (Amersham) at 42°C for 1 hour. The reaction was stopped by addition of 30 μL water containing 0.1% Triton X-100, and the samples were incubated at 95°C for 1 minute and subsequently stored at -80°C. RT-PCR was made by specific primers targeting each of the identified mRNAs and the genes and ESTs in the 91 to 92 Mb region of chromosome 12; when possible, primers were designed to amplify across introns (for primer sequences, see Table S1). PCR was performed in 30 μL of (final concentration): 12 mM Tris-HCl, pH 8.3; 50 mM KCl; 1.9 mM MgCl2; 0.1% Triton X-100; 0.005% Gelatine; 250 μM dNTP; 30 pmol of each primer, and 1 μL cDNA. Cycle conditions were 1 cycle of 2 minutes at 95°C, 40 cycles of 30 seconds at 95°C, 1 minute at 62°C, 1 minute at 72°C, and finally, 1 cycle of 5 minutes at 72°C. PCR products were run on 1.5% agarose gels and visualized by ethidium bromide staining.
Semiquantitative QRT-PCR was performed on the Taqman HT7900 system (Applied Biosystems, Foster City, CA). For the analysis, one-stop RT-PCR Mix Reagents (AB4309169) was used as described by the manufacturer (Applied Biosystems), using 20 to 100 ng total RNA for each reaction. The primer and probe concentration were 200 nM and 100 nM, respectively. Analysis of the sequences of interest was performed by comparative Ct method of relative quantification using β2-microglobulin as endogenous control and a pool of purified normal B lymphocytes as calibrator. 2-ΔΔCt gives the amount of target, normalized to the endogenous reference and relative to the calibrator.17 Primers and probes are described in Table S1. Northern blotting and dot blot analysis (Human MTE, Clontech) was done according to standard procedures, using randomprimed [32P]-labeled probes.
FISH analysis
CLL cells were washed in phosphate-buffered saline and splash preparations prepared of acetic acid/ethanol fixed cells according to standard protocols. The preparations were enzymatically treated18 and dehydrated in a series of alcohol initial to hybridization. Extended DNA fibers were made as described by Fidlerova et al.19 Three BAC clones from chromosome 12q22 (RP11-756G20 [AC026113], RP11-693J15 [AC063949], and RP11-864A19 [AC012083]) were purchased from BACPAC-CHORI (Children's Hospital Oakland Research Institute, Oakland, CA). AC026113 and AC063949 overlap with 1998 bp, whereas AC063949 and AC012083 overlap with 101 422 bp. BACs were prepared using NucleoBond BAC 100 (Macherey-Nagel, Duren, Germany) according to manufacturer's instructions and digested by SAU3a (Amersham Biosciences, Freiburg, Germany). Probes were labeled with digoxigenin (AC026113 and AC012083) or biotin (AC063949). Following hybridization to interphase nuclei or DNA fibers, probes were detected by antibody conjugated to fluorescein isothiocyanate (FITC) (Zymed Laboratories, San Francisco, CA) or by avidin conjugated to TexasRed (Vector Laboratories, Burlingame, CA).20 Probes were labeled with AC026113 (FITC), AC063949 (TexasRed), and AC012083 (FITC). Cells were counterstained with DAPI II (Vysis, Abbott Laboratories, Chicago, IL) prior to microscopic inspection. Images were visualized by an epifluorescence microscope (Zeiss, Oberhochen, Germany) and analyzed using an Applied Imaging CytoVision Work station (Newcastle, United Kingdom).
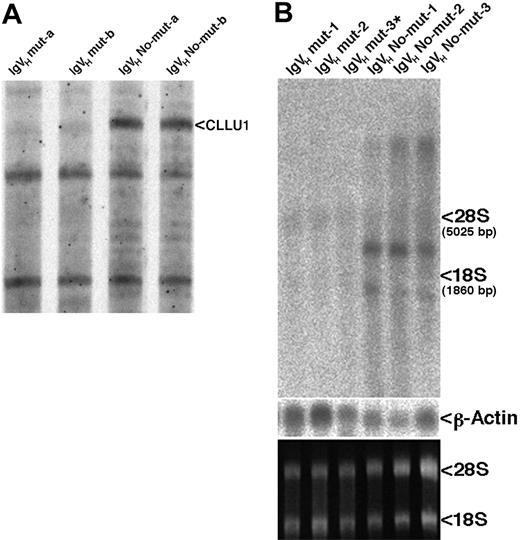
Identification and expression of CLLU1. (A) Autoradiogram of differential display screening gel. The 4 patient samples were only used for the screening. (B) Northern blot analysis of CLLU1 expression, using the differential display fragment as probe. The same blot was subsequently probed with a probe specific for β-actin. An ethidium bromide stain of the gel before transfer to the nylon filter is shown at the bottom. The weak bands across the gel at the positions where 28S and 18S rRNAs are located were probably derived from nonspecific hybridization to the rRNAs.
Identification and expression of CLLU1. (A) Autoradiogram of differential display screening gel. The 4 patient samples were only used for the screening. (B) Northern blot analysis of CLLU1 expression, using the differential display fragment as probe. The same blot was subsequently probed with a probe specific for β-actin. An ethidium bromide stain of the gel before transfer to the nylon filter is shown at the bottom. The weak bands across the gel at the positions where 28S and 18S rRNAs are located were probably derived from nonspecific hybridization to the rRNAs.
3D structure modeling
Multiple alignment of CLLU1 to IL-4 sequences was made by CLUSTALV software. The 3D models were constructed using the MODELLER program.21
Results
Identification of CLLU1
We performed a DD screening, comparing gene expression in CLL cells from 2 patients with IgVH somatic hypermutations (good prognosis, mutated) with CLL cells from 2 patients without IgVH hypermutations (poor prognosis, unmutated). We applied 90 primer combinations to the 4 samples, corresponding to analysis of approximately 11 000 mRNAs. Inspection of the DD gels showed that gene expression in good- and poor-prognosis CLL was very similar; almost all bands were displayed with the same intensity in all 4 samples. However, we identified a single band of 263 bp that was strongly displayed by the primer combination AGCACTGATTCCCAGTTA/HT11AG in the 2 unmutated samples, whereas it was absent from the mutated samples (Figure 1A).
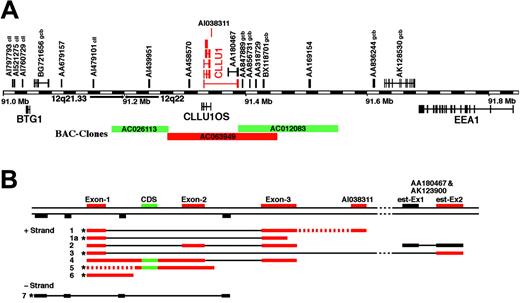
Genomic organization and structure of CLLU1 transcripts. (A) Organization of genes and ESTs in the 12q21.33 to 12q22 region. Genes above the bar are transcribed from the +strand and genes below from the -strand; gene names and accession numbers for ESTs are indicated. Expression of all the transcripts was analyzed by RT-PCR (Figure 3), and transcripts that were differentially expressed between patients with and without somatic hypermutations are shown in red. Many of the ESTs have been identified in CLL or germinal center B cells (indicated with cll and gcb, respectively). The 3 BAC clones that were used for FISH (Figure 5) are indicated. (B) Identified CLLU1 transcripts. Exons are colored red and black as in panel A, and the putative coding sequence is shown in green; introns are shown as thin black lines; dotted red lines denote that transcripts with the indicated sequences may be present. *Transcripts were cloned as cDNAs; other transcripts were detected by RACE or RT-PCR. The sequences of transcripts 1 to 7 have been submitted to the EBI database and given accession numbers AJ845162-8.
Genomic organization and structure of CLLU1 transcripts. (A) Organization of genes and ESTs in the 12q21.33 to 12q22 region. Genes above the bar are transcribed from the +strand and genes below from the -strand; gene names and accession numbers for ESTs are indicated. Expression of all the transcripts was analyzed by RT-PCR (Figure 3), and transcripts that were differentially expressed between patients with and without somatic hypermutations are shown in red. Many of the ESTs have been identified in CLL or germinal center B cells (indicated with cll and gcb, respectively). The 3 BAC clones that were used for FISH (Figure 5) are indicated. (B) Identified CLLU1 transcripts. Exons are colored red and black as in panel A, and the putative coding sequence is shown in green; introns are shown as thin black lines; dotted red lines denote that transcripts with the indicated sequences may be present. *Transcripts were cloned as cDNAs; other transcripts were detected by RACE or RT-PCR. The sequences of transcripts 1 to 7 have been submitted to the EBI database and given accession numbers AJ845162-8.
The 263-bp DD fragment from Figure 1A was used to probe a Northern blot with RNA from 3 CLL-cell samples from mutated patients and 3 samples from unmutated patients (Table 1); the patient marked with * (IgVH mut-3*) was by chromosomal analysis classified as having trisomy 12. Two transcripts of about 1700 and 2300 bp, respectively (corresponding to transcripts 1 and 1a [Figure 2B]), and a very large transcript that probably corresponded to the primary transcript were visualized. All 3 transcripts were detectable only in samples from patients with unmutated IgVH genes (Figure 1B). Thus, the differential expression was confirmed by Northern blotting analysis (Figure 1B). The blot was probed with other CLLU1 probes, however, apart from cDNA1 and cDNA1a, no other cDNAs could be detected by Northern blotting.
Sequencing of the DD band and searches in GenBank and EBI databases revealed that the sequence of the DD fragment did not match any previously described mRNA or EST sequences. Searches against the human genome (www.ensembl.org) showed that the transcript was derived from a region on chromosome 12q22 without annotated genes or ESTs (Figure 2A). The region was flanked by 2 genes, B-cell Translocation Gene 1 (BTG1), which previously has been suggested to be associated with CLL,22 and early endosome antigen 1 (EEA1)23 (Figure 2A), however, both were transcribed from the opposite strand, and the match was more than 250 000 bp from both BTG1 and EEA1.
cDNA cloning
To identify the mRNA(s) corresponding to the displayed band, we constructed a cDNA library from poly-A+ RNA prepared from CLL cells from patients without IgVH hypermutations. Aliquots representing 750 000 and 200 000 plaques from the library fractions 1 and 2, respectively, were screened with 6 different probes derived from the 12q22 region. In total, 34 clones (corresponding to almost all positive plaques) were excised and further analyzed.
Analysis of the cDNA clones showed that several distinct mRNAs were transcribed in the region (Figure 2B). Most were transcribed from the +strand, and most included sequences corresponding to exons 1 and 3, but we also isolated cDNAs that did not include introns, and one cDNA (cDNA7) encoded a transcript from the -strand (Figure 2B). We isolated a cDNA, cDNA3, composed of exon 1 spliced to exon 2 of EST AA180467 located 51 018 bp downstream from exon 3. There are very few open reading frames (ORFs) in the region. However, 2 cDNAs (cDNA4 and cDNA5) included a putative ORF potentially encoding a 121 amino acid peptide (CDS in Figure 2B), and one of these (cDNA4) contained a splice site. We also searched for putative miRNAs, but the CLLU1 region did not include any known miRNAs, and none of the detected transcripts can form the characteristic hairpin structures required for the generation of miRNAs.
RACE and PCR verification of cDNAs
To verify that the cDNAs corresponded to full-length mRNAs, we performed 5′-RACE on total RNA from several patients using primers derived from exon 1, 2, and 3, and from the CDS region. Primers located within exon 1 revealed a 5′-RACE product with 26 bp added to the 5′end of exon 1 of the longest cloned cDNA. RACE primers located within exon 3 revealed the same 5′-end in exon 1, but excluding exon 2, thus confirming the splice site between exons 1 and 3. Analysis of multiple RACE products from several patients showed an additional GT present in some mRNAs, most likely caused by variation in splice site selection at the 3′-splice site of exon 1 (splice sites: TTGTgtgag or TTGTGTgag; intron sequence in lowercase). RACE with primers located within the CDS detected several unspliced transcripts with 5′-ends upstream of the CDS (cDNA4 and cDNA5, Figure 2B). RACE with primers located in exon 2 resulted in multiple fragments, one with a 5′-end upstream of the CDS similar to cDNA5, and one (cDNA2 in Figure 2B) with exon 1 spliced to exon 2, confirming the splice site between exons 1 and 2.
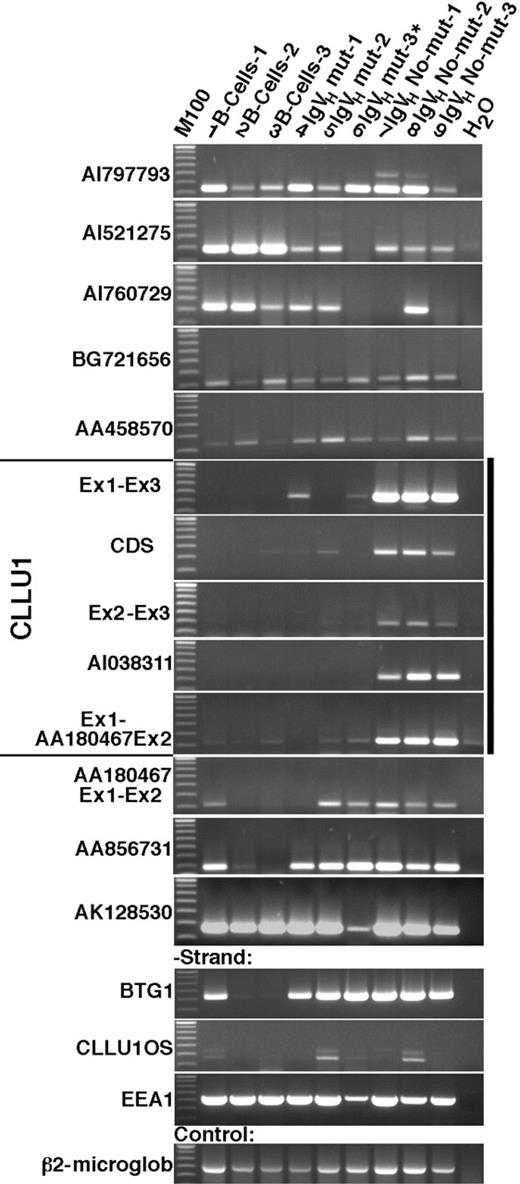
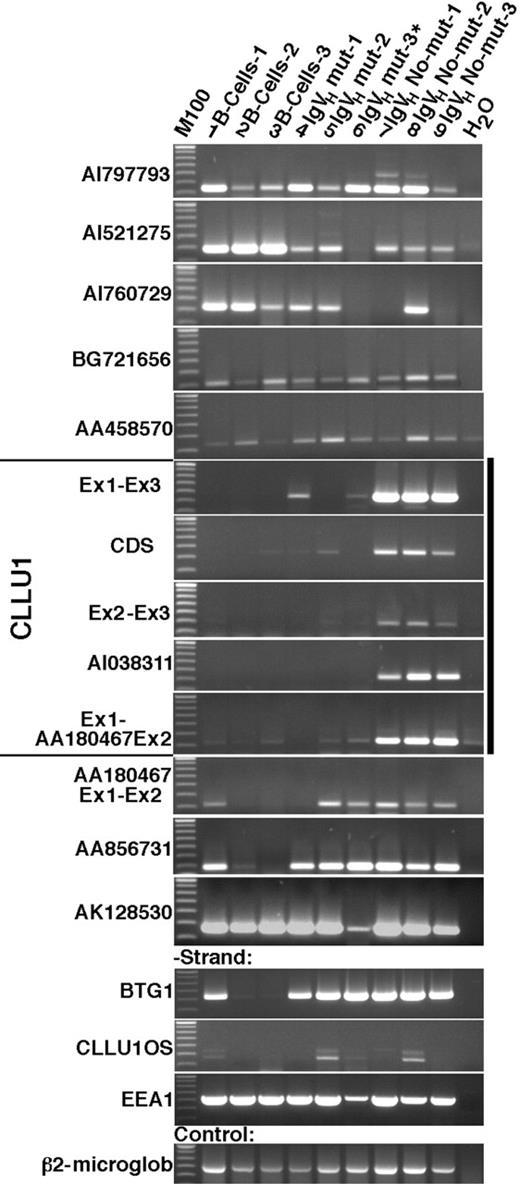
An mRNA with exon 2 spliced to exon 3 (cDNA2/cDNA 4) had previously been identified by RT-PCR, however, this mRNA was not detected by cDNA cloning or RACE (Figure 2B). The existence of spliced mRNAs with the CDS and exon 2 spliced to exon 3 was confirmed by RT-PCR on multiple CLL patient samples using nested primers (Table S1). We have made PCR reactions on cDNA made from double-DNase digested RNA (“Materials and methods”) using a large number of primer combinations covering all splice sites and internal sequences in all the putative exons (Figure 3; and results not shown). This confirmed the presence of all the mRNAs depicted in Figure 2B. Additionally, primers in the intron between exon 1 and 2 resulted in weak bands from poor-prognosis patients, suggesting the presence of an unspliced poly-adenylated transcript that spanned from exon 1 to exon 2 and maybe included exon 3, corresponding to the large 5′-RACE product. The gene has been assigned the name “CLL up-regulated gene 1” (CLLU1), and transcripts 1 to 6 (Figure 2B) have been assigned accession numbers AJ845162-7.
RT-PCR analysis of expression of transcripts in the 12q21.33-12q22 region. Three B-cell preparations from healthy donors and the patient samples previously analyzed by Northern blotting were analyzed by RT-PCR using primers specific for the genes, ESTs, and CLLU1 transcripts shown in Figure 2 (for a list of primers and analyzed transcripts, see Table S1). The size marker is a 100-bp ladder, and the top band in all images corresponds to 800 bp.
RT-PCR analysis of expression of transcripts in the 12q21.33-12q22 region. Three B-cell preparations from healthy donors and the patient samples previously analyzed by Northern blotting were analyzed by RT-PCR using primers specific for the genes, ESTs, and CLLU1 transcripts shown in Figure 2 (for a list of primers and analyzed transcripts, see Table S1). The size marker is a 100-bp ladder, and the top band in all images corresponds to 800 bp.
The cDNA derived from the -strand was composed of 4 exons (Figure 2B). There were 2 potential ORFs in the sequence (99 and 101 amino acids, respectively), but neither showed significant similarity to known protein sequences. The gene on the -strand has been named CLLU1OS and has accession number AJ845168.
Expression of genes in the 12q21-22 region
The 12q21.33-12q22 region is dense with ESTs derived from germinal center B cells and CLL cells (Figure 2A), suggesting that the region is highly accessible for transcription in B cells. We performed RT-PCR expression analysis of all the ESTs and genes in the region between BTG1 and EEA1 (Figure 2A) on RNA from 3 B-cell preparations from healthy donors and the CLL-cell samples previously analyzed by Northern blotting (Figure 3, Table 1). There was a large variation in the expression levels of the ESTs in proximity to CLLU1. The expression of all the CLLU1 transcripts consistently followed the presence or absence of IgVH mutations, while none of the other ESTs and genes in the region exhibited this trend (Figure 3). The only exception was EST AI038311, which was regulated as the CLLU1 transcripts (Figure 3); a likely explanation could be that EST AI038311, which is located only 1088 bp downstream from the 3′-end of CLLU1 exon 3, in fact is derived from an extension of CLLU1 transcripts. Interestingly, expression of cDNA3, derived from CLLU1 exon 1 spliced to exon 2 of the downstream EST AA180467, followed the IgVH mutational status, whereas the EST did not, suggesting that the high expression of CLLU1 transcripts in CLL originated from a promotor upstream of exon-1 (Figure 2B). RT-PCR and Northern blotting demonstrated that the most highly expressed transcripts were cDNA1 and 1a (Figure 2B), which only differ by the use of different polyadenylation sites.
To determine the CLLU1 levels in CLL patients, we performed quantitative real-time PCR, using primers spanning exon 1 to exon 3 (cDNA1 and 1a) and primers located within the CDS (cDNAs 4 and 5), standardized to normal B cells. As shown in Table 1, the expression of the CLLU1 splice variants varied dramatically between unmutated and mutated patient samples. This difference was also evident when a larger cohort consisting of samples from 59 CLL patients was investigated.43 In samples from mutated CLL patients (n = 32), cDNA1 expression was moderately elevated above the background expression of normal B cells (median, 5.7-fold up-regulation); only 3 mutated patients exhibited cDNA1 levels above 100-fold up-regulation. Unmutated samples (n = 25) contained up to several thousand-fold higher levels of cDNA1 (median, 305-fold up-regulation); none had levels below 10-fold up-regulation. A similar distribution was observed for the expression of CDS; IgVH mutated CLL patients exhibited moderate CDS expression (median, 3.2-fold up-regulation), and IgVH unmutated CLL patients had high CDS expression (median, 71.7-fold up-regulation).
High CLLU1 expression is limited to CLL
To determine the extent of CLLU1 expression, we hybridized a DNA fragment corresponding to exon 3 to a dot blot of RNA from 68 different human tissues and 12 human cell lines (Figure 4). Despite very long exposure time, the only significant signals were from control spots with human chromosomal DNA and Escherichia coli chromosomal DNA (that hybridizes to the probe because the probe was produced as a plasmid in E coli and thus is contaminated by a small amount of E coli chromosomal DNA). These results demonstrated that CLLU1 is not widely expressed. We further analyzed CLLU1 expression by QRT-PCR in a range of hematologic malignancies, normal B-cell subpopulations, human cord blood RNA, and leukemia cell lines (Table 2). CLLU1 was not up-regulated in any of the investigated samples. These results demonstrate that high CLLU1 expression may be confined to CLL cells, in particular CLL cells from patients without IgVH hypermutations.
Elevated CLLU1 expression is not dependent upon chromosomal aberrations
The high expression of CLLU1 in CLL cells could be related to aberrations at chromosome 12, thus we used different methods to search for such aberrations. A sample from a patient with trisomy 12 and mutated IgVH genes was included in the Northern blotting and the RT-PCR analysis (patient IgVH mut-3); the CLLU1 level in the trisomy 12 sample was similar to the level in other patients with somatic hypermutations (Figures 1 and 3). We have studied 2 additional CLL patients with trisomy 12 that did not exhibit elevated CLLU1 levels,43 and we therefore believe that the CLLU1 up-regulation is not a result of a gene dosage effect, and it is independent of the trisomy 12 aberration. Southern blot analysis of a CLL patient sample with very high CLLU1 level demonstrated integrity of the chromosomal region ranging from approximately 20 kbp upstream of exon 1 to 15 kbp downstream of exon 3 (results not shown), suggesting that no chromosomal breaks have occurred in the region.
CLLU1 hybridization to human multiple tissue RNA array. (A) Schematic representation of the tissues and cell lines represented on the filter. (B) Hybridization with a probe corresponding to exon 3 of CLLU1. The dot blot was the human MTE from Clontech. Despite very long exposure time (on phosphor imager), the only significant signals were from control spots with human and E coli chromosomal DNA. The signal from E coli is caused by the presence of a small amount of E coli chromosomal DNA in the plasmid preparation used to prepare the CLLU1 probe. The probe was random labeled with α[32P]dATP.
CLLU1 hybridization to human multiple tissue RNA array. (A) Schematic representation of the tissues and cell lines represented on the filter. (B) Hybridization with a probe corresponding to exon 3 of CLLU1. The dot blot was the human MTE from Clontech. Despite very long exposure time (on phosphor imager), the only significant signals were from control spots with human and E coli chromosomal DNA. The signal from E coli is caused by the presence of a small amount of E coli chromosomal DNA in the plasmid preparation used to prepare the CLLU1 probe. The probe was random labeled with α[32P]dATP.
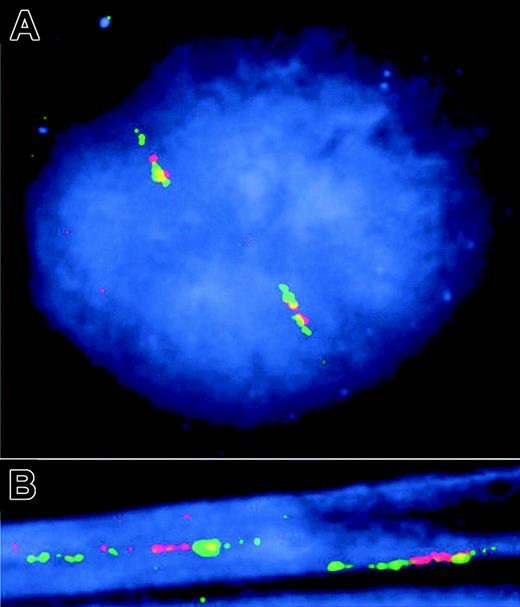
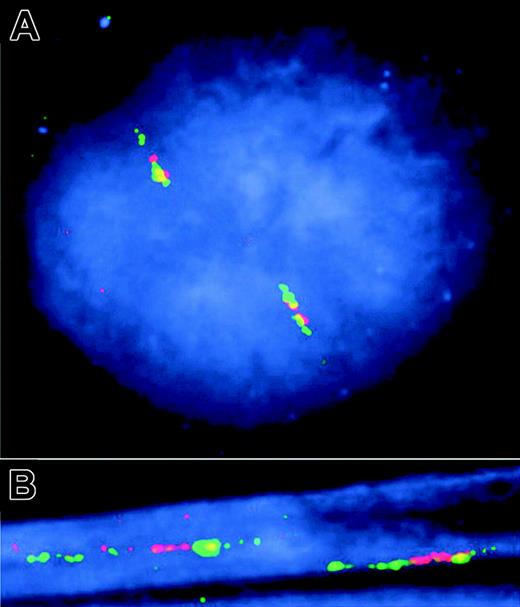
We also used 2-color fluorescence in situ hybridization (FISH) with partly overlapping BAC clones (Figure 2A), hybridized to interphase nuclei and DNA fibers, to scan for possible translocations and duplications affecting larger regions, but we did not find signs of any aberrations in a CLL patient sample with very high CLLU1 expression (Figure 5). Following hybridization of the fluorescent probes, the color pattern of the probes revealed that the chromosomal region is intact. The order of the BAC clones was as expected from the chromosomal structure, both when the analysis was done on interphase cells and when analysis was performed on extended DNA fibers. These results suggest that CLLU1 up-regulation occurs irrespective of trisomy 12, and in the absence of duplications or translocations at 12q22.
CLLU1 potentially encodes a peptide with similarity to IL-4
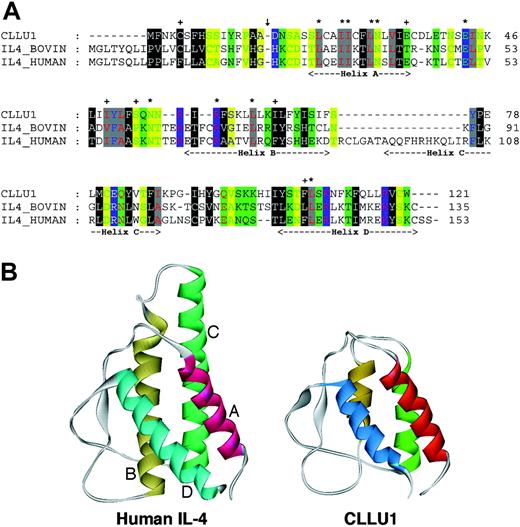
The CLLU1 transcripts have no significant similarity to other human genes or ESTs, and most of the transcripts appear to be noncoding. The only cDNAs with a significant reading frame were cDNA 4 and 5, of which only cDNA 4 included a splice site (Figure 2B). The CDS could potentially encode a 121 amino acid peptide. Searches in the Swiss Prot database showed a weak similarity to bovine IL-4 (Figure 6A); although the amino acid identity between CLLU1 and human and bovine IL-4 is low (8%), the similarity is surprisingly high (68%). A search using the 3D-PSSM server at the Structural Bioinformatics Group (www.sbg.bio.ic.ac.uk) revealed a potential structural similarity to human IL-4 and, with a lower score, also to other 4-helical cytokines. We therefore constructed a 3-dimensional model using a multiple sequence alignment of the CLLU1 peptide to IL-4 sequences from various species and the experimentally determined structure of human IL-424 as template. The model showed that it is possible for the putative peptide to adopt a 4-helical bundle structure that resembles human IL-4 (Figure 6B). The residues located on helices A and C of IL-4 are responsible for contact to the IL-4 receptor25 ; this is the part of the structure that show the highest similarity to CLLU1, and further 3D-modeling indicated that the peptide could potentially interact with the IL-4 receptor.
Attempts to synthesize the peptide in several expression systems, including E coli and insect cells, have so far been unsuccessful. We are currently optimizing in vitro translation and expression in mammalian systems in order to obtain CLLU1 protein expression.
Discussion
CLLU1 is the first example of a CLL-specific gene with a highly restricted expression pattern. CLLU1 maps to a region on chromosome 12q22, surrounded by genes that are active in germinal center B cells and CLL cells, suggesting that the region is accessible for transcription in B cells. Accordingly, we found a low “background” CLLU1 expression in B cells and in cell lines and malignancies with a B-cell origin, but a lower, in some cases undetectable, expression in non-B cells (Table 2). High CLLU1 expression was, however, detected only in CLL patients, not in any other tissues or in other hematologic malignancies.
Two-color FISH analysis of gene copy number on interphase nuclei and DNA fibers in a patient without IgVH mutations. (A) FISH to interphase nuclei with slightly extended DNA fibers. (B) FISH to highly extended DNA fibers. Three BAC clones (Figure 2) were visualized either by FITC (green) (AC026113 and AC012083) or by TexasRed (red) (AC063949). Because of the order and differential overlap of the 3 BAC clones, the expected order of the coloring is green-red-yellow-green. Inspection of a high number of nuclei and extended DNA fibers failed to reveal any additional gene copies, and the order of the BAC clones along the chromosomes, when possible to analyze, was as expected.
Two-color FISH analysis of gene copy number on interphase nuclei and DNA fibers in a patient without IgVH mutations. (A) FISH to interphase nuclei with slightly extended DNA fibers. (B) FISH to highly extended DNA fibers. Three BAC clones (Figure 2) were visualized either by FITC (green) (AC026113 and AC012083) or by TexasRed (red) (AC063949). Because of the order and differential overlap of the 3 BAC clones, the expected order of the coloring is green-red-yellow-green. Inspection of a high number of nuclei and extended DNA fibers failed to reveal any additional gene copies, and the order of the BAC clones along the chromosomes, when possible to analyze, was as expected.
Similarity between the CLLU1-encoded protein and IL-4. (A) Alignment of the peptide sequences of CLLU1 and IL-4 from bovine and human. Residues that are similar in their physiochemical properties in all 3 sequences are colored according to hydrophobic (white on black), aromatic (blue on gray), aliphatic (red on gray), polar (black on green), amphoteric (red on green), charged (white on blue), negative (green on blue), positive (red on blue), small (green on yellow), tiny (blue on yellow), glycine (yellow on red), and proline (blue on red). An asterisk indicates residues that are identical in all 3 sequences; +, residues that are conserved in CLLU1 and either bovine or human IL-4. The arrow indicates the position where the signal peptide is cleaved in human and bovine IL-4, and the extent of the 4 α-helixes is shown below the sequences. (B) Three-dimensional structure of human IL-4 (left) and the theoretic CLLU1 structure (right). The 4 α-helices are labeled A, B, C, and D.
Similarity between the CLLU1-encoded protein and IL-4. (A) Alignment of the peptide sequences of CLLU1 and IL-4 from bovine and human. Residues that are similar in their physiochemical properties in all 3 sequences are colored according to hydrophobic (white on black), aromatic (blue on gray), aliphatic (red on gray), polar (black on green), amphoteric (red on green), charged (white on blue), negative (green on blue), positive (red on blue), small (green on yellow), tiny (blue on yellow), glycine (yellow on red), and proline (blue on red). An asterisk indicates residues that are identical in all 3 sequences; +, residues that are conserved in CLLU1 and either bovine or human IL-4. The arrow indicates the position where the signal peptide is cleaved in human and bovine IL-4, and the extent of the 4 α-helixes is shown below the sequences. (B) Three-dimensional structure of human IL-4 (left) and the theoretic CLLU1 structure (right). The 4 α-helices are labeled A, B, C, and D.
All the CLLU1 transcripts were clustered in a small, approximately 85-kb region of chromosome 12q22. It is likely that all the differentially expressed mRNAs in fact are derived from the same primary transcript, with transcription starting at the 5′-end of exon 1 and continuing for more than 85 kb to include the downstream ESTs AI038311 and AA180467 (Figure 2A). Alternative splicing and the use of different poly-adenylation sites then generated the different transcripts. This would explain the difference in expression pattern of cDNA3 (composed of CLLU1 exon 1 and the exon 2 from ESTAA180467) and the transcript encoded by ESTAA180467 (Figure 3). It is very likely that the high expression of CLLU1 transcripts in CLL is a consequence of aberrant activation of a promotor upstream of exon 1.
The CLLU1 region can be identified in mice; however, in mice the region is fragmented and some parts are missing. In the identifiable regions the average similarity between human and mouse is only about 65%. The CDS, in particular, is not conserved in mice, and the presence of several frame shifts in the corresponding chimpanzee “CDS” sequence suggest that the CDS may be derived from a stretch of human-specific “junk DNA” that is included in a spliced mRNA when the CLLU1 gene becomes highly overexpressed. The lack of evolutionary conservation suggests that CLLU1 expression is not required for normal B-cell development. In fact, the absence of expression in all the tissues analyzed and the lack of conservation raises the possibility that CLLU1 may not be required for normal human function and development.
Chromosome 12 has earlier been implicated in CLL. It has been suggested that some CLL patients may have duplications of smaller regions of chromosome 1226,27 not easily detectable by the centromer probe that is most often used in interphase FISH studies. It is unclear which genes play a role in the trisomy 12 phenotype; microarray5 and QRT-PCR28 studies have suggested a number of candidate genes; however, analysis of protein levels of some of these genes did not reveal any difference in protein expression levels between CLL patients with and without the trisomy 12 aberration.29 The identification of CLLU1 again implicates chromosome 12 in CLL; however, CLLU1 up-regulation seems to occur independently of large chromosome 12 aberrations.
Most CLLU1 transcripts appear to be noncoding and no miRNAs were detected, nevertheless, the noncoding transcripts may have functions that presently have not been described. The potential IL-4-like structure of the CLLU1-encoded polypeptide is surprisingly intuitive to some CLL disease models. It is currently believed that CLL cells receive stimuli in their local environment in the lymph node or bone marrow that make them less susceptible to apoptosis and prolong their life span. Survival signals may be mediated by soluble factors such as IL-4,30 IL-2,31 IFN-α,32 and IFN-γ,33 or they may be transmitted by cell-cell contact in the microenvironment.34,35 Several reports have demonstrated how activation of the IL-4 signaling pathway can increase CLL-cell survival and decrease CLL-cell sensitivity to apoptotic stimuli.30,36,37 In accordance, treatment of CLL patients with IL-4 resulted in a more progressive disease with an increase in number of CLL cells in the blood.38 Thus, if the putative protein can act as an IL-4 receptor agonist, CLLU1 could be involved in the molecular pathogenesis of CLL.
The very restricted expression pattern, the location on chromosome 12q22, and the potential similarity to IL-4 support the notion that CLLU1 may be an important gene in CLL. If CLLU1 turns out to be involved in CLL pathogenesis, targeting of CLLU1, for example, using siRNA,39,40 could represent an ideal strategy for development of CLL-specific therapy because such therapy would not affect other tissues. If CLLU1 does not have an important role in CLL development or progression, due to its limited expression, CLLU1 may still be useful for targeting cell-suicide gene therapy to CLL cells.41,42
Prepublished online as Blood First Edition Paper, December 8, 2005; DOI 10.1182/blood-2005-07-2615.
Supported by grants from The Danish Cancer Society, the Danish Medical Research Council, and Svend Andersen's Foundation.
An Inside Blood analysis of this article appears at the front of this issue.
The publication costs of this article were defrayed in part by page charge payment. Therefore, and solely to indicate this fact, this article is hereby marked “advertisement” in accordance with 18 U.S.C. section 1734.
We thank Lone Bredo Pedersen, Inge Kobbernagel and Lone Bach for excellent technical assistance, Dr Hilmar Quentmeier, DSMZ Deutsche Sammlung von Mikroorganismen und Zellkulturen GmbH, Braunschweig for cell lines, and Dr Jørgen K. Larsen, Finsen Laboratory, Finsen Center, Rigshospitalet, Copenhagen, for FACS-sorting of B-lymphocyte subpopulations.


![Figure 4. CLLU1 hybridization to human multiple tissue RNA array. (A) Schematic representation of the tissues and cell lines represented on the filter. (B) Hybridization with a probe corresponding to exon 3 of CLLU1. The dot blot was the human MTE from Clontech. Despite very long exposure time (on phosphor imager), the only significant signals were from control spots with human and E coli chromosomal DNA. The signal from E coli is caused by the presence of a small amount of E coli chromosomal DNA in the plasmid preparation used to prepare the CLLU1 probe. The probe was random labeled with α[32P]dATP.](https://ash.silverchair-cdn.com/ash/content_public/journal/blood/107/7/10.1182_blood-2005-07-2615/5/m_zh80070693480004.jpeg?Expires=1765944571&Signature=F--HhPn1d7D-R61b-duTnpqFYG-9wBSzXSlj4~WS4QSmrvi0yNBEnParo5vatTjz7tt6ybjttXrVnxw6zcidqMaP~xWY8Rmc01g35XHUNRpdYFtlUjG3jt7~qB5X33W8Xt9FgTvQ579ccSDNWwTi5IUYXm00SyW4W2MW3l0tRp8dLCx6tuntZ~0hdKJIaypu5MySCB4EbcI~t8DVpoewcdjv9bqc7YCzqvncNeAFtA1s87WKTOjFInIUys2Czi9U1gY33NuiKATpKNE8GLhm4oEBy79lZ9AFTUPlUoX-cIVwWWRetua0mEgTiGJen44Vti21WwRP63kO8EmCjsoRNg__&Key-Pair-Id=APKAIE5G5CRDK6RD3PGA)



![Figure 4. CLLU1 hybridization to human multiple tissue RNA array. (A) Schematic representation of the tissues and cell lines represented on the filter. (B) Hybridization with a probe corresponding to exon 3 of CLLU1. The dot blot was the human MTE from Clontech. Despite very long exposure time (on phosphor imager), the only significant signals were from control spots with human and E coli chromosomal DNA. The signal from E coli is caused by the presence of a small amount of E coli chromosomal DNA in the plasmid preparation used to prepare the CLLU1 probe. The probe was random labeled with α[32P]dATP.](https://ash.silverchair-cdn.com/ash/content_public/journal/blood/107/7/10.1182_blood-2005-07-2615/5/m_zh80070693480004.jpeg?Expires=1765997684&Signature=hagZtWi0FQOmwTk6rP0OS-jo3SYhycS6fdTj1nAsrg5V86LnGJxLZzBmlytviI83kzQlOr3O8A33mbRTbh6KWDALqwxVT5yi3JeY1ooBimkpLO8uGw1ku~cZaygd06zdY2oyGP8bRnS2mU2sJm196M8kYneKzIoTGretBW6fsDMQkxWwBd0hRmx1YAEgwnDLG3m~r4UvKwjByFqoLaK8aBTu6BwHKsnFu4vwR~HkS28DBd-6~L8qWJKjRmQCsYZ18KwyEiN3mPbbOwMg~Jjs4VpIOodl6zgfCU~kKROUmyvNDzuBzDE18ZKlvbrmYMBIpn4OIm-yAdq9xTp5MQ8wAA__&Key-Pair-Id=APKAIE5G5CRDK6RD3PGA)
