Abstract
Hepcidin, a key regulator of iron metabolism, is expressed in the liver, distributed in blood, and excreted in urine. However, to date, no reliable and practical method for measuring the bioactive form of hepcidin in serum has been developed. Here, we used surface-enhanced laser desorption ionization time of flight mass spectrometry (SELDI-TOF MS) to analyze the distinctive serum proteomic patterns of patients receiving hemodialysis. In the range of 1000 to 15 000 m/z, we found 3 peptides at 2192, 2789, and 2851 m/z that showed a significant correlation with the serum ferritin levels. The molecular sizes of peptides at 2192 and 2789 m/z matched with the reported sizes of hepcidin-20 and -25, respectively, and the serum peptide at 2789 m/z was identified as hepcidin-25 by collision-induced dissociation tandem MS. By using SELDI-TOF MS, we developed a semiquantitative assay for hepcidin-25. In this assay, the level of serum hepcidin-25 correlated well with levels of serum ferritin and serum interleukin-6. Hepcidin-25 was found to accumulate in the serum of patients receiving hemodialysis; this could contribute to the pathogenesis of renal anemia by decreasing the available iron for hematopoiesis. Thus, SELDI-TOF MS would be a clinically useful tool to detect and semiquantify bioactive hepcidin in serum.
Introduction
Current understanding of the regulation of iron metabolism is based on the biology of a number of critical proteins, including transferrin, transferrin receptors, ferritin, iron regulatory proteins, divalent metal transporter 1, ferroportin, HFE, hemojuvelin, and hepcidin.1-6 Among these proteins, plasma transferrin and ferritin are generally measured in the laboratory as the total iron-binding capacity and an indicator of overall iron storage, respectively. The peptide hepcidin, which is produced by the liver, controls plasma iron levels by regulating the absorption of food iron from the intestine as well as the release of iron from macrophages. Further, it is also an acute-phase reactant induced by inflammation and shows antimicrobial activity in vitro.7-9 Moreover, it has been shown that expression of hepcidin is regulated by anemia and hypoxia.10 Assays for urine hepcidin have been previously described, and these were successfully applied to clinical cases.8,11,12 However, no reliable and practical assay system for measuring serum hepcidin has been developed to date.
In patients receiving hemodialysis, renal anemia is one of the major clinical problems, although it can be partially alleviated by the administration of human recombinant erythropoietin.13 In addition to the reduced production of erythropoietin in the kidneys, other factors such as hyperparathyroidism, aluminum toxicity, systemic infection, and impaired iron metabolism have been postulated as the mechanisms of anemia in these patients.14
In this study, we used a new technology, namely, surface-enhanced laser desorption/ionization time of flight mass spectrometry (SELDI-TOF MS), to analyze distinctive serum proteomic patterns in patients receiving hemodialysis. SELDI-based ProteinChip System (Ciphergen Biosystems, Freemont, CA) array technology has been successfully used to detect relevant biomarkers in various diseases such as immunologic conditions, cancer, neurologic conditions, cardiovascular conditions, and diseases of the lacrimal gland.15-18 SELDI technology is based on classic solidphase extraction chromatography combined with direct laser desorption/ionization mass spectrometric detection, and it requires minimal amounts of biologic fluid without pretreatment. This technology enables us to evaluate the subtle differences between disease and control patients with regard to the expression of individual proteins or groups of proteins in various fluids such as serum, urine, tears, or cerebrospinal fluid. Further, it has a number of advantages, including high throughput capability, very high sensitivity for detecting proteins in picomole to femtomole ranges, high resolution for low-molecular-weight proteins, ie, less than 20 kDa, and ease of operation. By using this technology, we compared the serum proteomic pattern and the level of serum ferritin in patients receiving hemodialysis to identify biomarkers associated with iron metabolism. In this experiment, we found 3 peptide peaks that showed a good correlation with the levels of serum ferritin; one of these peaks was identified as the peak of hepcidin-25. We developed a semiquantitative assay system for serum hepcidin-25 and applied it to some clinical cases with iron overload, iron deprivation, and acute and chronic inflammation. This new semiquantitative assay for serum hepcidin will extend the possibilities for studying iron homeostasis in physiologic as well as pathologic settings in humans.
Patients, materials, and methods
Study participants
Serum samples were obtained from 40 patients receiving hemodialysis before and after hemodialysis in the Renal Center of Kanazawa Medical University Hospital and Koshino Hospital (Japan). All patients received hemodialysis treatment 3 times a week. In addition, serum samples were collected from patients with acute pyelonephritis (2 patients), pneumonia (6 patients), and sepsis (8 patients) as well as from 16 healthy volunteers. Serial serum and urine samples obtained from 2 patients with acute pyelonephritis and 2 patients receiving hemodialysis who received intravenous iron administration for iron deficiency were also analyzed. Red blood cell (RBC) count, hemoglobin (Hb), hematocrit (Ht), plasma iron, and ferritin levels were evaluated for the clinical assessment of iron status and anemia. The serum samples were separated by centrifugation (1500g) and stored at –80°C until assayed. Approval was obtained from The Kanazawa Medical University Institutional Review Board for these studies, and informed consent was obtained from all the participants for the analysis of the protein profiling of serum and/or urine.
SELDI-TOF MS analysis of serum and urine proteins
For preliminary trials, multiple types of protein chips were used with various surface characteristics, including weak cation exchange, strong anion exchange, and immobilized metal affinity capture for protein molecules that bind divalent cationic copper. We eventually selected the immobilized metal affinity capture ProteinChip array (IMAC 30; Ciphergen) for the entire study because of its reproducibility in detecting protein species in serum and urine. SELDI analysis was performed according to the manufacturer's instructions with some modifications. In brief, serum and urine samples were diluted 20-fold and 10-fold, respectively, with a binding buffer (phosphate-buffered saline, pH 7.4). The dilution was determined by preliminary experiments. Using a bioprocessor, 40 μL of the diluted samples was applied onto different arrays of an IMAC 30 chip pretreated with 100 mM copper sulfate binding buffer and incubated at room temperature for 30 minutes with constant horizontal shaking. Unbound proteins were removed by washing 3 times with binding buffer for 5 minutes. The chip arrays were rinsed twice with 400 μL water and air-dried, and 0.5 μL α-cyano-4-hydroxy-cinnamic acid (CHCA; Ciphergen) in 50% acetonitrile (ACN) and 0.5% trifluoroacetic acid was added twice to the array surface. Next, the arrays were analyzed with the Ciphergen ProteinChip Reader (model PBS II; Ciphergen). The proteins with CHCA were ionized, and their molecular masses were determined by TOF analysis. The mass-charge ratio (m/z) of each of the proteins/peptides captured on the array surface was determined according to the externally calibrated standards: Arg8-vasopressin (1084.25 Da), somatostatin (1637.9 Da), dynorphin (2147.5 Da), bovine insulin β-chain (3495.94 Da), human insulin (5807.65 Da), bovine ubiquitin (8564.8 Da), and bovine cytochrome C (12 230.9 Da). The mass spectra of the samples were generated using an average of 80 laser shots at a laser intensity of 180 and a detector sensitivity of 10. For confirming reproducibility, each sample was applied to 2 separate spots on the IMAC 30 chip, and the mean value of 24 mass spectra from 12 different positions of each spot was taken as its representative value. Synthetic hepcidin-25 (Peptide Institute, Osaka, Japan) was used as a marker of MW2789. The data from the peak intensities were normalized with total ion current by using Biomarker Wizard (Ciphergen ProteinChip Software 3.1.1) to compensate for the variations in sample concentrations loaded onto a spot; the data were represented as arbitrary units (AU) calculated using this software.
pI value of peptides
The pI value was evaluated on the cationic ProteinChip array (CM 10; Ciphergen). Six aliquots of 1 serum sample were diluted with Tris-HCl buffer in the pH range of 8 to 10 at intervals of 0.4 pH units.
Purification, characterization, and identification of a biomarker candidate
The following purification strategy was determined preliminarily by using protein chip arrays on a micro scale. Human serum (100 μL) was diluted 4-fold with 50 mM Tris-HCl buffer, pH 8.0, and loaded onto a CM ceramic hyper DF spin column (BioSepra; Pall, East Hills, NY). After fractionation by applying increasing NaCl concentrations, the purification progress was monitored using IMAC 30 arrays. The fraction eluted by 500 mM NaCl was further separated by a reverse-phase high-performance liquid chromatography (HPLC). The fraction at a volume of 300 μL was applied to the Protein-RP column (250 × 4.6 mm; YMC, Kyoto, Japan) and eluted by a 10% to 60% ACN linear gradient. The fraction eluted at 46 minutes was collected and confirmed to contain the purified target peptide without other peptides by using normal-phase arrays (NP20; Ciphergen), which are used for general binding of peptides via serine, threonine, or lysine.
The fraction was reduced with 5 mM dithiothreitol (DTT) in 25 mM ammonium bicarbonate buffer for 2 minutes at 70°C or 50 mM iodoacetamide in 25 mM ammonium bicarbonate buffer for 30 minutes at room temperature under dark conditions in NP20 arrays to detect the number of internal disulfide bridges. DTT reduction alone or with iodoacetamide added 2 hydrogen atoms (2 Da) or 2 iodoacetamide molecules (114 Da) to form 2 free sulfhydryl groups for each disulfide bond broken, respectively.
For identification, the peptide was reduced by DTT and analyzed by QSTAR Pulsar i (Applied Biosystems, Foster City, CA) equipped with a PCI 1000 ProteinChip Array interface (Ciphergen) for collision-induced dissociation (CID) tandem MS analysis. Database searches were performed using Mascot (MatrixScience, London, United Kingdom).
Development of a semiquantitative assay for serum hepcidin-25
Synthetic hepcidin-25 was serially diluted in a range from 4 to 256 nM with distilled water. Each standard sample was further diluted 20-fold with 19-fold diluted human serum that had no detectable 2789 m/z peak. The diluted standard samples were applied to the SELDI-TOF MS to detect the peak at 2789 m/z as described in “SELDI-TOF MS analysis of serum and urine proteins.” Intraday precision was determined by using 4 different concentrations of synthetic hepcidin-25(4, 16, 64, and 256 nM) with 8 replicates being used per concentration. The 8 replicates were done on the 8 different chips within-day. This was repeated on 5 separate days to permit an assessment of interday precision. Intraday and interday precisions were also determined in the sera from 2 patients. Precision was assessed by coefficient of variation at each point.
Interleukin-6 concentration
The concentrations of serum interleukin (IL-6) were assayed with enzyme-linked immunosorbent assay (ELISA) kits (Quantikine HS; R&D Systems, Minneapolis, MN) according to the manufacturer's protocol.
Statistical analysis
Statistical analysis of paired variables was performed using the parametric paired t test. To study the linear relationship between continuous variables, Pearson correlation coefficients were calculated. To compare the inclination of regression lines, analysis of covariance was used. The comparison of the results from the experimental groups in intraassay and interassay was carried out by one-way analysis of variance followed by the Scheffe post hoc test. P values were calculated based on a 2-sided alternative hypothesis and values less than .05 were considered significant.
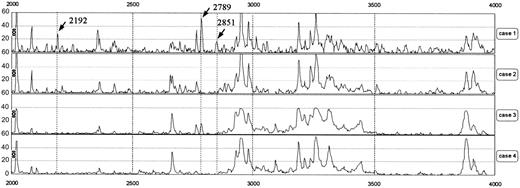
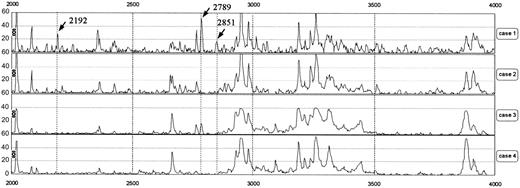
Representative protein mass spectra in the range of 2000 to 4000 m/z. Cases 1 and 2 were patients receiving hemodialysis and cases 3 and 4 were volunteers with normal renal function. Peaks at 2192, 2789, and 2851 m/z were observed in case 1 but not in cases 2 and 4. In case 3, the peak at 2789 m/z was slightly increased. r indicates Pearson correlation coefficient.
Representative protein mass spectra in the range of 2000 to 4000 m/z. Cases 1 and 2 were patients receiving hemodialysis and cases 3 and 4 were volunteers with normal renal function. Peaks at 2192, 2789, and 2851 m/z were observed in case 1 but not in cases 2 and 4. In case 3, the peak at 2789 m/z was slightly increased. r indicates Pearson correlation coefficient.
Results
Screening of serum proteins related to iron metabolism
Figure 1 shows representative protein mass spectra of sera in an m/z range of 2000 to 4000 from 2 patients receiving hemodialysis and 2 volunteers with normal renal function; the spectra reveal differences in their peak patterns. From the spectra of 62 participants, the Biomarker Wizard software (Ciphergen) automatically detected 114 peaks in the range of 1000 to 15 000 m/z.
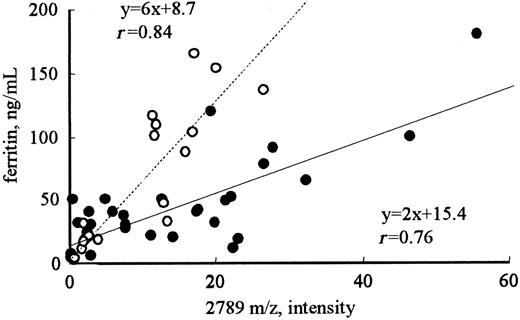
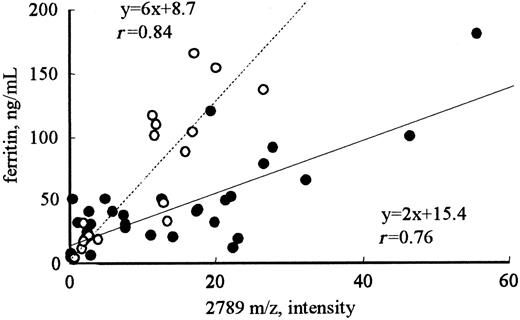
To determine the proteins related to iron metabolism, the correlation coefficients between the intensity of each peak and RBCs, Hb, Ht, serum iron, or ferritin were calculated (Table 1). For serum ferritin, the intensities of only 3 of the 114 peaks (2192, 2789, and 2851 m/z) showed good correlation coefficients, ie, greater than 0.8 (r = 0.93, 0.83, and 0.80, respectively). None of the peaks showed a significant correlation with RBCs, Hb, Ht, or serum iron. Correlations of the intensities of these peaks with serum ferritin were also observed in volunteers with normal renal function (r = 0.84; Figure 2). A significant correlation was also observed between the intensities of the 2192 and 2789 m/z peaks (r = 0.9), implicating that these 2 molecules may be regulated by the same mechanism.
By searching through a protein database (SWISS-PROT),19 we found that the peaks of 2192 m/z and 2789 m/z almost exactly correspond to the molecular weight of the oxidative forms of human hepcidin-20 (theoretical molecular weight of the reduced form in SWISS-PROT, 2199.78 Da) and hepcidin-25 (2797.41 Da), respectively. In a previous report,8 the molecular weights of hepcidin-20 and hepcidin-25 determined by matrix-assisted laser desorption ionization (MALDI)–TOF MS were 2191.77 and 2789.40 Da, respectively. In fact, the peak at 2789 m/z was identical to that of the synthetic hepcidin-25 peptide containing 4 disulfide bridges. The peak at 2851 m/z was not found in the database.
Characteristic evaluation of serum peptides corresponding to the 2192 and 2789 m/z peaks for pI
Cationic protein chip CM 10 was used for the pI evaluation of 2192 and 2789 m/z peaks. Tris-HCL buffer in the pH range of 8.0 to 10.0 was used as the diluting and washing buffer. Both peptides remained bound to the chip at pH 10 (Figure S1A, available on the Blood website; see the Supplemental Figures link at the top of the online article), suggesting that they were strongly cationic.
Purification of the serum peptide at the 2789 m/z peak: a biomarker candidate
On the basis of the results of molecular size and characteristics, we predicted that the peptide corresponding to the peak at 2789 m/z was hepcidin-25. To confirm this, we purified the peptide from human serum. The target peptide in the adsorption conditions at pH 8.0 was eluted by 500 mM NaCl in 50 mM Tris-HCl buffer on arrays (Figure S1A-B). These optimized purification conditions were directly applied to small-scale purification. Diluted serum was applied to the CM ceramic hyper DF spin column. After equilibration with the same buffer, elution was performed with a stepwise NaCl gradient from 0 to 500 mM and monitored by profiling on the ProteinChip system. The target peptide was eluted in the 500 mM NaCl fraction (Figure S1C). The eluant of 500 mM NaCl was then applied to a reverse-phase HPLC for further separation. The fraction that eluted at 46 minutes included the target 2789-Da peptide (Figure S1Da) and was selected for characterization and identification.
Correlation between the intensity of the 2789 m/z peak and the level of ferritin in patients receiving hemodialysis or in healthy volunteers. The intensities of the 2789 m/z peak in patients receiving hemodialysis (•) were significantly higher than those in healthy volunteers (○) with the same levels below 200 ng/mL ferritin (P < .001).
Correlation between the intensity of the 2789 m/z peak and the level of ferritin in patients receiving hemodialysis or in healthy volunteers. The intensities of the 2789 m/z peak in patients receiving hemodialysis (•) were significantly higher than those in healthy volunteers (○) with the same levels below 200 ng/mL ferritin (P < .001).
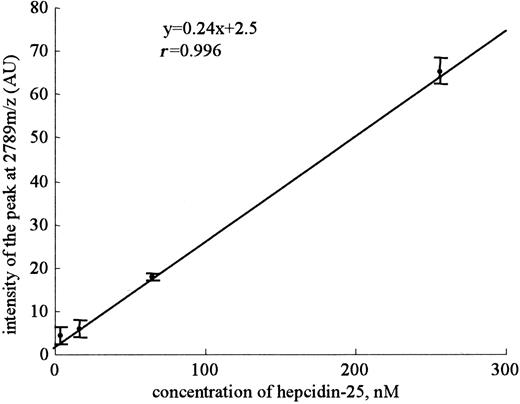
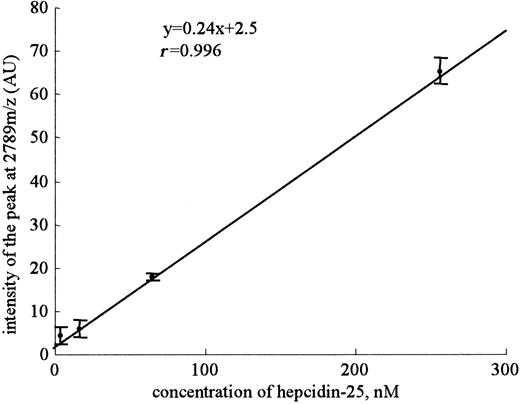
Mean slope from a set of 8 standard curves for hepcidin-25. The standard curves using synthetic hepcidin-25 were made using serial dilutions from a 100-mM stock concentration. Highly linear relationships between the peak intensities of 2789 m/z and the concentration of synthetic hepcidin-25 were obtained in a range from 4 nM to 256 nM in intra-assay. Eight replicates were done within-day. Dots and bars indicate means and SDs, respectively.
Mean slope from a set of 8 standard curves for hepcidin-25. The standard curves using synthetic hepcidin-25 were made using serial dilutions from a 100-mM stock concentration. Highly linear relationships between the peak intensities of 2789 m/z and the concentration of synthetic hepcidin-25 were obtained in a range from 4 nM to 256 nM in intra-assay. Eight replicates were done within-day. Dots and bars indicate means and SDs, respectively.
Characteristic evaluation of the peptide at the 2789 m/z peak for disulfide bridges
The effect of DTT on the fraction eluted at 46 minutes is shown in Figure S1D. The 2789 m/z peak was reduced after DTT treatment, and a new peak at 2797 m/z appeared (Figure S1Db), indicating that the peptide gained 8 Da after reduction. Furthermore, by DTT treatment with iodoacetamide, the peptide gained another 456 Da, thereby showing a peak at 3253 m/z (Figure S1Dc). These results suggested that the peptide at the 2789 m/z peak contained 4 internal disulfide bridges.
Identification of the 2789-Da marker candidate as hepcidin-25
To further characterize the candidate marker, the peptide was analyzed by CID tandem MS via the ProteinChip Interface. The masses of the product ions were applied to the Mascot search engine (Figure S1E). Search results showed that the amino acid sequence of this peptide was DTHFPICIFCCGCCHRSKCGMCCKT, and the top matching proteins were prohepcidin and hepcidin-25.
Development of a semiquantitative assay system for serum hepcidin-25
Because a practical assay for serum hepcidin-25 has not been reported, we decided to develop an assay system for this peptide by using SELDI-TOF MS. The evaluation of the performance characteristics of an assay system for this peptide by using SELDI-TOF MS was as follows. Linear standard curves were obtained for peak intensity at 2789 m/z (y = 0.24x + 2.5, r = 0.996) from a set of 8 standard curves when synthetic peptide was in a range from 4 nM to 256 nM (Figure 3). We found a small intra-assay precision (42.7%, 34.8%, 5.0%, and 4.6%) and a considerable interassay precision (33.8%, 35.2%, 29.4%, and 19.6%) at 4, 16, 64, and 256 nM, respectively. The lower limit of detection was defined at 16 nM (P < .001) as the lowest concentration of hepcidin-25 that could be differentiated from zero and had a signal-noise ratio greater than 2. The intra-assay precisions for 2 patients were 7.5% (peak intensity at 2789 m/z = 53.7 ± 4.0) and 9.2% (peak intensity at 2789 m/z = 6.4 ± 0.6), and the interassay precisions were 25.7% (peak intensity at 2789 m/z = 49.2 ± 12.6) and 27.5% (peak intensity at 2789 m/z = 8.8 ± 2.4), respectively. Thus, we considered that this assay was not completely quantitative but could be used as a semiquantitative assay system.
Clearance of hepcidin-25 by hemodialysis
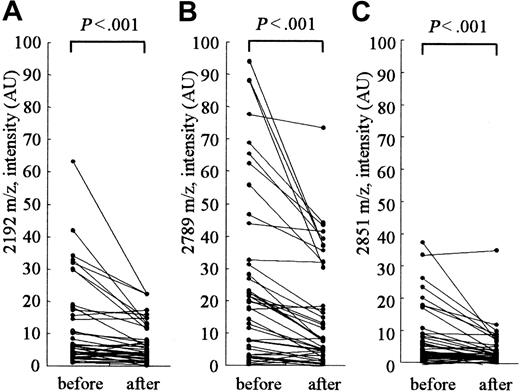
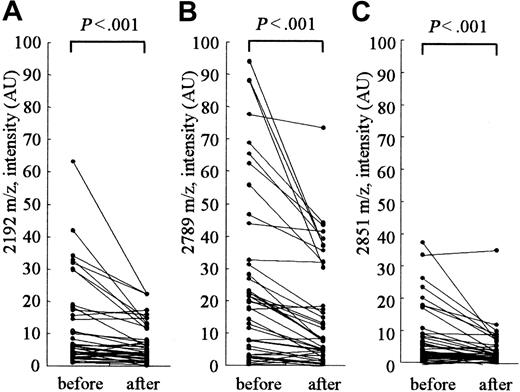
Figure 4 shows the changes in the peak intensities at 2192, 2789 (hepcidin-25), and 2851 m/z before and after hemodialysis. The hemodialysis procedure was performed for approximately 4 hours in each patient. The removal rate of blood urea nitrogen measured at the same time was 71.4% ± 2.4% in these patients. A clear reduction in the intensities of peaks at 2192, 2789, and 2851 m/z was observed in most patients; however, no reduction was observed in some patients. In patients receiving hemodialysis, the peak intensity at 2789 m/z (hepcidin-25) was significantly higher than that in healthy volunteers with the same levels below 200 ng/mL ferritin (Figure 2; P < .001); this indicates that hepcidin-25 may have an inclination to accumulate in the serum of patients receiving hemodialysis.
Time course of the level of serum hepcidin-25 after iron loading
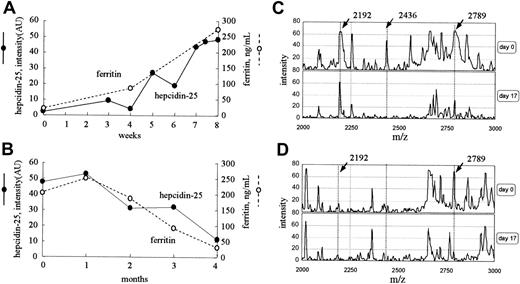
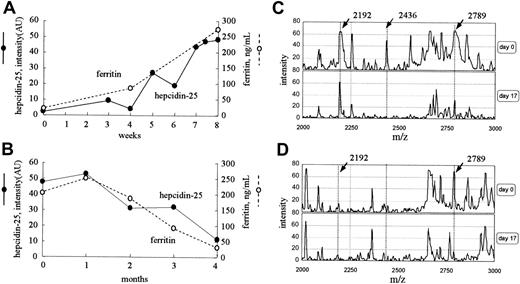
Figure 5A shows the time course of the serum hepcidin-25 and ferritin level in a 72-year-old woman who received intravenously 40 mg iron twice a week for 8 weeks for severe anemia. The intensity of the peak at 2789 m/z increased gradually from 2.2 to 48.4 AU with iron administration, and, during this period, the level of serum ferritin increased from 11.3 to 273 ng/mL. However, in a 34-year-old woman who had massive bleeding as a result of menstruation, the level of ferritin decreased from 202 to 28 ng/mL during a period of 4 months, and the peak intensity at 2789 m/z also reduced gradually from 47.8 to 11.2 AU (Figure 5B). In both cases, no remarkable changes were found in the peak patterns, except for the peaks at 2192 and 2789 m/z. The dialysis conditions for these 2 patients were the same throughout these periods.
Clearance of serum peptides at 2192, 2789, and 2851 m/z by hemodialysis. The intensities of peaks at 2192 m/z (A), 2789 m/z (hepcidin-25) (B), and 2851 m/z (C) were significantly reduced after hemodialysis.
Clearance of serum peptides at 2192, 2789, and 2851 m/z by hemodialysis. The intensities of peaks at 2192 m/z (A), 2789 m/z (hepcidin-25) (B), and 2851 m/z (C) were significantly reduced after hemodialysis.
Time courses of clinical cases. (A) Serum levels of both hepcidin-25 and ferritin increased with intravenous iron administration for 8 weeks in a patient with iron deficiency anemia receiving hemodialysis. (B) Serum levels of both hepcidin-25 and ferritin gradually decreased in the period of 4 months in a patient receiving hemodialysis who had massive periodic hemorrhage as a result of menstruation. (C-D) The expression of hepcidin in inflammation. Protein profiling of urine (C) and serum (D) from a patient with acute pyelonephritis before (day 0) and after (day 17) treatment with antibiotics is shown. AU indicates arbitrary unit.
Time courses of clinical cases. (A) Serum levels of both hepcidin-25 and ferritin increased with intravenous iron administration for 8 weeks in a patient with iron deficiency anemia receiving hemodialysis. (B) Serum levels of both hepcidin-25 and ferritin gradually decreased in the period of 4 months in a patient receiving hemodialysis who had massive periodic hemorrhage as a result of menstruation. (C-D) The expression of hepcidin in inflammation. Protein profiling of urine (C) and serum (D) from a patient with acute pyelonephritis before (day 0) and after (day 17) treatment with antibiotics is shown. AU indicates arbitrary unit.
Analysis of hepcidin-25 in the serum and urine of a patient with acute pyelonephritis
Protein profiling of urine and serum from a patient with acute pyelonephritis is shown in Figure 5C-D. The peak at 2789 m/z was prominent in both urine and serum, and the peaks at 2192 m/z and 2436 m/z were prominent only in urine before treatment. The patient was successfully treated with antibiotics for 7 days. By day 17, the peak at 2789 m/z (hepcidin-25) decreased from 66 to 32 AU in urine and from 66 to 18 AU in serum. In urine, the peak intensity at 2192 m/z did not change remarkably during this period. The levels of ferritin on day 0 and day 17 were 343.7 and 230.6 ng/mL, respectively.
Association of serum hepcidin-25 levels with serum IL-6 concentrations
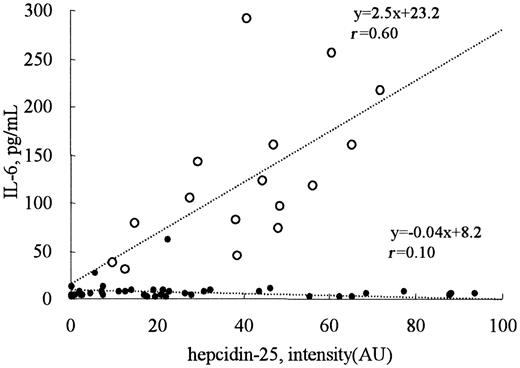
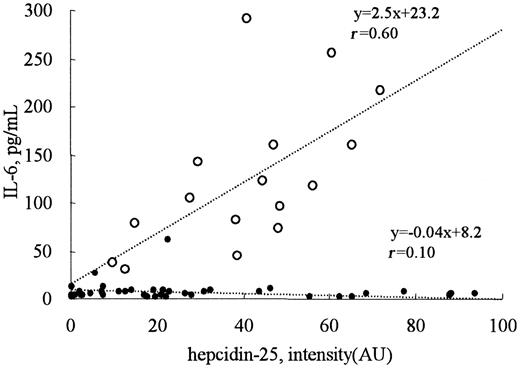
Serum IL-6 concentrations were less than 30 pg/mL in all patients receiving hemodialysis, except one with systemic lupus erythematosus who had been treated with glucocorticoids (Figure 6). In contrast, the serum IL-6 levels in patients with acute inflammation, including pyelonephritis, pneumonia, and sepsis, were elevated and showed good correlation with the intensity of the 2789 m/z peak (r = 0.60) which should reflect the serum concentration of hepcidin-25 (Figure 6).
Correlation between the levels of hepcidin-25 and IL-6. The serum IL-6 concentrations were less than 30 pg/mL in all the patients receiving hemodialysis (•, n = 40), except one with systemic lupus erythematosus. In patients with inflammation (○, n = 16), a good correlation was observed between the levels of hepcidin-25 and IL-6 (r = 0.60).
Correlation between the levels of hepcidin-25 and IL-6. The serum IL-6 concentrations were less than 30 pg/mL in all the patients receiving hemodialysis (•, n = 40), except one with systemic lupus erythematosus. In patients with inflammation (○, n = 16), a good correlation was observed between the levels of hepcidin-25 and IL-6 (r = 0.60).
Discussion
In this study, we used SELDI-TOF MS technology to identify serum proteins that are regulated by body iron status and found a cluster of peptides at 2192, 2789, and 2851 m/z based on the correlation with the level of serum ferritin. The sizes of 2 of these peptides at 2192 m/z and 2789 m/z almost exactly matched with those of hepcidin-20 and -25 reported by Park et al.8 Similar to hepcidin-20 and -25, these peptides were strongly cationic. We purified the serum peptide corresponding to the peak at 2789 m/z and identified it as hepcidin-25 by CID tandem MS. Because hepcidin is a key molecule in iron homeostasis, the measurement of its active form can be a useful tool for the differential diagnosis of anemia and iron overload in human diseases.20 Therefore, in the present study, we focused on characterizing the peak of hepcidin-25, and the detailed characterization of the other 2 peptides was left for future study.
In this study, we developed a semiquantitative assay system for serum hepcidin-25. The standard curve shown in Figure 3 revealed that the effective measuring range of this assay was approximately 16 to 256 nM. This assay appears to be suitable for detecting high levels of serum hepcidin. Some of the human iron disorders such as hereditary hemochromatosis are caused by hepcidin deficiency1,4,20 ; however, this assay may not be sufficiently sensitive to detect such abnormally low levels of serum hepcidin. In this system, the serum expression of hepcidin-25 showed a good correlation with that of serum ferritin in patients receiving hemodialysis as well as in healthy volunteers (Figure 2). This correlation was also observed in serial samples from a patient who received iron supplementation as well as in a patient with repeated massive hemorrhage (Figure 5A-B). Furthermore, hepcidin-25 in both serum and urine was very high in a patient with urinary tract infection; after treatment with antibiotics, the levels of hepcidin-25 in both serum and urine showed a clear decrease (Figure 5C-D). These results are consistent with the current understanding of the regulation of the expression of hepcidin,1,4,20 implicating that our semiquantitative assay system may be useful in clinical settings. In addition, this assay system may be a useful tool for analyzing rapid iron metabolism in the body. For example, Nemeth et al21 have shown that the stimulatory effects of dietary iron rapidly induce the expression of hepcidin and reduce iron absorption from the intestine; however, the kinetics of hepcidin in the serum during this “mucosal block phenomenon” remains unknown. Our SELDI-based assay system could be applied to detect and analyze the rapid kinetics of the bioactive form of serum hepcidin in such phenomena.
Park et al8 detected hepcidin-20, -22, and -25 in urine by using MALDI-TOF MS analysis. Nemeth et al11 successfully measured urine hepcidin by using Western blotting following chromatographic purification. Recently, Kemna et al12 reported a semiquantitative method to analyze urine hepcidin by SELDI technology using hydrophilic normal-phase chips (NP20). However, to date, no reliable and practical method for quantifying the mature forms of serum hepcidin has been developed, probably because of the difficulty involved in developing specific antibodies against these peptides, which have compact-folding structures22 and may also be due to the complexity of the serum matrix that deteriorates the reproducibility and linearity of various assays, including MS. The serum concentration of prohepcidin, an immature form of hepcidin, has been measured by ELISA.23,24 In previous studies,24-26 elevated levels of serum prohepcidin measured by ELISA were found in renal insufficiency; however, no clear relationship between serum prohepcidin concentration and body iron status was observed. Prohepcidin, which is produced in the liver, needs to be processed by specific proteases to generate the mature forms of hepcidin that are observed in urine and in the circulation.8 Kemna et al12 analyzed urine samples from patients with iron deficiency anemia, hereditary hemochromatosis, and sepsis and detected 3 peaks that corresponded to the molecular weights of hepcidin-20, -22, and -25. Hepcidin-25, the major form of mature hepcidin, is cleaved from prohepcidin by convertases, and hepcidin-20 and -22 may be directly generated from prohepcidin by specific convertases or indirectly by degradation of hepcidin-25. Hepcidin-25 has both iron-regulatory and antimicrobial activities; hepcidin-22 has potent antimicrobial activity in vitro, although no iron-regulatory function of hepcidin-20 has been identified.8,25 In the present study, we detected the peaks corresponding to hepcidin-20 and -25 in the serum but could not detect the peak corresponding to hepcidin-22 as a biomarker candidate related to iron status, although it was detected only in urine of acute pyelonephritis. According to the report by Park et al,8 hepcidin-20 and -25 are the major forms of hepcidin in urine, whereas hepcidin-22 is a minor form in urine. The same may be true in serum. However, it is unclear whether urinary hepcidin is filtered from the blood or originates from the kidney. It has been shown that hepcidin is expressed not only in the liver but also in the renal tubular cells27 ; therefore, it may be released partly from the kidneys in the case of renal interstitial inflammation.
At present, it is well documented that hepcidin is reduced by anemia and hypoxia and induced by inflammation,10 and the association between hepcidin and inflammation is becoming clearer.28 IL-6 appears to be the major cytokine responsible for the induction of hepcidin production in inflammation, and IL-1β may be the second cytokine that induces hepcidin production.28,29 IL-6 induces the expression of hepcidin mRNA in human hepatocytes, a hepatoma cell line, and mouse hepatocytes in vitro.11,21,30 In the in vivo model of inflammation induced by turpentine, the expression of hepcidin mRNA in the liver was increased in the wild-type mice but not in the IL-6 knockout mice.21 In human studies, only a few reports have been published about the association between hepcidin and inflammation. These reports showed that urinary excretion of hepcidin was greatly increased in patients with anemia of inflammation, acute infection with epididymitis,11 and severe sepsis.12 Nemeth et al21 reported that IL-6 infusion to human volunteers caused a rapid increase in hepcidin excretion in urine. However, to date the correlation between hepcidin and IL-6 in serum has not been investigated. In this study, we showed that the increased levels of serum IL-6 in acute pyelonephritis, pneumonia, and sepsis were accompanied with increased serum hepcidin levels.
It is well documented that iron overload stimulates the expression of both ferritin and hepcidin. Similarly, inflammatory cytokines such as IL-6 may also contribute to the increase in not only serum hepcidin but also serum ferritin in human diseases. Nemeth et al11 reported that in anemia of inflammation and sepsis, the urinary hepcidin excretion correlated well with the serum ferritin concentration. Rogers31 reported that IL-6 induced the expression of ferritin at the translational level, because the mRNA levels of ferritin H and L subunits remained unchanged, whereas the synthesis of ferritin subunits increased. In the case of hepcidin, IL-6 induces its expression at the mRNA level.20 The toxicity of iron in the cellular system is largely attributable to its capacity to participate in the generation of reactive oxygen species.32 Ferritin captures and buffers the intracellular labile iron pool to protect the cells,32 whereas hepcidin may prevent iron toxicity by inhibiting iron absorption from the intestine. Thus, in the condition of iron overload, active hepcidin might physiologically play a key role along with ferritin in maintaining iron homeostasis. However, the precise mechanism of induction of hepcidin by IL-6 and iron overload remains unclear.20
Low-molecular-weight proteins/peptides comprise several classes of physiologically important proteins such as cytokines, chemokines, peptide hormones, and proteolytic fragments of larger proteins.33 Interestingly, 114 small proteins in the serum with a molecular weight less than 15 000 Da were detectable even in volunteers with normal renal function, although these peptides are smaller than the presumed cutoff size for kidney filtration. Furthermore, the 2 peptides at 2192 and 2789 m/z (hepcidin-20 and -25, respectively) were sufficiently cationic to be filtered through the anionic glomerular basement membrane; this suggests that these peptides may be parts of larger protein complexes or may have unknown specific retention mechanisms. The intensities of these 2 peaks corresponding to hepcidin-20 and -25 in patients receiving hemodialysis were higher than those in healthy volunteers when adjusted with the levels of serum ferritin (Figure 2). In addition, hepcidin-25 did not decrease after the hemodialysis procedure in some patients, indicating that hemodialysis could not sufficiently remove excess hepcidin-25. Alternatively, these results may reflect the induction of hepcidin expression because of the hemodialysis procedure itself. In either case, the accumulation of hepcidin-25 in serum probably contributes, at least in part, to the pathogenesis of renal anemia in patients receiving hemodialysis by decreasing the available iron for hematopoiesis.
Prepublished online as Blood First Edition Paper, April 18, 2006; DOI 10.1182/blood-2005-10-4043.
Supported in part by a Grant-in-Aid from the Ministry of Education, Culture, Sports, Science, and Technology of Japan.
The online version of this article contains a data supplement.
The publication costs of this article were defrayed in part by page charge payment. Therefore, and solely to indicate this fact, this article is hereby marked “advertisement” in accordance with 18 U.S.C. section 1734.
We thank Dr Y. Koshino, Ms S. Miyagishi, M. Fukuta, and Y. Izaki for their excellent technical support.

